. 2022 May;148(5):1045-1055.
doi: 10.1007/s00432-021-03854-6. Epub 2022 Jan 24.

Ex vivo propagation in a novel 3D high-throughput co-culture system for multiple myeloma

Affiliations

Ex vivo propagation in a novel 3D high-throughput co-culture system for multiple myeloma

Johannes M Waldschmidt et al. J Cancer Res Clin Oncol. 2022 May.

Abstract

Purpose: Multiple myeloma (MM) remains an incurable hematologic malignancy which ultimately develops drug resistance and evades treatment. Despite substantial therapeutic advances over the past years, the clinical failure rate of preclinically promising anti-MM drugs remains substantial. More realistic in vitro models are thus required to better predict clinical efficacy of a preclinically active compound.

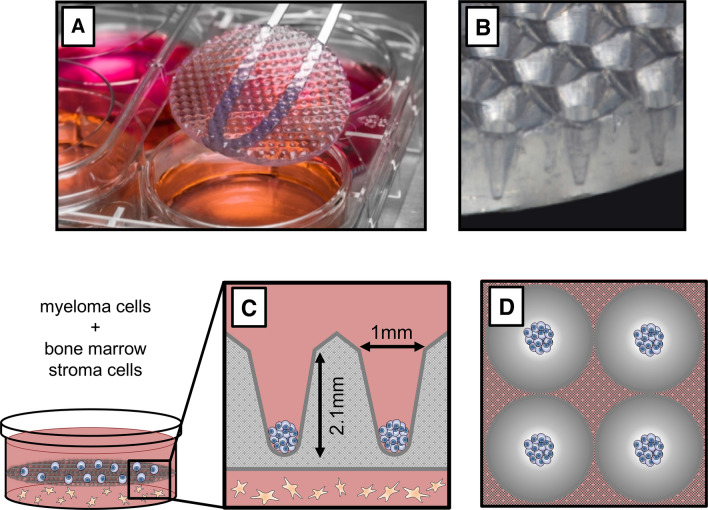
Methods: Here, we report on the establishment of a conical agarose 3D co-culture platform for the preclinical propagation of primary MM cells ex vivo. Cell growth was compared to yet established 2D and liquid overlay systems. MM cell lines (MMCL: RPMI-8226, U266, OPM-2) and primary patient specimens were tested. Drug sensitivity was examined by exploring the cytotoxic effect of bortezomib and the deubiquitinase inhibitor auranofin under various conditions.

Results: In contrast to 2D and liquid overlay, cell proliferation in the 3D array followed a sigmoidal curve characterized by an initial growth delay but more durable proliferation of MMCL over 12 days of culture. Primary MM specimens did not expand in ex vivo monoculture, but required co-culture support by a human stromal cell line (HS-5, MSP-1). HS-5 induced a > fivefold increase in cluster volume and maintained long-term viability of primary MM cells for up to 21 days. Bortezomib and auranofin induced less cytotoxicity under 3D vs. 2D condition and in co- vs. monoculture, respectively.

Conclusions: This study introduces a novel model that is capable of long-term propagation and drug testing of primary MM specimens ex vivo overcoming some of the pitfalls of currently available in vitro models.

Keywords: Auranofin; Bone marrow microenvironment; Bortezomib; Drug discovery; In vitro modeling; Multiple myeloma.


Conflict of interest statement

A.R.T.: Inventor of 3D CoSeedis (patent #EP2917326A1 and #WO2014072432A1); consultant to abc biopply. 3D CoSeedis is commercially licensed by abc biopply, Cham, Switzerland. All other authors report no conflict of interest with regard to this publication.

Figures

Fig. 1
Fig. 1
Details of the conical agarose microwell array platform. A Photography of the agarose microwell disk inserted into a 6-well plate. B Lateral view showing conical microwells inside a membrane. C Sketch depicting distance co-culture. MM cells are seeded into 3D CoSeedis, and then, the microwell array is placed on the monolayer composed of BM stromal cells. Agarose permeability allows for diffusion of gas and small biomolecules. Each cavity measures 1 × 2.1 mm. D Sketch showing cell aggregates in four microwells
Fig. 2
Fig. 2
Proliferation in the conical agarose microwell array. A Sketch depicting the experimental approach. Proliferation of RPMI-8226 was assessed in a flat two-dimensional (2D) monolayer as compared to liquid overlay technique (LOT) versus the 3D conical agarose microwell array (3D CoSeedis) platform. B ATP content indicates a bell-shaped growth pattern for RPMI-8226 cells in the 2D and LOT model. Cell growth in the 3D microwell model was delayed but followed a sigmoidal pattern and was ongoing after 12 days of observation
Fig. 3
Fig. 3
Impact of HS-5 stromal co-culture on proliferation and cluster size. A ATP content in RPMI-8226 cells culture in the 3D conical agarose microwell array as mono- vs. HS-5 co-culture. B Cluster volume of RPMI-8226 cells culture in the 3D conical agarose microwell array as mono- vs. HS-5 co-culture measured by transmitted-light scanner method. C Sketch showing cell aggregates in three microwells. This model uses the measuring cup principle for determination of cell proliferation. D Microscopy and scan of agarose matrix disk containing cell aggregates (100 × , 25 ×  and 1 × )
Fig. 4
Fig. 4
Drug resistance in the conical agarose microwell array. A Microscopy (left panel) and confocal microscopy of one microwell show equal distribution of CFSE (green) and CellTrace Violet within an aggregate of mCherry-transduced RPMI-8226. B Comparison of PI positivity in untreated RPMI-8226 cells and RPMI-8226 cells treated with bortezomib (6 nM) over 48 h. C Comparison of CD138 positivity in untreated RPMI-8226 cells and RPMI-8226 cells treated with bortezomib (6 nM) over 48 h. D Comparison of PI positivity in untreated RPMI-8226 cells and RPMI-8226 cells treated with auranofin (3 µM) over 48 h. E Comparison of CD138 positivity in untreated RPMI-8226 cells and RPMI-8226 cells treated with auranofin (3 µM) over 48 h. Conditions in B–E varied by model (2D vs. 3D microwell) and co-culture (monoculture vs. HS-5 co-culture). P values are as indicated *P ≤ 0.05, **P ≤ 0.01, ***P ≤ 0.001
Fig. 5
Fig. 5
Long-term propagation of primary MM cells ex vivo. A Cytokine secretion measured by multiplex array from supernatants of RPMI-8226, OPM-2, and primary MM cells after 6 days with and without HS-5 co-culture. B Cluster volume measured by transmitted-light scanner methods shows the critical impact of co-culture for the propagation of primary patient specimens ex vivo (n = 6). Growth support is improved with HS-5 as compared to MSP-1. Cells continue to proliferate at day 21 ex vivo. C Longitudinal monitoring of primary MM cells derived from the bone marrow of a 51-year-old patient with high-risk IgG kappa MM. Assessment is shown for day 14 ex vivo using microscopy (left column), Pappenheim stain (middle panel) and IHC for CD38 (right panel). Serial monitoring demonstrated less cluster cell expansion of MM cells in monoculture (a). Plasma cell (PC) morphology via microscopy/Pappenheim stain remained apparent (b), but with few CD38 positive PCs in IHC (c). Co-culture with MSP-1 stimulated cluster expansion of primary PCs (d). PCs were densely accumulating (e) and led to much larger PC clusters with CD38 positive cells (f) in the presence of MSP-1 stromal support. Cluster size and CD38 positivity were further enhanced in gi with HS-5 stromal support in 3D culture

References

    1. Abe M, Hiura K, Wilde J et al (2004) Osteoclasts enhance myeloma cell growth and survival via cell-cell contact: a vicious cycle between bone destruction and myeloma expansion. Blood 104:2484–2491. 10.1182/blood-2003-11-3839 - PubMed
    1. American Cancer Society. Key statistics for multiple myeloma. https://www.cancer.org/cancer/multiple-myeloma/about/key-statistics.html. Accessed 13 June 2021
    1. Azab AK, Azab F, Blotta S et al (2009a) RhoA and Rac1 GTPases play major and differential roles in stromal cell-derived factor-1-induced cell adhesion and chemotaxis in multiple myeloma. Blood 114:619–629. 10.1182/blood-2009-01-199281 - PMC - PubMed
    1. Azab AK, Runnels JM, Pitsillides C et al (2009b) CXCR4 inhibitor AMD3100 disrupts the interaction of multiple myeloma cells with the bone marrow microenvironment and enhances their sensitivity to therapy. Blood 113:4341–4351. 10.1182/blood-2008-10-186668 - PMC - PubMed
    1. Azab AK, Hu J, Quang P et al (2012) Hypoxia promotes dissemination of multiple myeloma through acquisition of epithelial to mesenchymal transition-like features. Blood 119:5782–5794. 10.1182/blood-2011-09-380410 - PMC - PubMed