. 2022 Jan 24;18(1):e1009813.
doi: 10.1371/journal.pcbi.1009813. eCollection 2022 Jan.

Foraging as sampling without replacement: A Bayesian statistical model for estimating biases in target selection

Affiliations

Foraging as sampling without replacement: A Bayesian statistical model for estimating biases in target selection

Alasdair D F Clarke et al. PLoS Comput Biol. .

Erratum in

Abstract

Foraging entails finding multiple targets sequentially. In humans and other animals, a key observation has been a tendency to forage in 'runs' of the same target type. This tendency is context-sensitive, and in humans, it is strongest when the targets are difficult to distinguish from the distractors. Many important questions have yet to be addressed about this and other tendencies in human foraging, and a key limitation is a lack of precise measures of foraging behaviour. The standard measures tend to be run statistics, such as the maximum run length and the number of runs. But these measures are not only interdependent, they are also constrained by the number and distribution of targets, making it difficult to make inferences about the effects of these aspects of the environment on foraging. Moreover, run statistics are underspecified about the underlying cognitive processes determining foraging behaviour. We present an alternative approach: modelling foraging as a procedure of generative sampling without replacement, implemented in a Bayesian multilevel model. This allows us to break behaviour down into a number of biases that influence target selection, such as the proximity of targets and a bias for selecting targets in runs, in a way that is not dependent on the number of targets present. Our method thereby facilitates direct comparison of specific foraging tendencies between search environments that differ in theoretically important dimensions. We demonstrate the use of our model with simulation examples and re-analysis of existing data. We believe our model will provide deeper insights into visual foraging and provide a foundation for further modelling work in this area.


Conflict of interest statement

The authors have declared that no competing interests exist.

Figures

Fig 1
Fig 1. Example data from Dawkins (1971).
The first 100 grains taken by one chick in experiment 1.
Fig 2
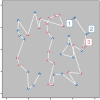
Fig 2. An example of how foraging tasks can be thought of as spatial, using example data from Kristjánsson et al. (2014).
The ‘path’ taken by the forager is indicated by the white line, with the numbers indicating the order of targets taken (first three selections only).
Fig 3
Fig 3. Prior and posterior probability distributions for ps for the chicken foraging data from Dawkins (1971).
Fig 4
Fig 4. Results for simulated biases in the bag model.
A: boxplots showing the maximum run length and number of runs in each of our two simulated misattribution conditions. B: boxplots showing the maximum run length and number of runs in each of our two simulated differentiation conditions. C: density plots showing the pa and ps values calculated by our model for each of the two simulated misattribution conditions. D: density plots showing the pa and ps values calculated by our model for each of the two simulated differentiation conditions.
Fig 5
Fig 5. pa and ps biases across participants in multi-level re-analysis of Tagu and Kristjánsson (2021), showing both the value and no-value conditions.
Fig 6
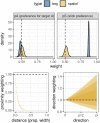
Fig 6. Posterior distributions for both a bag foraging model and a spatial model trained on patchy stimuli, where target types are clumped.
The shaded ribbons for the proximity and direction weighting indicate 53%, 89% and 97% HPDIs. The spatial model gives more weight to nearby targets (i.e. where the distance is close to zero), and has no particular preference for any direction, as indicated by the fact that a value of 1 falls within the HPDI for all directions.
Fig 7
Fig 7. Posterior distributions for our model when trained on data from Clarke et al. (2018).
The shaded ribbons for the proximity and direction weighting indicate 53%, 89% and 97% HPDIs. Note that there is a higher weighting for directions closer to pi i.e. completely reversing the direction, indicating negative momentum.
Fig 8
Fig 8. Individual differences in Clarke et al. (2018).
The first two rows show the correlations in the random effect structure between different parameters. We can see that ps and ps appear to be independent from one another, and independent from the spatial biases bp and pm. However, bp and pm are correlated with one another in both the feature and conjunction conditions. The bottom row shows the correlation between conditions for each parameter in our model.
Fig 9
Fig 9. Posterior predictions for Clarke et al. (2018).
(top:) Scatter plots between empirical and predicted summary run statistics. Error bars indicated 89% HPDI for the posterior predictions. (bottom:) Comparison of inter-target distances and how they vary over time. Shaded region gives 89% intervals.

References

    1. Pyke GH. Optimal foraging theory: a critical review. Annual review of ecology and systematics. 1984;15(1):523–575. doi: 10.1146/annurev.es.15.110184.002515 - DOI
    1. Brown JS. Patch use as an indicator of habitat preference, predation risk, and competition. Behavioral ecology and sociobiology. 1988;22(1):37–47. doi: 10.1007/BF00395696 - DOI
    1. Wolfe JM. When is it time to move to the next raspberry bush? Foraging rules in human visual search. Journal of vision. 2013;13(3):10–10. doi: 10.1167/13.3.10 - DOI - PMC - PubMed
    1. Hills TT, Kalff C, Wiener JM. Adaptive Lévy processes and area-restricted search in human foraging. PLoS One. 2013;8(4):e60488. doi: 10.1371/journal.pone.0060488 - DOI - PMC - PubMed
    1. Cain MS, Vul E, Clark K, Mitroff SR. A Bayesian optimal foraging model of human visual search. Psychological science. 2012;23(9):1047–1054. doi: 10.1177/0956797612440460 - DOI - PubMed

Publication types