. 2022 Jun 9;139(23):3387-3401.
doi: 10.1182/blood.2021013450.

Unique molecular and functional features of extramedullary hematopoietic stem and progenitor cell reservoirs in humans

Affiliations

Unique molecular and functional features of extramedullary hematopoietic stem and progenitor cell reservoirs in humans

Nicole Mende et al. Blood. .

Abstract

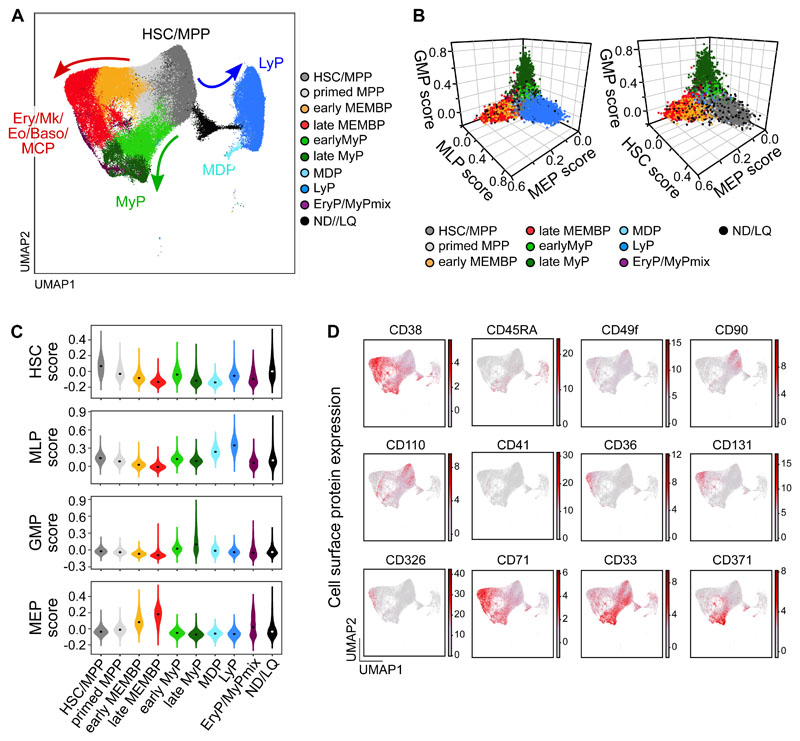
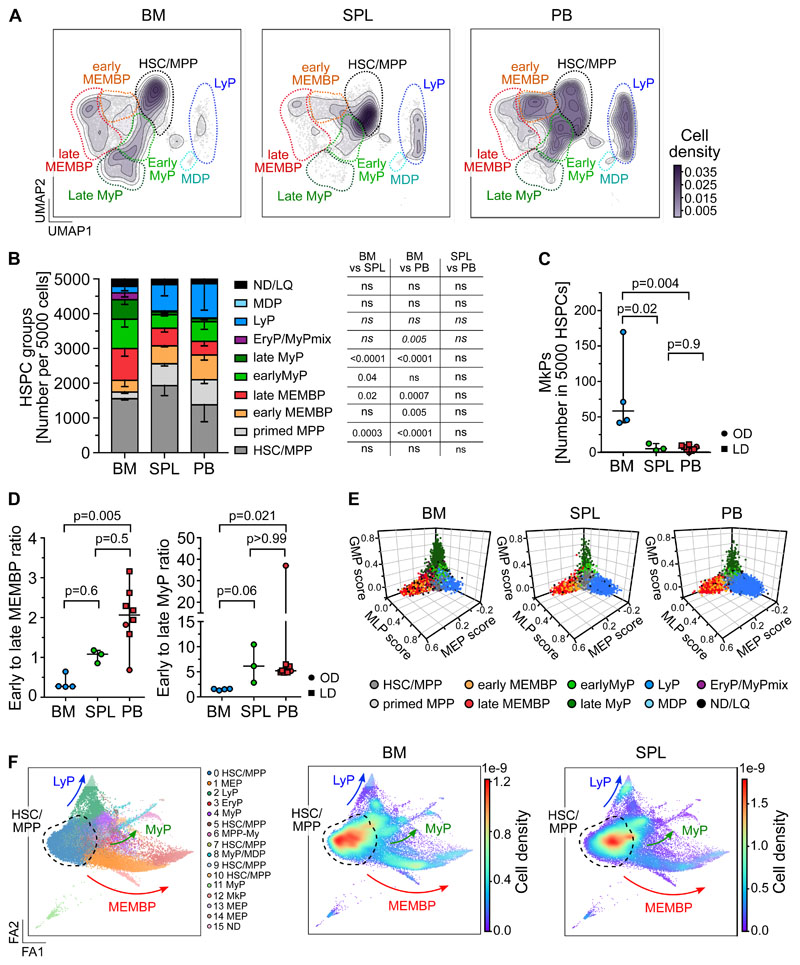
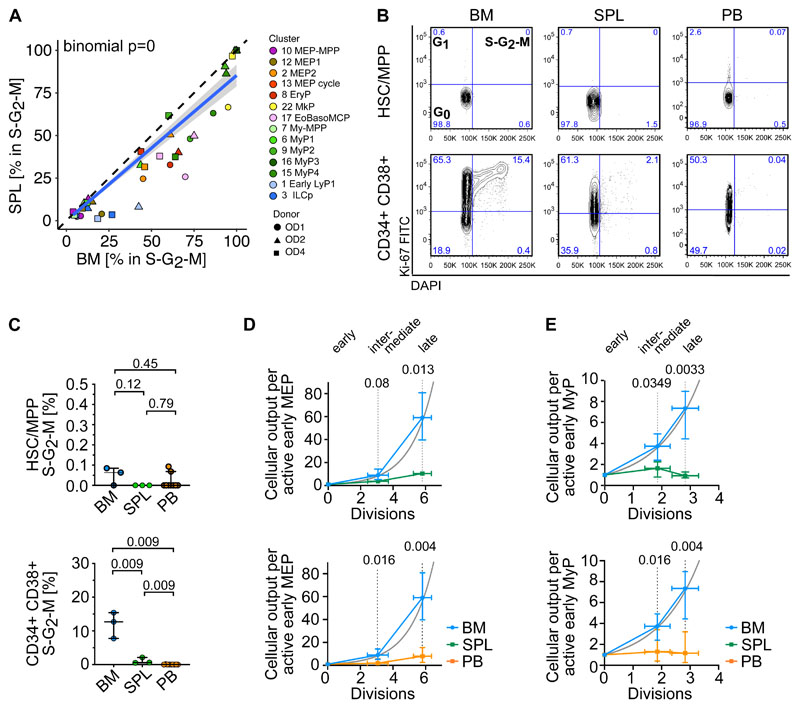
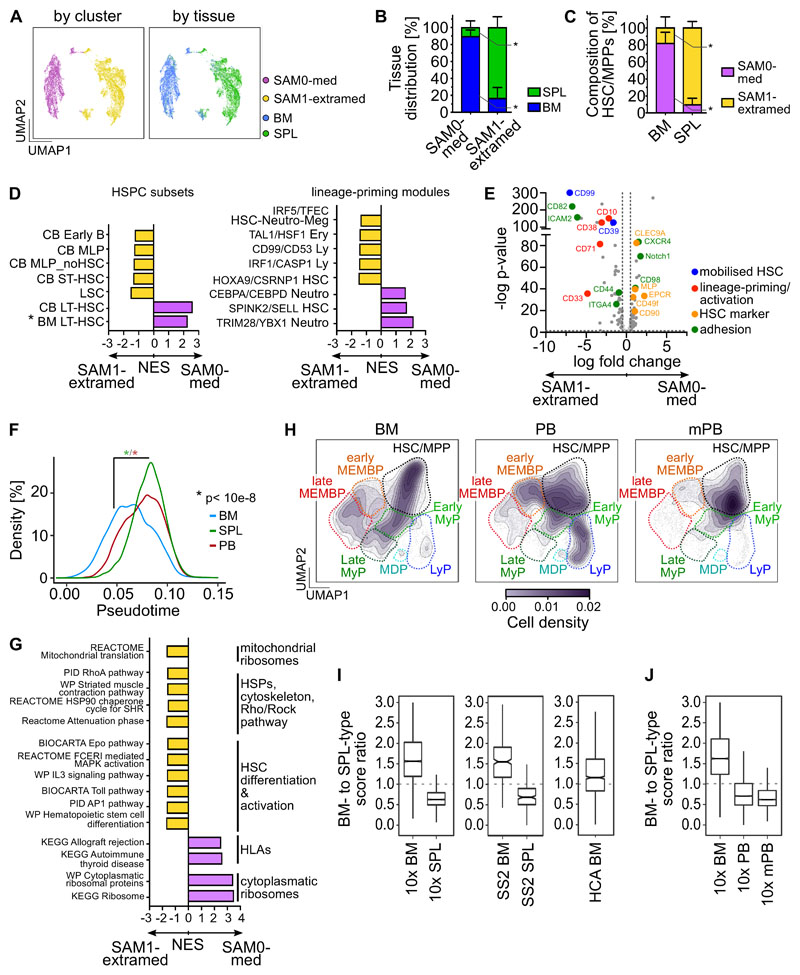
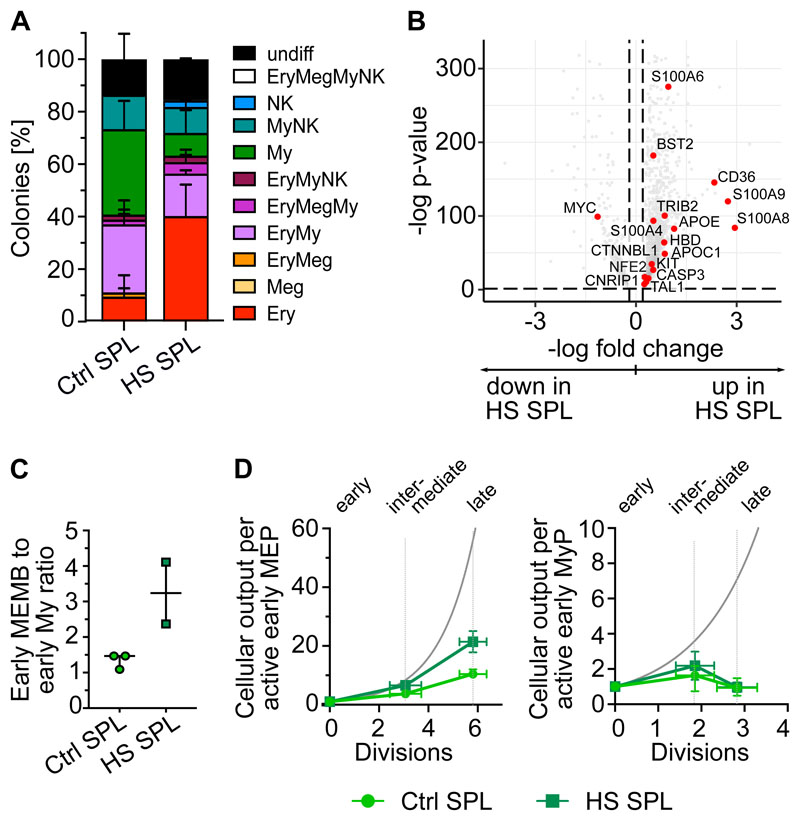
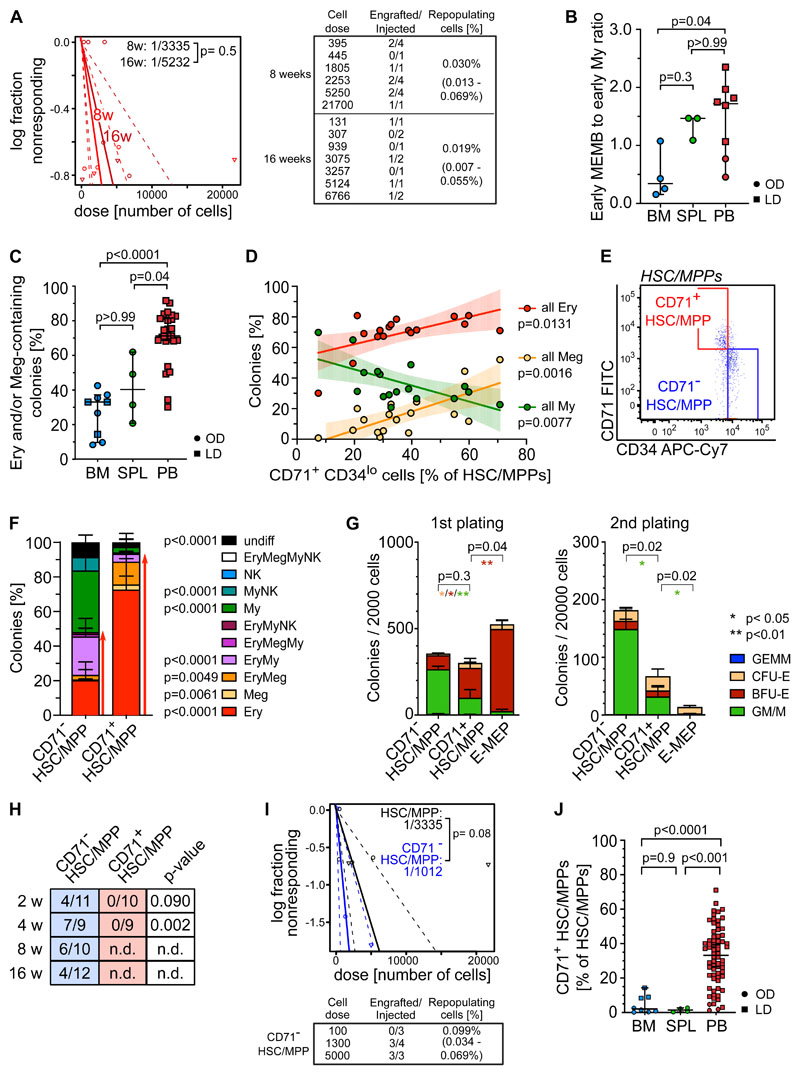
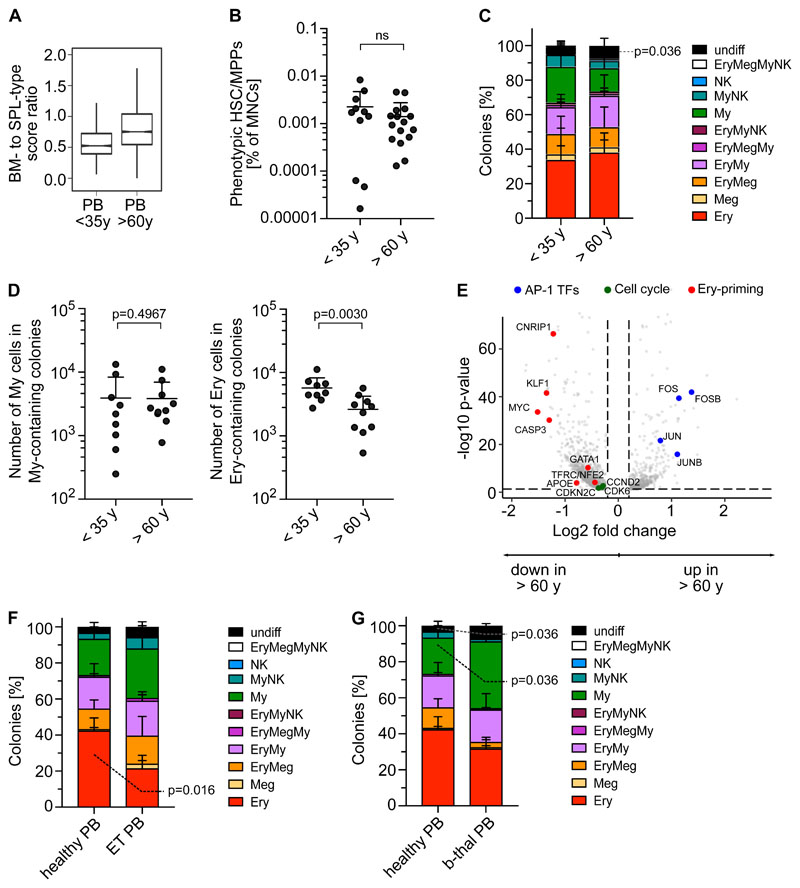
Rare hematopoietic stem and progenitor cell (HSPC) pools outside the bone marrow (BM) contribute to blood production in stress and disease but remain ill-defined. Although nonmobilized peripheral blood (PB) is routinely sampled for clinical management, the diagnosis and monitoring potential of PB HSPCs remain untapped, as no healthy PB HSPC baseline has been reported. Here we comprehensively delineate human extramedullary HSPC compartments comparing spleen, PB, and mobilized PB to BM using single-cell RNA-sequencing and/or functional assays. We uncovered HSPC features shared by extramedullary tissues and others unique to PB. First, in contrast to actively dividing BM HSPCs, we found no evidence of substantial ongoing hematopoiesis in extramedullary tissues at steady state but report increased splenic HSPC proliferative output during stress erythropoiesis. Second, extramedullary hematopoietic stem cells/multipotent progenitors (HSCs/MPPs) from spleen, PB, and mobilized PB share a common transcriptional signature and increased abundance of lineage-primed subsets compared with BM. Third, healthy PB HSPCs display a unique bias toward erythroid-megakaryocytic differentiation. At the HSC/MPP level, this is functionally imparted by a subset of phenotypic CD71+ HSCs/MPPs, exclusively producing erythrocytes and megakaryocytes, highly abundant in PB but rare in other adult tissues. Finally, the unique erythroid-megakaryocytic-skewing of PB is perturbed with age in essential thrombocythemia and β-thalassemia. Collectively, we identify extramedullary lineage-primed HSPC reservoirs that are nonproliferative in situ and report involvement of splenic HSPCs during demand-adapted hematopoiesis. Our data also establish aberrant composition and function of circulating HSPCs as potential clinical indicators of BM dysfunction.


Conflict of interest statement

Disclosure of Conflicts of Interests

No conflicts of interest to declare

Figures

Figure 1
Figure 1. Single cell transcriptomic landscape of human adult HSPCs across medullary and extramedullary hematopoietic tissues.
Analysis of 10x Genomics scRNA-seq and CITE-seq data from 117,200 CD19-CD34+ HSPCs isolated from BM, non-mobilized PB and spleen of adult donors. (A) UMAP of the multisite HSPC landscape after exclusion of mature cells (see methods). Clusters were annotated using known lineage and stem cell marker genes found amongst the most differentially expressed genes in each cluster (Table S2a). Clusters with similar cell identity are shown as HSPC groups using different cluster colors. Detailed cluster composition is shown in Supplemental Figure 1F and HSCP grouping is summarized in Table S2c. ND/LQ: cluster of lower quality which identity could not be defined using known marker genes. HSC/MPP: hematopoietic stem cell/multipotent progenitor; MEMBP: Megakaryocyte/erythroid/eosinophil/mast cell/basophil progenitor; MyP: myeloid progenitor; MDP: monocyte/dendritic cell progenitor; LyP: lymphoid progenitor. (B, C) 3D-plots (B) and violin plots (C) of lineage- and HSC-scores calculated for each cell using published gene sets enriched in prospectively isolated HSPC subsets (details see methods). (D) CITE-seq data from two BMs (OD3: 9,477 cells, OD4: 12,500 cells) and one spleen (OD4: 11,822 cells). UMAPs highlighting selected surface protein expression across the HSPC landscape.
Figure 2
Figure 2. Distinct HSPC composition in BM, spleen and PB.
(A-E) Analysis of 10x Genomics scRNA-seq data from 117,200 cells, combining all donors but comparing different tissues (BM: 34,967 cells; SPL: 22,068 cells; PB: 60,165 cells). (A) 2D kernel density of cells across the UMAP coordinates of each tissue, displayed as contours filled by a color gradient. (B) Bar graph of the relative composition of HSPC groups in BM, spleen and PB. Each group was defined as shown in Figure 1A. Mean ± SD is shown. (C) Relative number of MkPs (cluster 22) in each tissue. (D) The ratio of early to late progenitors of the MEMB (left) or My (right) branch is shown. Kruskal-Wallis; Dunn’s multiple comparison test. (E) 3D plots show lineage scores as in Figure 1B for each tissue. (F) Force Directed Graph computed using CITE-seq protein data of two BM (OD3: 9,477 cells; OD4: 12,500 cells) and one spleen (OD4: 11,822 cells). Left: Leiden clusters as annotated based on known surface marker expression (see Supplemental Figure 2D). Right: Density visualization of the distinct cell distributions for each tissue in different areas of the landscape. B-C) One-way ANOVA with post hoc Tukey test, except for LyP and EryP/MyPmix clusters (not normally distributed, italic text), for which a Kruskal-Wallis test with Dunn’s multiple comparison was used. ns; p>0.05. C-D) Median ± 95% confidence interval is shown. LD: living donor, OD: organ donor, SPL: spleen.
Figure 3
Figure 3. Low proliferation of progenitors in extramedullary tissues compared to BM.
(A,D,E) Analysis of 10x Genomics scRNA-seq data from 117,200 cells, combining all donors but comparing different tissues. (A) Percentage of cells in S-G2-M phase (assigned by cell cycle phase scoring as described by ) in matched BM and spleen (left) from the same donor for each indicated progenitor cluster. Two-sided exact binomial test. (B) Representative flow cytometry plots of BM (left), spleen (middle) and PB (right) CD19-CD34+CD38-CD45RA- HSC/MPPs (top row) or CD19-CD34+CD38+ progenitor cells (bottom row) in G0 (Ki-67-DAPI-), G1 (Ki-67+DAPI-) and S-G2-M (Ki-67+DAPI+) cell cycle phases. (C) Frequency of phenotypic HSC/MPPs (left) or CD19-CD34+CD38+ progenitor cells (right) from each tissue in S-G2-M phase (Ki-67+DAPI+) assessed by flow cytometry. Median ± 95% confidence interval is shown. A two-tailed unpaired t-test was used to compare BM and spleen (normal distribution) and two-tailed Mann-Whitney tests were used to compare BM/spleen with PB (not normally distributed). n=3 non-matched BM and spleen tissues, n=9 PBs measured over 8 experiments. (D-E) Estimated cellular output from early to late progenitors of the MEMB (D) and the My branch (E) branch calculated from the number of active cells assuming all divisions are symmetric divisions towards differentiation (details see methods). Grey line: theoretical exponential expansion. Vertical error bars indicate the range observed in the different tissues. Horizontal error bars indicate the standard deviation of the estimated number of divisions for each expansion stage. SPL: spleen.
Figure 4
Figure 4. Unique transcriptional and cell surface protein characteristics of extramedullary HSC/MPPs.
(A-E,G) Analysis of 10x Genomics scRNA-seq data from 16,651 transcriptionally defined HSC/MPPs (sum of clusters 0,4,5,11,21 from Figure 1A) combining matched BM and spleen from the same individuals (OD1: 3,812 cells, OD2: 3,460 cells, OD4: 9,379 cells). (A) UMAPs of HSC/MPPs clustered by SAM (k-means=2; top panels colored by SAM cluster, bottom panels by tissue). (B) Bar graphs of the proportions of BM and spleen-derived HSC/MPPs in the SAM0-med and SAM1-extramed clusters. (C) Proportions of SAM0-med and SAM1-extramed HSC/MPPs in the HSC/MPP space of each tissue. (D) Analysis of genes differentially expressed between the SAM0-med (n= 7,068 cells) and SAM1-extramed (n= 9,583 cells) clusters. Pre-ranked GSEA of population-specific signatures (left; CB LT-HSC and ST-HSC from , BM LT-HSC (unpublished), other from ) and lineage-priming modules (right; from ) comparing SAM0-med with SAM1-extramed HSC/MPPs. Selected lineage-priming modules are shown. All gene sets are listed in Table S4g. (E) Volcano plot of differentially expressed surface proteins (p-value <0.05; log FC >0.5) in SAM0-med and SAM1-extramed HSC/MPPs from CITE-seq data of OD4. (F) Pseudotime of all transcriptionally defined HSC/MPPs in each tissue. Kruskal-Wallis test with multiple comparison. (G) GSEA of C2 curated MSigDB pathways (FDR <0.05 by pre-ranked GSEA) on differentially expressed genes between SAM0-med (n= 7,068 cells) and SAM1-extramed (n= 9,583 cells) HSC/MPPs. Selected gene sets are shown. All gene sets are listed in Table S4h. (H) scRNA-seq data from four mobilized PB (mPB) CD19-CD34+ HSPCs (28,026 cells) were integrated with the same BMs and non-mobilized PBs as in Figure 2. The cell density across the UMAP coordinates of each tissue is displayed as contours filled by a color gradient. Different HSPC groups are indicated by dashed lines. (I,J) Gene signatures of medullary and extramedullary type HSC/MPPs were used to compute a BM- or SPL-type identity score for each HSC/MPP cell of the multi-tissue landscape. Box plots show the ratio between BM- and SPL-type scores for each sample (‘identity ratio’). Notches indicate the 95% confidence interval of the median (middle line). (I) The ’identity ratio’ was calculated for BM and spleen HSC/MPPs taken from our 10x multi-tissue landscape, and then validated using transcriptionally defined HSC/MPPs from the HCA BM dataset (HCA-BM) as well as Smart-seq2 data from single-cell sorted phenotypic HSC/MPPs (CD19-CD34+CD38-CD45RA-) from BM (SS2 BM) and spleen (SS2 SPL) of OD1 and OD2. (J) Boxplots show the ’identity ratio’ for BM (10x BM), non-mobilized PB (10x PB) and mobilized PB (mPB) calculated using only the data integration containing these tissues. (B-C) Mean ± SD is shown. Two-tailed paired t-test. * p=0.02. SPL: spleen.
Figure 5
Figure 5. Spleen HSPCs in the anemia erythroid response.
(A) Colonies derived from single phenotypic HSC/MPPs from control spleen (Ctrl, n=234 single cells from 3 donors) and spleens of hereditary spherocytosis (HS) patients (n=198 single cells from 2 donors) seeded into medium supporting My/Ly/Ery/Meg differentiation (see methods). Mean ± SD is shown. (B) CD19-CD34+ HSPCs (n=9,939 cells) from two HS patients were sequenced using the 10x Genomics scRNA-seq platform and were integrated with control spleen data (same as in Figure 2). UMAPs and cluster annotation of the HSPC landscape are shown in Supplemental Figure 6B-C. Volcano plot shows the differentially expressed genes (FDR<0.05, LFC>0.2) between transcriptionally defined HSC/MPPs from control and HS spleens. Genes associated with erythroid lineage commitment are shown in red. (C) Ratio of early MEMB to early My progenitors in control and HS spleens. Median ± 95% confidence interval is shown. (D) Normalized estimated cellular output from early to late progenitors of the MEMB (left) and the My branch (right) branch calculated as for Figure 3D-E (details see methods). Grey line: theoretical exponential expansion. Vertical error bars indicate the range observed in the different tissues. Horizontal error bars indicate the standard deviation of the estimated number of divisions for each expansion stage. Control spleens are same as in Figure 3D,E. SPL: spleen.
Figure 6
Figure 6. Multipotent repopulating HSC/MPPs and quiescent CD71+ HSC-like cells with restricted erythroid/megakaryocyte differentiation potential coexist in steady-state PB.
(A) Frequency of repopulating cells in PB HSC/MPPs calculated using Extreme Limiting Dilution Analysis (ELDA) statistics at 8 weeks (2 experiments, n=17) and 16 weeks (2 experiments, n=10) post-transplantation. Table indicates doses of cells injected and number of NSG mice with human cell engraftment in their BM (see methods). (B) Ratio of early MEMB (sum cluster 2,12) to early My (sum cluster 6,9) progenitors in all tissues. (C-D) Colonies derived from single phenotypic HSC/MPPs from BM (n=913 single cells from 7 samples), spleen (n=234 single cells from 3 samples) and PB (n=3,034 single cells; 27 independent PBs over 16 experiments) seeded into medium supporting My/Ly/Ery/Meg differentiation (see methods). (C) Frequency of colonies containing Ery and/or Meg cells for each tissue as assessed by flow cytometry. (D) Relationship between the percentage of all Ery-, Meg- and My-containing colonies and the proportion of CD71+CD34lo cells within the phenotypic PB HSC/MPP pool. Linear regression and 95% confidence interval are indicated by solid line and shaded area. n=17 PBs. (E) Representative pseudocolor plot for flow cytometry isolation of CD71- and CD71+ HSC/MPPs in PB gated on phenotypic HSC/MPPs (CD19-CD34+CD38-CD45RA- cells as defined in Supplemental Figure 1D). (F) Percentage of colonies generated by CD71- (n=872 single cells; 15 independent PBs) and CD71+ (n=1,109 single cells; 18 independent PBs) HSC/MPPs. p-values comparing CD71- and CD71+ HSC/MPP colony output are shown. Two-tailed Mann-Whitney test. (G) Serial replating of PB CD71- or CD71+ HSC/MPPs and CD71+ MEPs (E-MEPs) in methylcellulose medium. Colony numbers per indicated number of seeded cells after first (left) and secondary (right) plating are shown. n=4 PBs over 3 experiments. Paired two-tailed t-test. ** p<0.01; * p<0.05; ns = not significant, p>0.05. (H) Ratio of NSG mice engrafted to total mice tested at the indicated time points after transplantation of CD71- and CD71+ phenotypic PB HSC/MPPs. n.d.: not determined. p-values comparing engraftment of CD71- and CD71+ HSC/MPPs were determined by two-tailed Fisher-test and are shown below each time point. (I) Frequency of repopulating cells within all phenotypic PB HSC/MPPs (same as Figure 5A) and CD71- HSC/MPPs at 8 weeks after transplantation using ELDA statistics. (J) Percentage of CD71+ cells withing the phenotypic HSC/MPP pool of BM (n=8), spleen (n=4) and PB (n=65). One-way ANOVA; Tukey’s multiple comparison. B-C) Median ± 95% confidence interval is shown. Kruskal-Wallis; Dunn’s multiple comparison test. F,G,J) Mean ± SD is shown. LD: living donor, OD: organ donor, SPL: spleen.
Figure 7
Figure 7. PBs unique erythroid/megakaryocyte-biased differentiation output becomes imbalanced with age and disease.
(A) Ratio between BM- and SPL-type identity scores in PB HSC/MPPs by age group. Notches indicate the 95% confidence interval of the median (middle line). (B) Frequencies of phenotypic HSC/MPPs (CD19-CD34+CD38-CD45RA-) in PB mononuclear cells (MNCs) by age group (n=27, same data as in Supplemental Figure 1B). (C) Percentage of colonies generated by single cell sorted phenotypic HSC/MPPs from non-mobilized PB (same as in Figure 6C), grouped by age. <35 years; n=942 single cells; 9 independent PBs; >60 years; n=700 single cells; 8 independent PBs. (D) Median size of all myeloid colonies (left) and all erythroid colonies (right) generated from non-mobilized PB HSC/MPPs, grouped by age as in Figure 7C. (E) Volcano plot showing selected genes differentially expressed genes (FDR <0.05) in EryP (cluster 8) of PB donors <35 years and >60 years. (F) Percentage of colonies generated by single cell sorted phenotypic HSC/MPPs from non-mobilized PB of healthy individuals (n=445 cells, 5 healthy controls) and ET patients (n=349 cells, 5 individuals) over 5 experiments. (F) Percentage of colonies generated by single cell sorted phenotypic HSC/MPPs from non-mobilized PB of healthy individuals (same as in Figure 7F) and b-thalassemia patients (n=271 cells, 3 individuals) over 3 experiments. (B,C,D,F,G) Mean± SD is shown. Two-tailed Mann-Whitney test.

Comment in

References

    1. Nombela-Arrieta C, Manz MG. Quantification and three-dimensional microanatomical organization of the bone marrow. Blood Adv. 2017;1(6):407–416. - PMC - PubMed
    1. Soderdahl G, Tammik C, Remberger M, Ringden O. Cadaveric bone marrow and spleen cells for transplantation. Bone Marrow Transplantation. 1998;21:79–84. - PubMed
    1. Lefrançais E, Ortiz-Muñoz G, Caudrillier A, et al. The lung is a site of platelet biogenesis and a reservoir for haematopoietic progenitors. Nature. 2017;544(7648):105–109. - PMC - PubMed
    1. Massberg S, Schaerli P, Knezevic-Maramica I, et al. Immunosurveillance by Hematopoietic Progenitor Cells Trafficking through Blood, Lymph, and Peripheral Tissues. Cell. 2007;131(5):994–1008. - PMC - PubMed
    1. Wright DE, Wagers AJ, Gulati AP, Johnson FL, Weissman IL. Physiological Migration of Hematopoietic Stem and Progenitor Cells. Science. 2001;294(5548):1933–1936. - PubMed

Publication types