. 2022 Feb 22;13(1):e0364021.
doi: 10.1128/mbio.03640-21. Epub 2022 Jan 25.

BrnQ-Type Branched-Chain Amino Acid Transporters Influence Bacillus anthracis Growth and Virulence

Affiliations

BrnQ-Type Branched-Chain Amino Acid Transporters Influence Bacillus anthracis Growth and Virulence

Soumita Dutta et al. mBio. .

Abstract

Bacillus anthracis, the anthrax agent, exhibits robust proliferation in diverse niches of mammalian hosts. The metabolic attributes of B. anthracis that permit rapid growth in multiple mammalian tissues have not been established. We posit that branched-chain amino acid (BCAA) (isoleucine, leucine, and valine) metabolism is key to B. anthracis pathogenesis. Increasing evidence indicates the relationships between B. anthracis virulence and the expression of BCAA-related genes. The expression of some BCAA-related genes is altered during culture in bovine blood in vitro, and the bacterium exhibits valine auxotrophy in a blood serum mimic medium. Transcriptome analyses have revealed that the virulence regulator AtxA, which positively affects the expression of the anthrax toxin and capsule genes, negatively regulates genes predicted to be associated with BCAA biosynthesis and transport. Here, we show that B. anthracis growth in defined medium is severely restricted in the absence of exogenous BCAAs, indicating that BCAA transport is required for optimal growth in vitro. We demonstrate functional redundancy among multiple BrnQ-type BCAA transporters. Three transporters are associated with isoleucine and valine transport, and the deletion of one, BrnQ3, attenuates virulence in a murine model for anthrax. Interestingly, an ilvD-null mutant lacking dihydroxy acid dehydratase, an enzyme essential for BCAA synthesis, exhibits unperturbed growth when cultured in medium containing BCAAs but is highly attenuated in the murine model. Finally, our data show that BCAAs enhance AtxA activity in a dose-dependent manner, suggesting a model in which BCAAs serve as a signal for virulence gene expression. IMPORTANCE Infection with B. anthracis can result in systemic disease with large numbers of the bacterium in multiple tissues. We found that branched-chain amino acid (BCAA) synthesis is insufficient for the robust growth of B. anthracis; access to BCAAs is necessary for the proliferation of the pathogen during culture and during infection in a murine model for anthrax. B. anthracis produces an unusually large repertoire of BCAA-related transporters. We identified three isoleucine/valine transporters with partial functional redundancy during culture. The deletion of one of these transporters, BrnQ3, resulted in attenuated virulence. Interestingly, a BCAA biosynthesis mutant grew well in medium containing BCAAs but, like BrnQ3, was attenuated for virulence. These results suggest that BCAAs are limiting in multiple niches during infection and further our understanding of the nutritional requirements of this important pathogen.

Keywords: Bacillus; amino acid transport; anthracis; anthrax; branched-chain amino acid; nutritional immunity; virulence regulation.


Conflict of interest statement

The authors declare no conflict of interest.

We declare no competing interests.

Figures

FIG 1
FIG 1
Requirement of BCAAs for B. anthracis ANR-1 growth under toxin-inducing conditions. (A) Growth in R medium (1.75 mM isoleucine, 1.5 mM leucine, and 1.35 mM valine) and R medium missing one or more BCAAs, as indicated. (B) Growth in R medium with altered concentrations of BCAAs. Each of the three BCAAs was present at the concentrations indicated. Data are the means from three biological replicates, with error bars representing standard deviations. Data were compared with growth in R medium and analyzed using one-way analysis of variance (ANOVA) followed by Dunnett’s multiple-comparison analysis. Asterisks indicate P values (*, P < 0.05; ****, P < 0.0001).
FIG 2
FIG 2
Organization and expression of ilv loci in B. anthracis. (A) Schematic representation of the ilv loci. Two operons designated operon ilv1 and operon ilv2 are shown. Genes are indicated as open arrows with the corresponding annotations (GenBank accession number AE017334). Gene sizes (base pairs) are shown in parentheses. truncated* is the truncation of a gene predicted to encode the small subunit of acetolactate synthase III. The sizes of intergenic spaces (base pairs) are indicated. Predicted transcription start and termination sites are denoted by bent arrows and lollipops, respectively. Thin horizontal arrows represent primer pairs for PCR. Small thin arrows above and below the genes indicate the approximate positions of primers used for RT-PCR. Horizontal lines below the operons correspond to the RT-PCR products shown in panel B. (B) Cotranscription of ilv loci. Ethidium bromide-stained agarose gels show the RT-PCR products obtained using the primers shown in panel A. Lane designations correspond to the anticipated products shown in panel A. The RT control reaction mixture contained RNA as a template. Primers directly upstream (U) and downstream (D) of the ilv1 operon were used as negative controls for cotranscription with genes flanking the ilv1 operon in the same DNA strand.
FIG 3
FIG 3
Growth of single brnQ transporter-null mutants in R medium. Each data point represents the average from three independent experiments ± the standard deviation. Data were analyzed using one-way ANOVA followed by Dunnett’s multiple-comparison test and compared with the data for the parent strain.
FIG 4
FIG 4
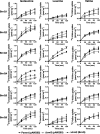
BCAA uptake by single brnQ-null mutants. The uptake of 14C-labeled isoleucine, 14C-labeled leucine, and 14C-labeled valine was assessed for the parent strain containing empty vector pAW285, an individual brnQ mutant with pAW285, and an individual brnQ mutant complemented with the corresponding gene. Data represent the means from three biological replicates ± standard deviations. Data were analyzed using two-way ANOVA with repeated measures followed by Bonferroni’s multiple-comparison analysis. Comparisons of the parent and single-deletion mutants are shown with asterisks representing P values (*, P < 0.05; **, P < 0.01; ***, P < 0.001).
FIG 5
FIG 5
Growth and BCAA uptake by the ΔilvD and ΔilvDΔbrnQ2–6 mutants. (A) Growth of the ΔilvD and ΔilvDΔbrnQ2–6 mutants in R medium. Data are presented as the means from three independent experiments. Growth was compared to the respective growth of the parent. Error bars represent standard deviations. Data were analyzed using one-way ANOVA followed by Dunnett’s multiple-comparison analysis. Asterisks indicate P values (****, P < 0.0001). (B to D) BCAA uptake. The uptake of 14C-labeled isoleucine (B), 14C-labeled leucine (C), and 14C-labeled valine (D) was assessed for the parent, ΔilvD, and ΔilvDΔbrnQ2–6 strains. The uptake of isoleucine and valine by the ΔilvDΔbrnQ2–6 mutant is shown in the insets of panels B and D, respectively. Data are the means from three biological replicates ± standard deviations. Data were analyzed using two-way ANOVA with repeated measures followed by Bonferroni’s multiple-comparison analysis. Comparisons of the parent with the ΔilvD mutant and of the parent with the ΔilvDΔbrnQ2–6 mutant were assessed and are shown with asterisks indicating P values (*, P < 0.05; **, P < 0.01).
FIG 6
FIG 6
Isoleucine and valine uptake associated with the expression of specific BrnQs. The uptake of 14C-labeled isoleucine and valine was assessed for the ΔilvD mutant containing the empty pAW285 vector, the ΔilvDΔbrnQ2–6 mutant containing the empty pAW285 vector, and the ΔilvDΔbrnQ2–6 strain complemented with individual brnQ genes. Values represent the means from three independent experiments ± standard deviations. Data were analyzed using two-way ANOVA with repeated measures followed by Bonferroni’s multiple-comparison analysis. Each complemented BrnQ+ mutant was compared to the ΔilvDΔbrnQ2–6 mutant and is shown with asterisks indicating P values (*, P < 0.05; **, P < 0.01; ***, P < 0.001; ****, P < 0.0001).
FIG 7
FIG 7
Kinetics of isoleucine and valine uptake associated with BrnQ3, BrnQ4, and BrnQ5. Isoleucine (A) and valine (B) uptake kinetics were assessed for the ΔilvDΔbrnQ2–6 strain with empty vector pAW285, the ΔilvDΔbrnQ2–6 strain with BrnQ3, the ΔilvDΔbrnQ2–6 strain with BrnQ4, and the ΔilvDΔbrnQ2–6 strain with BrnQ5. The data shown represent the means from three independent experiments. Error bars represent standard deviations.
FIG 8
FIG 8
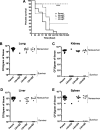
Virulence of BCAA transporter mutants. Seven- to eight-week-old female A/J mice were infected with ∼105 CFU of the ANR-1 parent strain (n = 20), the ΔbrnQ3 mutant (n = 10), the ΔbrnQ4 mutant (n = 10), or the ΔbrnQ5 mutant (n = 10) via tail vein injection. Mice were monitored for 11 consecutive days. Organs were collected from dead and surviving mice, homogenized, and plated for the determination of CFU. (A) Kaplan-Meier survival curves for the parent, ΔbrnQ3 mutant, ΔbrnQ4 mutant, and ΔbrnQ5 mutant strains. Statistical significance was analyzed using the log rank (Mantel-Cox) test and compared with the parent. The P value is indicated by asterisks (****, P < 0.0001). (B to E) CFU in lungs (B), kidneys (C), livers (D), and spleens (E) from nonsurvivors and survivors were determined for the parent strain (circles), the ΔbrnQ3 mutant (squares), the ΔbrnQ4 mutant (triangles), and the ΔbrnQ5 mutant (inverted triangles). No detectable CFU were found in the organs of survivors. Individual data points are shown. Data for each mutant were compared to data for the parent. Mann-Whitney unpaired Student’s t test was used to determine significance.
FIG 9
FIG 9
Virulence of a BCAA biosynthesis mutant. Mice were infected as described in the legend of Fig. 8 with the parent strain (n = 15) and the ilvD-null mutant (n = 10). (A) Kaplan-Meier survival curves for the parent strain and the ΔilvD mutant. Statistical significance was analyzed by the log rank (Mantel-Cox) test, and the P value is denoted by asterisks (****, P < 0.0001). (B to E) CFU values in collected lungs (B), kidneys (C), livers (D), and spleens (E) of nonsurvivors and survivors for the parent (closed circles) and ilvD-null mutant (open circles) strains. The significance of the differences was analyzed by Mann-Whitney unpaired Student’s t test.
FIG 10
FIG 10
Effect of BCAAs on atxA promoter activity, AtxA function, and AtxA protein levels. (A) atxA promoter activity. The atxA promoter activity of a reporter strain carrying a PatxA-lacZ transcriptional fusion was measured using a β-galactosidase assay following growth with various BCAA concentrations. (B) AtxA protein activity in vivo. An atxA-null strain (UT376) carrying Plef-lacZ (a reporter for AtxA activity) and containing an IPTG-inducible His-tagged atxA allele was induced during growth in R medium with various BCAA concentrations. β-Galactosidase activity (top) and AtxA protein levels (bottom) were measured. Steady-state levels of AtxA and the RNA polymerase β-subunit were detected in cell lysates via immunoblotting using anti-His antibody and anti-RNA Pol β antibody, respectively. The experiment was performed three times, and a representative image is shown. (C to E) Effects of isoleucine (C), leucine (D), and valine (E) on AtxA activity. β-Galactosidase assays were performed as described above for panel B. The concentration of one BCAA (as indicated) was altered while keeping the concentrations of the other BCAAs constant at 0.25 mM to support optimal growth. Each bar represents the mean from three biological replicates. Error bars represent standard deviations. One-way ANOVA followed by Tukey’s multiple-comparison test was performed to analyze the data. Asterisks indicate P values (*, P < 0.05; ***, P < 0.001; ****, P < 0.0001).

References

    1. Marraffini LA, Schneewind O. 2006. Targeting proteins to the cell wall of sporulating Bacillus anthracis. Mol Microbiol 62:1402–1417. doi:10.1111/j.1365-2958.2006.05469.x. - DOI - PubMed
    1. Moayeri M, Leppla SH, Vrentas C, Pomerantsev AP, Liu S. 2015. Anthrax pathogenesis. Annu Rev Microbiol 69:185–208. doi:10.1146/annurev-micro-091014-104523. - DOI - PubMed
    1. Guichard A, Nizet V, Bier E. 2012. New insights into the biological effects of anthrax toxins: linking cellular to organismal responses. Microbes Infect 14:97–118. doi:10.1016/j.micinf.2011.08.016. - DOI - PMC - PubMed
    1. Corsi ID, Dutta S, van Hoof A, Koehler TM. 2021. AtxA-controlled small RNAs of Bacillus anthracis virulence plasmid pXO1 regulate gene expression in trans. Front Microbiol 11:610036. doi:10.3389/fmicb.2020.610036. - DOI - PMC - PubMed
    1. Bier N, Hammerstrom TG, Koehler TM. 2020. Influence of the phosphoenolpyruvate:carbohydrate phosphotransferase system on toxin gene expression and virulence in Bacillus anthracis. Mol Microbiol 113:237–252. doi:10.1111/mmi.14413. - DOI - PMC - PubMed

Publication types

LinkOut - more resources