. 2022 Jan 24;23(1):50.
doi: 10.1186/s12859-022-04568-3.

Iam hiQ-a novel pair of accuracy indices for imputed genotypes

Collaborators, Affiliations

Iam hiQ-a novel pair of accuracy indices for imputed genotypes

Albert Rosenberger et al. BMC Bioinformatics. .

Abstract

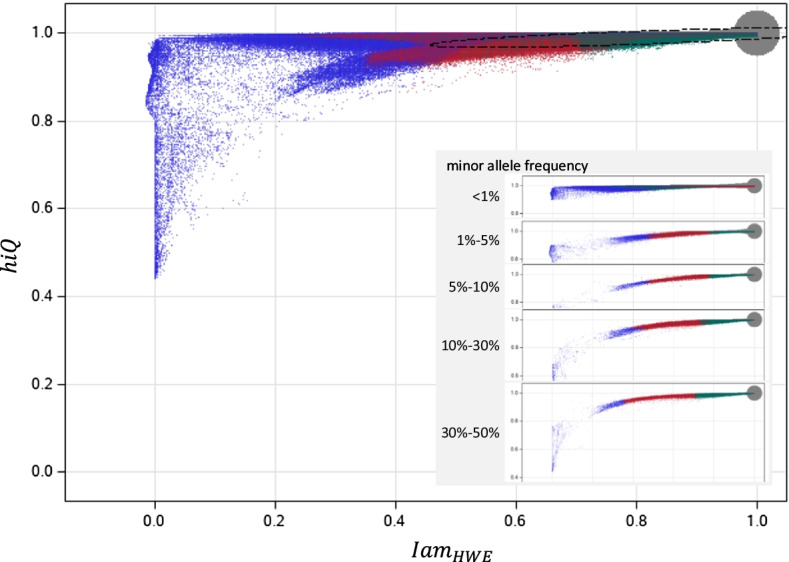
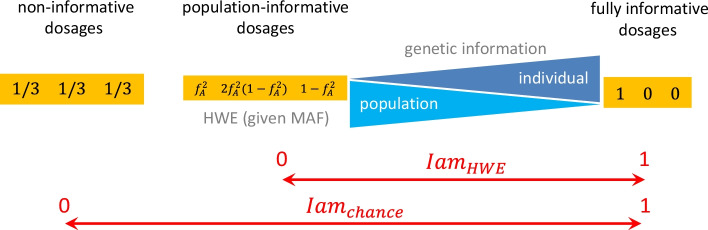
Background: Imputation of untyped markers is a standard tool in genome-wide association studies to close the gap between directly genotyped and other known DNA variants. However, high accuracy with which genotypes are imputed is fundamental. Several accuracy measures have been proposed and some are implemented in imputation software, unfortunately diversely across platforms. In the present paper, we introduce Iam hiQ, an independent pair of accuracy measures that can be applied to dosage files, the output of all imputation software. Iam (imputation accuracy measure) quantifies the average amount of individual-specific versus population-specific genotype information in a linear manner. hiQ (heterogeneity in quantities of dosages) addresses the inter-individual heterogeneity between dosages of a marker across the sample at hand.

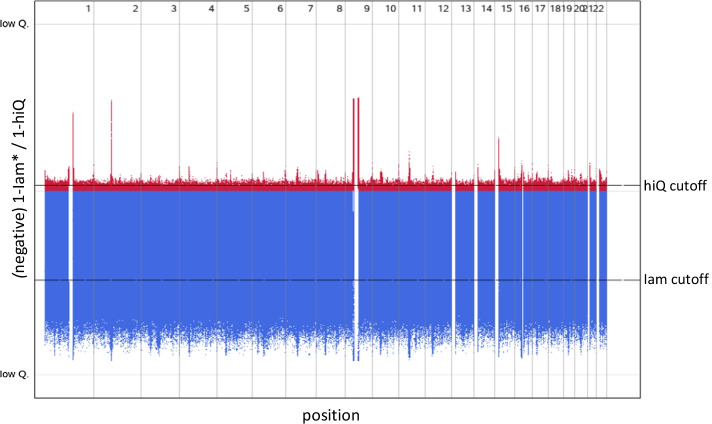
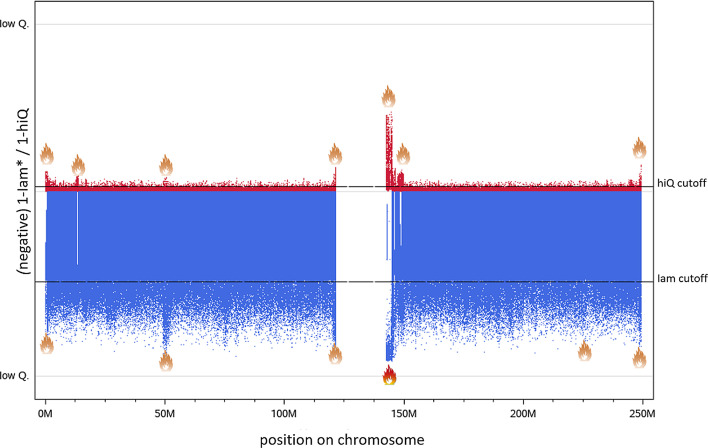
Results: Applying both measures to a large case-control sample of the International Lung Cancer Consortium (ILCCO), comprising 27,065 individuals, we found meaningful thresholds for Iam and hiQ suitable to classify markers of poor accuracy. We demonstrate how Manhattan-like plots and moving averages of Iam and hiQ can be useful to identify regions enriched with less accurate imputed markers, whereas these regions would by missed when applying the accuracy measure info (implemented in IMPUTE2).

Conclusion: We recommend using Iam hiQ additional to other accuracy scores for variant filtering before stepping into the analysis of imputed GWAS data.

Keywords: Accuracy measures; GWAS; Genotype imputation; High-throughput genotyping.


Conflict of interest statement

The authors declare that they have no competing interests.

Figures

Fig. 1
Fig. 1
Iam by hiQ. Main panel: all markers by Iam vs. hiQ; blue dots: variants with info < 0.5; red dots: variants with 0.5 ≤ info < 0.8; 8; green dots: variants with info ≥ 0.8; dotted line: robust 99.9999999% bivariate normal random interval (assuming a two-dimensional normal distribution). The oversized grey bubble in the top right corner represents the vast majority of almost fully-informative markers with Iam ≥ 0.99 and hiQ ≥ 0.99; inserted panel: like main panel, but marker are divided according to the minor allele frequency
Fig. 2
Fig. 2
Manhattan-like-plot: Iam hiQ. Upper panel: hiQ (low Q.: hiQ = 0; high Q.: hiQ = 1; Thresholds hiQ (cutoff = 0.97); lower panel: IamHWE (low Q.: IamHWE = 0; high Q.: IamHWE = 1; Thresholds Iam cutoff = 0.47): Thresholds were defined according a robust 99.9999999% bivariate normal random interval (assuming a two-dimensional normal distribution)
Fig. 3
Fig. 3
Manhattan-like-plot: Iam hiQ: chromosome 1. Upper panel: hiQ (low Q.: hiQ = 0; high Q.: hiQ = 1; Thresholds hiQ (cutoff = 0.97); lower panel: IamHWE (low Q.: IamHWE = 0; high Q.: IamHWE = 1; Thresholds Iam cutoff = 0.47): Thresholds were defined according a robust 99.9999999% bivariate normal random interval (assuming a two-dimensional normal distribution); red flames indicate “very hot” regions; orange flames indicate “hot” regions
Fig. 4
Fig. 4
From dosages to Iam-indices. MAF/fA minor allele frequency; HWE Hardy–Weinberg equilibrium; Iam imputation accuracy measure

References

    1. NCBI Variation Summary. https://www.ncbi.nlm.nih.gov/dbvar/content/org_summary/
    1. Lindgren D, Hoglund M, Vallon-Christersson J. Genotyping techniques to address diversity in tumors. Adv Cancer Res. 2011;112:151–182. doi: 10.1016/B978-0-12-387688-1.00006-5. - DOI - PubMed
    1. Hickey JM, Cleveland MA, Maltecca C, Gorjanc G, Gredler B, Kranis A. Genotype imputation to increase sample size in pedigreed populations. Methods Mol Biol. 2013;1019:395–410. doi: 10.1007/978-1-62703-447-0_17. - DOI - PubMed
    1. Das S, Abecasis GR, Browning BL. Genotype imputation from large reference panels. Annu Rev Genomics Hum Genet. 2018;19:73–96. doi: 10.1146/annurev-genom-083117-021602. - DOI - PubMed
    1. Marchini J, Howie B. Genotype imputation for genome-wide association studies. Nat Rev Genet. 2010;11(7):499–511. doi: 10.1038/nrg2796. - DOI - PubMed