. 2022 Jan 24;10(1):12.
doi: 10.1186/s40168-021-01203-w.

Elevated atmospheric CO2 alters the microbial community composition and metabolic potential to mineralize organic phosphorus in the rhizosphere of wheat

Affiliations

Elevated atmospheric CO2 alters the microbial community composition and metabolic potential to mineralize organic phosphorus in the rhizosphere of wheat

Jian Jin et al. Microbiome. .

Abstract

Background: Understanding how elevated atmospheric CO2 (eCO2) impacts on phosphorus (P) transformation in plant rhizosphere is critical for maintaining ecological sustainability in response to climate change, especially in agricultural systems where soil P availability is low.

Methods: This study used rhizoboxes to physically separate rhizosphere regions (plant root-soil interface) into 1.5-mm segments. Wheat plants were grown in rhizoboxes under eCO2 (800 ppm) and ambient CO2 (400 ppm) in two farming soils, Chromosol and Vertosol, supplemented with phytate (organic P). Photosynthetic carbon flow in the plant-soil continuum was traced with 13CO2 labeling. Amplicon sequencing was performed on the rhizosphere-associated microbial community in the root-growth zone, and 1.5 mm and 3 mm away from the root.

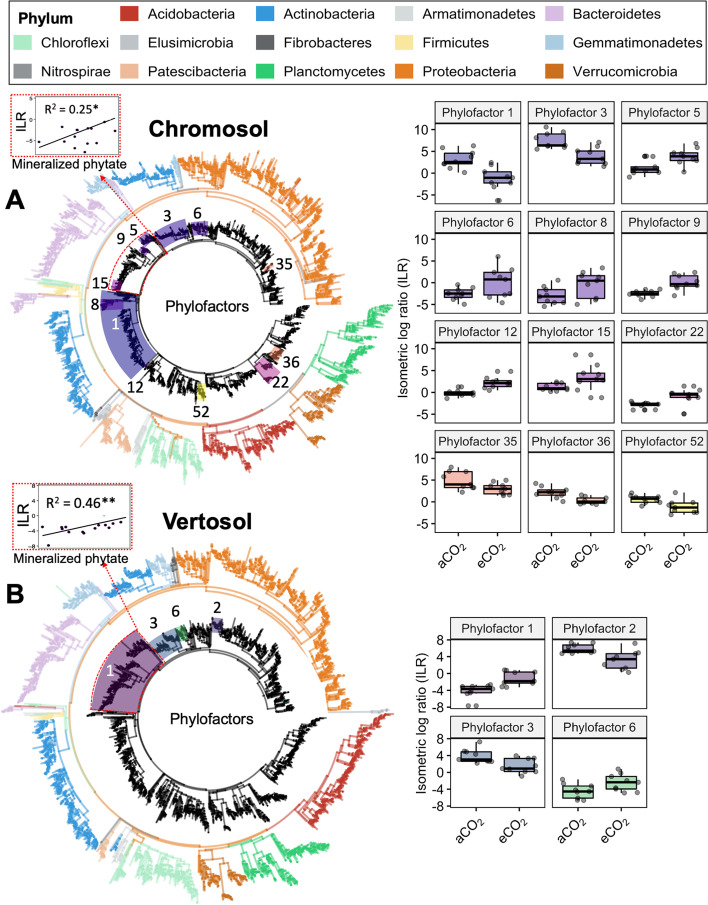
Results: Elevated CO2 accelerated the mineralization of phytate in the rhizosphere zones, which corresponded with increases in plant-derived 13C enrichment and the relative abundances of discreet phylogenetic clades containing Bacteroidetes and Gemmatimonadetes in the bacterial community, and Funneliformis affiliated to arbuscular mycorrhizas in the fungal community. Although the amplicon sequence variants (ASVs) associated the stimulation of phytate mineralization under eCO2 differed between the two soils, these ASVs belonged to the same phyla associated with phytase and phosphatase production. The symbiotic mycorrhizas in the rhizosphere of wheat under eCO2 benefited from increased plant C supply and increased P access from soil. Further supportive evidence was the eCO2-induced increase in the genetic pool expressing the pentose phosphate pathway, which is the central pathway for biosynthesis of RNA/DNA precursors.

Conclusions: The results suggested that an increased belowground carbon flow under eCO2 stimulated bacterial growth, changing community composition in favor of phylotypes capable of degrading aromatic P compounds. It is proposed that energy investments by bacteria into anabolic processes increase under eCO2 to level microbial P-use efficiencies and that synergies with symbiotic mycorrhizas further enhance the competition for and mineralization of organic P. Video Abstract.

Keywords: Climate change; Metabolic pathway; Microbial phosphorus; Microbial phylotypes; Phytate mineralization; Rhizobox.


Conflict of interest statement

The authors declare that they have no competing interests.

Figures

Fig. 1
Fig. 1
The mineralized phytate (A) and Olsen P (B) in the rhizosphere compartments: 0, 1.5, and 3 mm away from the root growth zone of wheat grown for 10 weeks in Chromosol and Vertosol under elevated CO2 (eCO2, 800 ppm) and ambient CO2 (aCO2, 400 ppm). Error bars are standard error (n=6). The dotted lines represent the corresponding value in the bulk soil. The statistical significance for the main effects of CO2 and rhizosphere (Rhizo) and their interaction are presented
Fig. 2
Fig. 2
The microbial biomass C (A), microbial P (B), soil respiration rate (C), microbial-C-to-P ratio (D), and respiration rate per unit microbial P (E) in the rhizosphere compartments: 0, 1.5, and 3 mm away from the root growth zone of wheat grown in Chromosol and Vertosol for 10 weeks under elevated CO2 (eCO2, 800 ppm) and ambient CO2 (aCO2, 400 ppm). Error bars are standard error (SE, n=6). The dotted lines represent the corresponding values in the bulk soil. The statistical significance for the main effects of CO2 and rhizosphere (Rhizo) and their interaction are presented
Fig. 3
Fig. 3
The relationships between mineralized phytate and Olsen P (A), microbial-C-to-P ratio (B), and microbial respiration per unit microbial P (C) in the rhizosphere of wheat plants grown for 10 weeks in Chromosol and Vertosol under elevated CO2 (eCO2, 800 ppm) and ambient CO2 (aCO2, 400 ppm). *, **, and *** indicate significance at p < 0.05, p < 0.01, and p < 0.001, respectively
Fig. 4
Fig. 4
The observed bacterial and fungal species richness, Shannon and Pielou evenness indices across rhizosphere compartments of 0, 1.5, and 3 mm away from the root growth zone. Wheat plants were grown in Chromosol and Vertosol for 10 weeks under elevated CO2 (eCO2, 800 ppm) or ambient CO2 (aCO2, 400 ppm). The diversity indices were calculated from rarefied abundance of filtered amplicon sequence variants (ASVs). Bars show the maximum (top edge) and minimum (lower edge) percentiles, and boxes the 25% and 75% percentiles. The median (50%) percentile is represented by the horizontal line within the box. ns, *, **, and *** indicate significance of two-sample Wilcoxon Mann-Whitney tests at p > 0.05, p < 0.05, p < 0.01 and p < 0.001, respectively
Fig. 5
Fig. 5
Non-metric multidimensional scaling (NMDS) of soil bacterial (A and B) and fungal (C and D) community composition (Bray-Curtis dissimilarities) in wheat rhizosphere compartments of 0, 1.5, and 3 mm away from the root growth zone and the bulk soil. Wheat plants were grown in Chromosol and Vertosol for 10 weeks under elevated CO2 (eCO2, 800 ppm) and ambient CO2 (aCO2, 400 ppm). Ellipses represent 95% confidence contours of samples grouped by ambient and elevated CO2. PERMANOVA results are presented based on Bray-Curtis dissimilarities for the main effects of rhizosphere and CO2 and their interaction on the soil community composition
Fig. 6
Fig. 6
Effect of elevated CO2 on bacterial phylogenetic groups (phylofactors) based on modeling the isometric log ratios (ILR) of aggregated abundances as response and CO2 treatments (ambient or elevated) as explanatory variables (Model 1) using the package Phylofactor. Samples of all three rhizosphere compartments in Chromosol (A) and Vertosol (B) were combined (n = 18; Chromosol, n = 18; Vertosol). Edge colors in phylogenetic trees indicate their phylum affiliation (left tree). Highlighted groups (right tree) represent selected phylofactors with abundances that were associated with CO2. Boxplots (right) with ILRs of these phylofactors are presented. Taxa encased in dashed red rectangles highlight taxa which were associated with increased phytate mineralization according to a secondary phylofactor model (Model 2)
Fig. 7
Fig. 7
Effect of elevated CO2 on the abundance (centered-log ratios) of fungal genera in the rhizosphere. Wheat plants were grown in Chromosol (A) and Vertosol (B) for 10 weeks under elevated CO2 (800 ppm) and ambient CO2 (400 ppm). Genera responding significantly (p < 0.05, Holm corrected) to elevated CO2 with a log-fold change > 0.5 or < −0.5 are presented. Bars represent standard errors (n=9)
Fig. 8
Fig. 8
Heatmaps of relative abundances of microbial metabolic pathways (MetaCyc database) with soil variables of mineralized phytate, microbial biomass C, and available N across the rhizosphere compartments of wheat grown in Chromosol and Vertosol for 10 weeks under elevated CO2 (eCO2, 800 ppm) in comparison to ambient CO2 (aCO2, 400 ppm). The color indicates the strength of negative (blue to purple) or positive (orange to red) correlations of explanatory variables (pathway potentials) and response variables (soil variables) for the first two components of partial least squares regression. Dendrograms indicate distances of hierarchical clustering
Fig. 9
Fig. 9
Diagram of microbial ability to access phytate in the rhizosphere of wheat grown under elevated CO2. The arrows (↑) and (↓) indicate increase and decrease, respectively. The red and blue arrows represent C flow and P dynamics, respectively. The dot arrow indicates unknown process of P transformation

References

    1. Vitousek PM, Porder S, Houlton BZ, Chadwick OA. Terrestrial phosphorus limitation: mechanisms, implications, and nitrogen–phosphorus interactions. Ecol Appl. 2010;20:5–15. - PubMed
    1. Gong H, Li Y, Yu T, Zhang S, Gao J, Zhang S, et al. Soil and climate effects on leaf nitrogen and phosphorus stoichiometry along elevational gradients. Glob Ecol Conserv. 2020;23:e01138.
    1. Rodriguez H, Fraga R. Phosphate solubilizing bacteria and their role in plant growth promotion. Biotechnol Adv. 1999;17:319–339. - PubMed
    1. Richardson AE, Simpson RJ. Soil microorganisms mediating phosphorus availability update on microbial phosphorus. Plant Physiol. 2011;156:989–996. - PMC - PubMed
    1. Bergkemper F, Schöler A, Engel M, Lang F, Krüger J, Schloter M, et al. Phosphorus depletion in forest soils shapes bacterial communities towards phosphorus recycling systems. Environ Microbiol. 2016;18:1988–2000. - PubMed

Publication types

LinkOut - more resources