. 2022 Mar:502:113228.
doi: 10.1016/j.jim.2022.113228. Epub 2022 Jan 21.

A sensitive and less cytotoxic assay for identification of proliferating T cells based on bioorthogonally-functionalized uridine analogue

Affiliations

A sensitive and less cytotoxic assay for identification of proliferating T cells based on bioorthogonally-functionalized uridine analogue

F C Stempels et al. J Immunol Methods. 2022 Mar.

Abstract

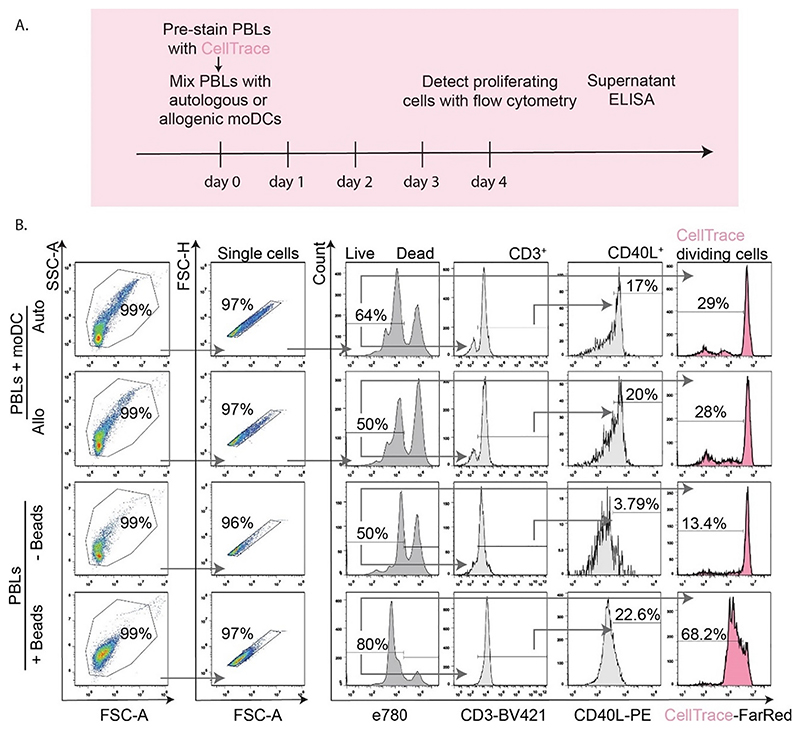
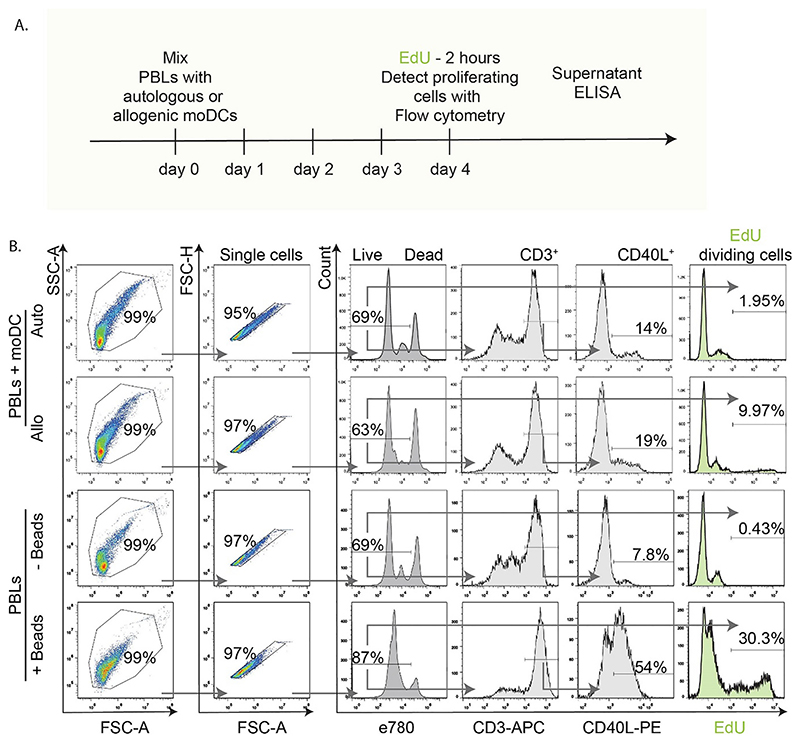
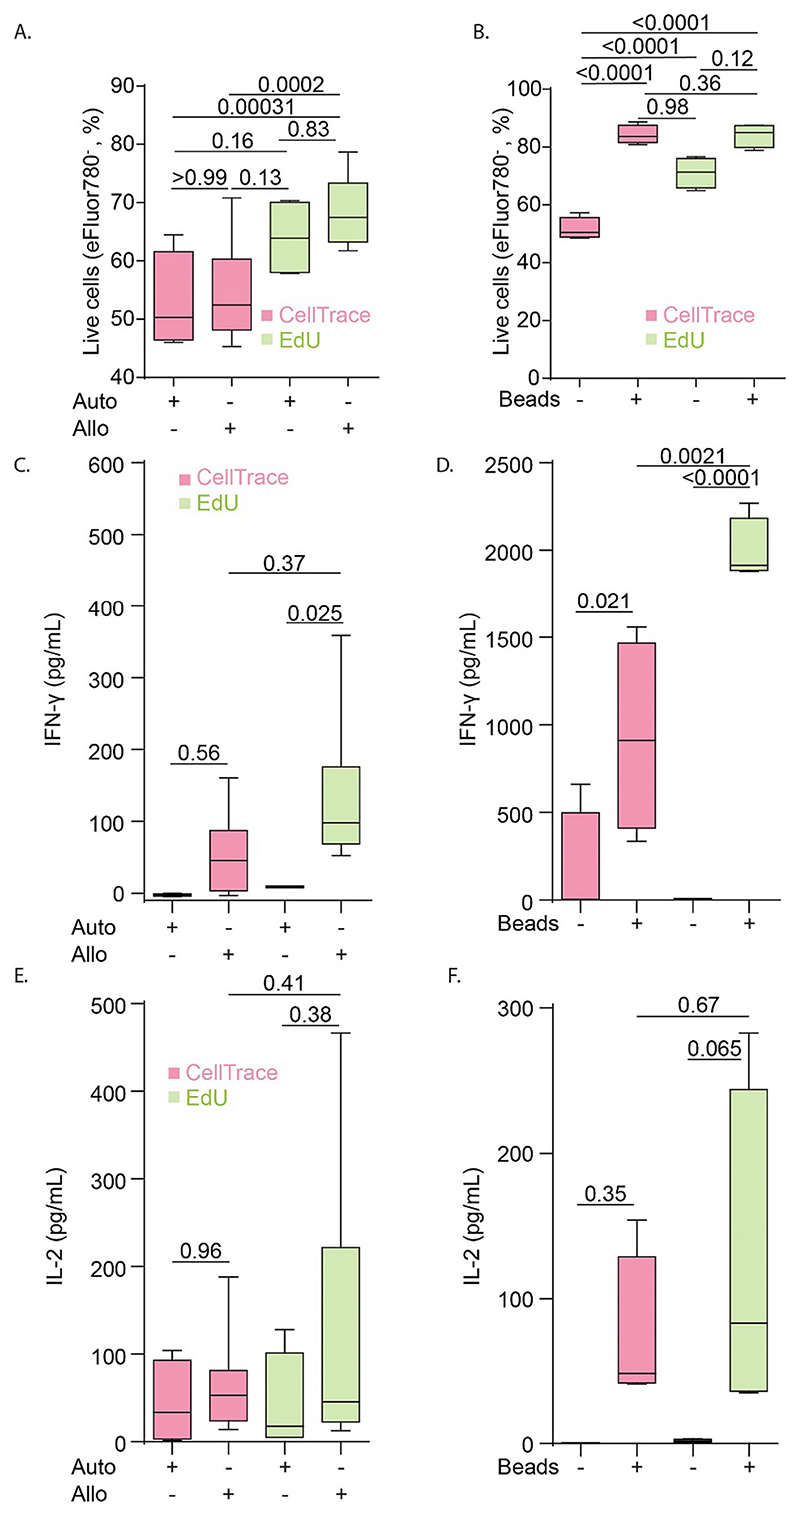
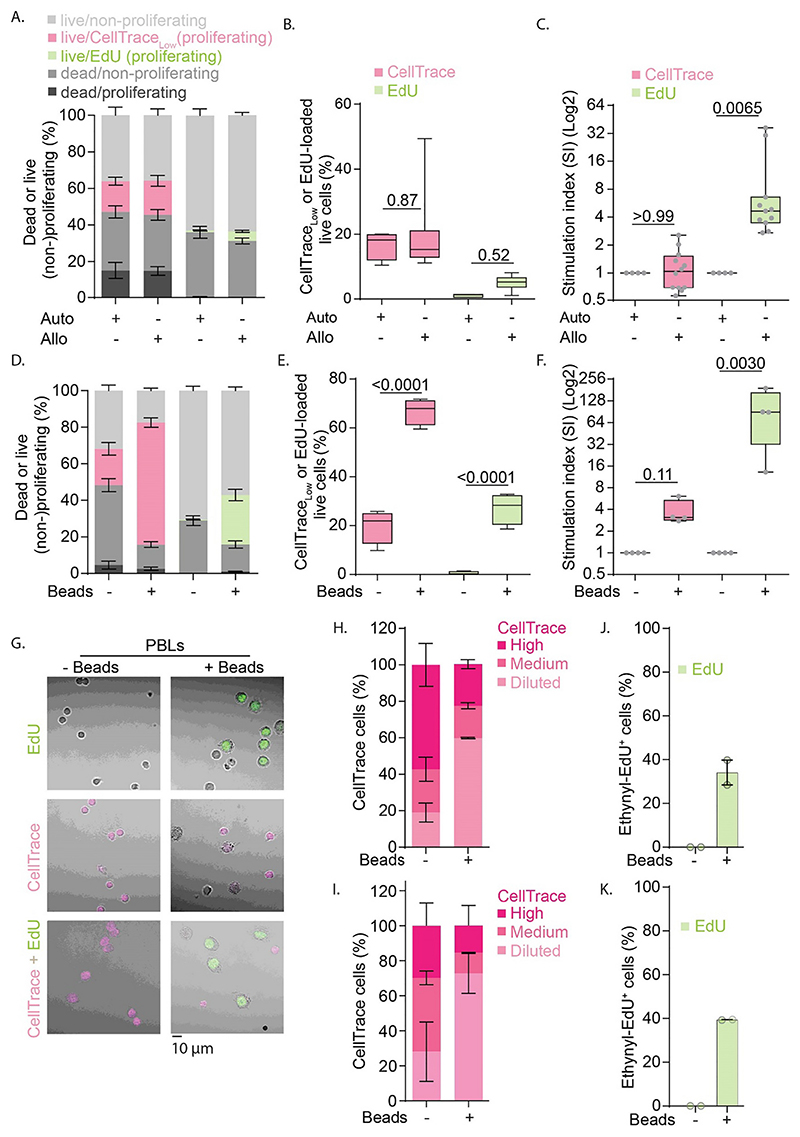
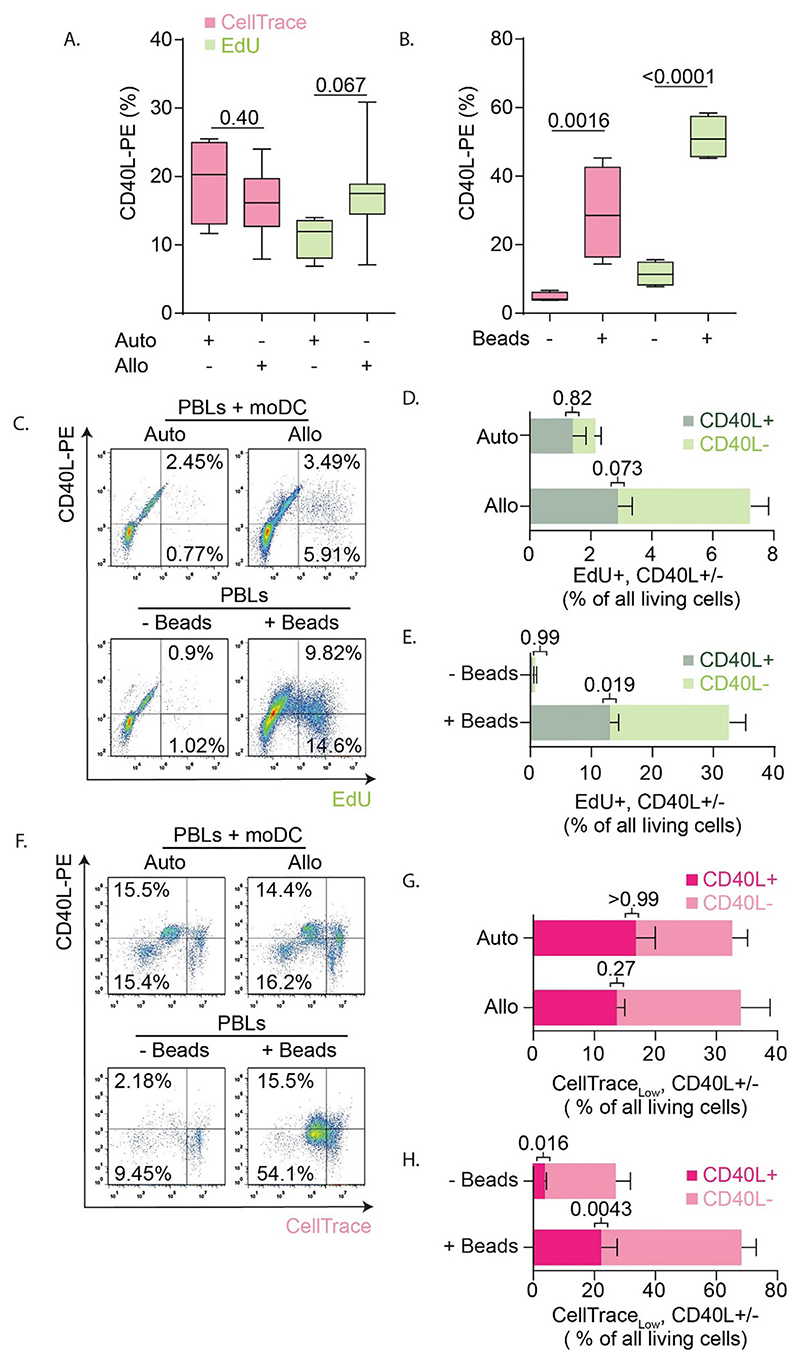
Quantitative detection of T cell proliferation is an important readout in immunology research, as it is one of the hallmarks of T cell activation. Fluorescence-based methods for T cell proliferation mostly rely on the usage of probes that non-specifically conjugate to free primary amine groups in cells. Each cell division then results in a two-fold dilution of the probes which is detectable with flow cytometry. However, questions have been raised about cytotoxicity of these dilution-based T cell proliferation probes and they potentially affect T cell activation. An alternative assay relies on the incorporation of the uridine analog BrdU in the DNA of dividing T cells that can be detected with an antibody, but this requires harsh fixation and denaturation conditions. Recently, a new assay for detection of cell proliferation has been developed, based on the incorporation of the bioorthogonally-functionalized uridine analog 5-ethynyl-2'-deoxyuridine (EdU). Goal of this study was to compare the sensitivity and cytotoxicity of the EdU assay with a widely-used dilution-based T cell proliferation probe, CellTrace Far Red. We found that, compared to the dilution-based probe, the EdU-based assay better preserves T cell viability, is more sensitive for detecting T cell proliferation, and allows for better discernable interferon gamma responses.

Keywords: Dilution-based probe; EdU; Ethynyl-uridine; T cell activation; T cell proliferation.


Conflict of interest statement

Declaration of Competing Interest

None.

Figures

Fig. 1
Fig. 1. CellTrace detection of proliferated T cells and flow cytometry gating.
A. Scheme of mixed leukocyte reaction (MLR) with CellTrace pre-loading of PBLs on day 0 prior to co-culturing with moDCs. MoDCs and PBLs from the same donor (autologous, Auto) pairs were used as negative controls for T cell activation. Pairs with PBLs and moDCs from different donors (allogenic, Allo), were used to initiate T cell proliferation/activation, which was detected by flow cytometry and ELISA. B. Flow cytometry gating strategy used for the MLRs or for the PBLs activated with anti-CD3 anti-CD28 beads (+/-Beads). The cells were selected based on forward and side scatter, followed by exclusion of cell clumps (single cells). Next, eFluor780 staining was used to exclude dead cells. Live cells were analyzed for CD3, CD40L and CellTrace. A reduction of intensity in the CellTrace histograms indicates proliferated cells. Arrows show gating order. Experiments were performed with cells isolated from 4 donors; quantification in Fig. 3.
Fig. 2
Fig. 2. EdU-based detection of proliferating T cells and flow cytometry gating.
A. Scheme of MLR experiments as in Fig. 1A, with the difference that cell loading with EdU was performed on day 4; two hours prior to fixation and analysis. B. Flow cytometry gating strategy used for the MLR with autologous (Auto) or allogenic (Allo) pairs of PBLs and moDCs or for the PBLs activated with anti-CD3 anti-CD28 beads (+/-Beads). Cells were selected based on forward and side scatter, followed by exclusion of cell clumps (single cells). Next, dead cells were excluded by selecting cells with low eFluor780 intensity using the same gate as for the CellTrace samples. Live cells were analyzed for CD3, CD40L and EdU incorporation (detected by bioorthogonal click-chemistry). An EdU histogram intensity shift towards the right indicates proliferating cells. Arrows show gating order. Experiments were performed with cells isolated from 4 donors; quantification in Fig. 3.
Fig. 3
Fig. 3. Viability assessment and cytokine detection in experiments with CellTrace and EdU.
A-B. Quantification of cell viability detected for the MLR with autologous (Auto) or allogenic (Allo) pairs of PBLs and moDCs (A.), and for the anti-CD28 anti-CD3 bead-activated PBLs (+/-Beads) (B.) for the CellTrace (pink) and EdU (green) experiments. C. IFN-γ detection in supernatants from the MLR-experiments with CellTrace or EdU. D. Same as panel C, but for bead-stimulated PBLs. E-F. Same as panels C—D but for IL-2 production. All experiments were performed with cells isolated from 4 donors. Box plots represent mean, min and max values. P-values were evaluated with one-way ANOVA followed by Sidak’s post-hoc test. (For interpretation of the references to colour in this figure legend, the reader is referred to the web version of this article.)
Fig. 4
Fig. 4. Assessment of PBL proliferation in experiments with CellTrace and EdU.
A. Quantification of live, dead and proliferating and non-proliferating cells detected for MLR with autologous (Auto) or allogenic (Allo) pairs of PBLs and moDCs with CellTrace (pink) and EdU (green). B. Quantification of live proliferated cells. C. Normalization of MLR shown in panel B to the autologous conditions for each individual donor. D—F. Same as panels A-C, but now for PBLs stimulated with anti-CD3 anti-CD28 beads (+/-Beads). G. Representative confocal images of bead-stimulated PBLs. Cells were labeled with EdU (green), CellTrace (pink), or both. Scale bar, 10 μm. HK—. Quantification of fluorescence signals from panel G for experiments with only CellTrace (H.), only EdU (J.) and both (IK—.). For the CellTrace fluorescence (panels H and I), the signals were differentiated with manual thresholds in three categories: Diluted, Medium, and High. Experiments were performed with cells isolated from either 4 donors (panels A-F) or two donors (G-K). All box plots represent mean, min and max values. Bar graphs represent mean ± SEM. P-values were evaluated with one-way ANOVA (B, E) followed by Sidak’s post-hoc test or Kruskal-Wallis test on normalized data (C, F). For confocal imaging ~180 cells per condition were analyzed. (For interpretation of the references to colour in this figure legend, the reader is referred to the web version of this article.)
Fig. 5
Fig. 5. Expression of T cell activation marker CD40L in experiments with CellTrace and EdU.
A-B. Quantification of CD40L expression for the MLR with autologous (Auto) or allogenic (Allo) pairs of PBLs and moDCs (A.), and for the anti-CD28 anti-CD3 bead-activated PBLs (+/-Beads) (B.) for the CellTrace (pink) and EdU (green) experiments. C. Scatter plot with flow cytometry gating strategy on the living cells from Fig. 2B with EdU (x-axis) and CD40L-PE (y-axis) for MLR (top row) and bead-stimulation (bottom row). D. Quantification of panel C for MLR reaction where the percentages of EdU+/CD40L+ and EdU+/CD40L T cells are quantified. E. Same as panel D, but now for bead-activated PBLs. F—H. Gating strategy and quantifications of CellTracelow/CD40L+ and CellTracelow/CD40L T cells for the CellTrace experiments. For all panels, experiments were performed with cells isolated from 4 donors. All box plots represent mean, min and max values. P-values were evaluated with one-way ANOVA followed by Sidak’s post-hoc test. (For interpretation of the references to colour in this figure legend, the reader is referred to the web version of this article.)

References

    1. Alvarez KLF, Poma-Acevedo A, Fernéandez-Saénchez M, Fernéandez-Diéaz M. An EdU-based flow cytometry assay to evaluate chicken T lymphocyte proliferation. BMC Vet Res. 2020;16 - PMC - PubMed
    1. Baranov MV, Bianchi F, Schirmacher A, van Aart MAC, Maassen S, Muntjewerff EM, Dingjan I, ter Beest M, Verdoes M, Keyser SGL, et al. The phosphoinositide kinase PIKfyve promotes Cathepsin-S-mediated major histocompatibility complex class II antigen presentation. IScience. 2019;11:160–177. - PMC - PubMed
    1. Cella M, Scheidegger D, Palmer-Lehmann K, Lane P, Lanzavecchia A, Alber G. Ligation of CD40 on dendritic cells triggers production of high levels of interleukin-12 and enhances T cell stimulatory capacity: T-T help via APC activation. J Exp Med. 1996;184:747–752. - PMC - PubMed
    1. Cheraghali AM, Morin KW, Kumar R, Knaus EE, Wiebe LI. Accumulation of 5-ethyl-2’-deoxyuridine and its 5,6-dihydro prodrugs in murine lung and its potential clinical application. J Pharm Pharmacol. 1995;47:595–600. - PubMed
    1. Daoussis D, Andonopoulos AP, Liossis S-NC. Targeting CD40L: a promising therapeutic approach. Clin Diagn Lab Immunol. 2004;11:635–641. - PMC - PubMed

Publication types

LinkOut - more resources