. 2022 Mar;114(2):110270.
doi: 10.1016/j.ygeno.2022.110270. Epub 2022 Jan 22.

Betacoronavirus-specific alternate splicing

Affiliations

Betacoronavirus-specific alternate splicing

Guy Karlebach et al. Genomics. 2022 Mar.

Abstract

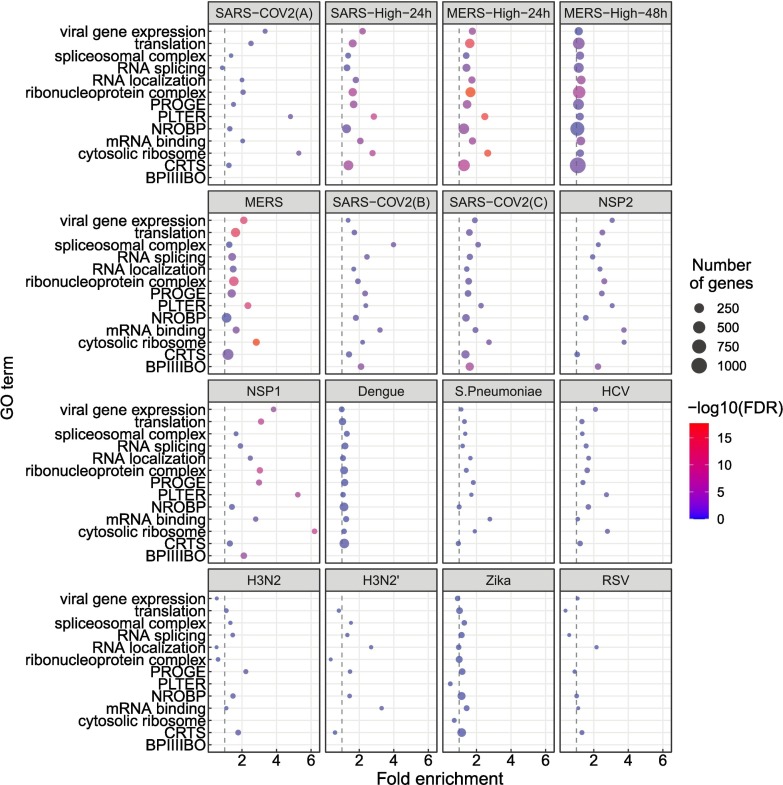
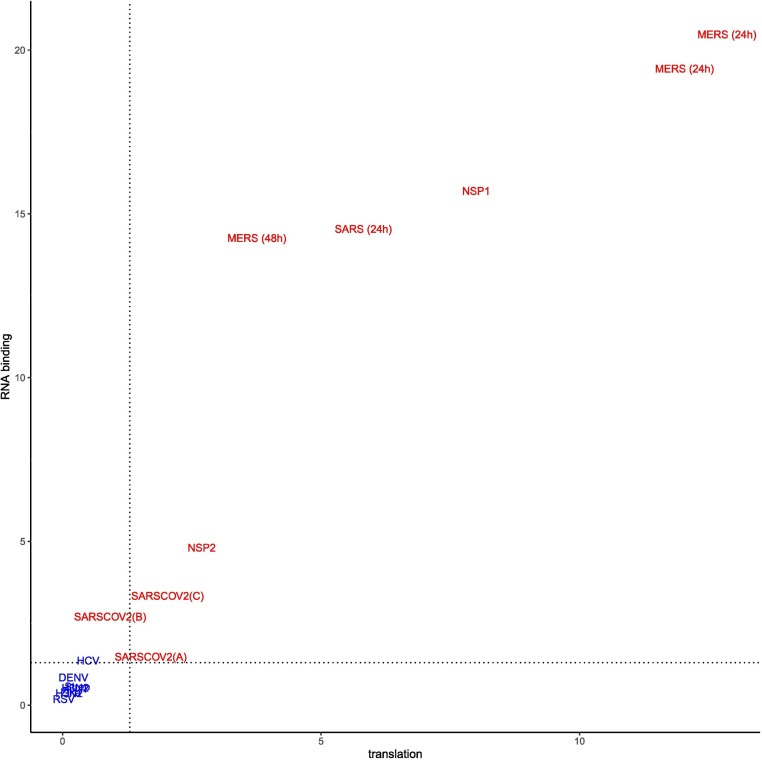
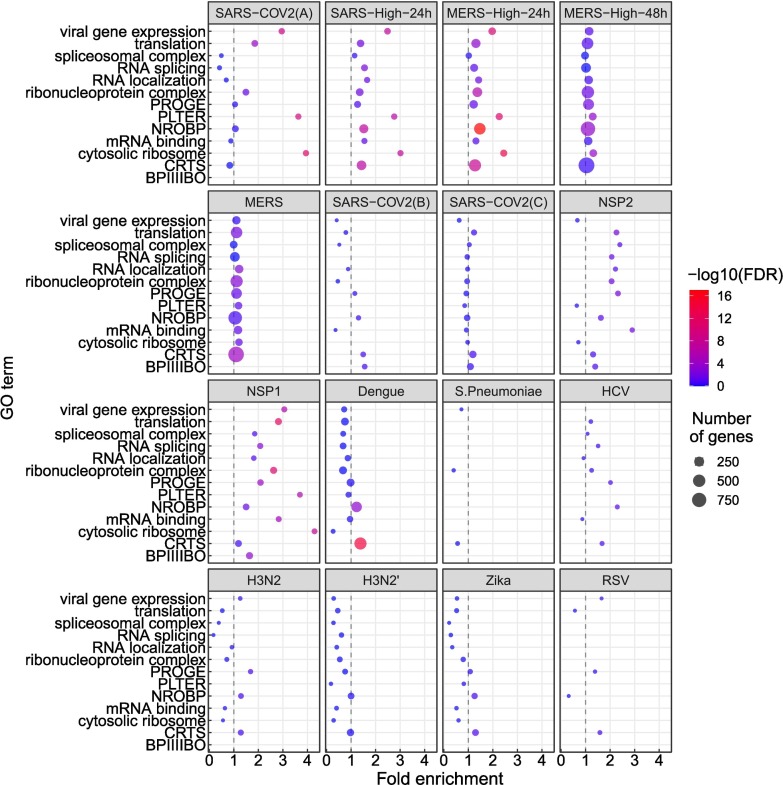
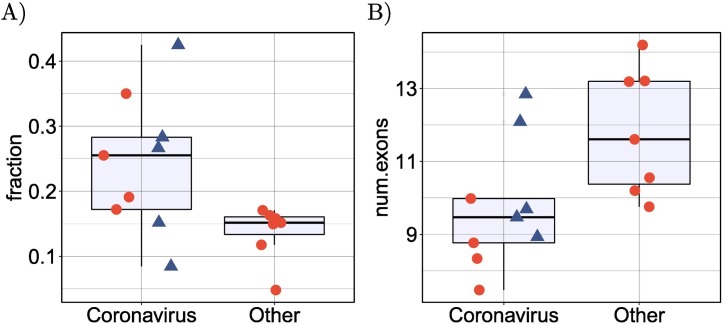
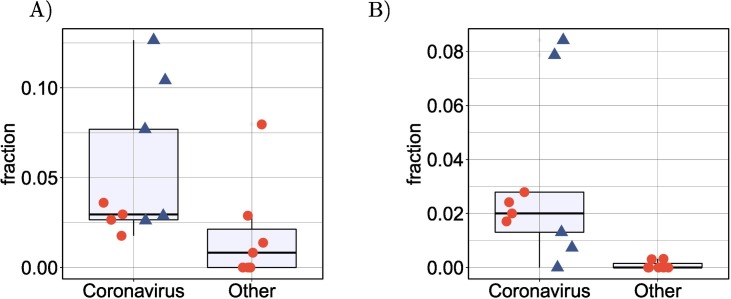
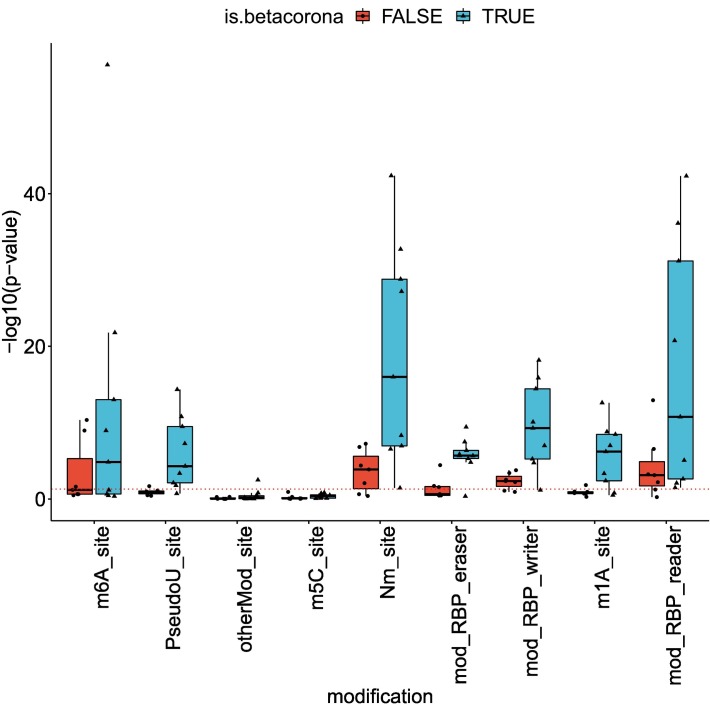
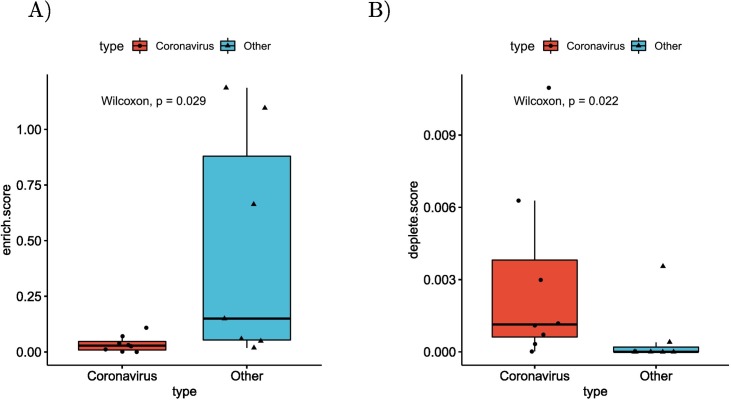
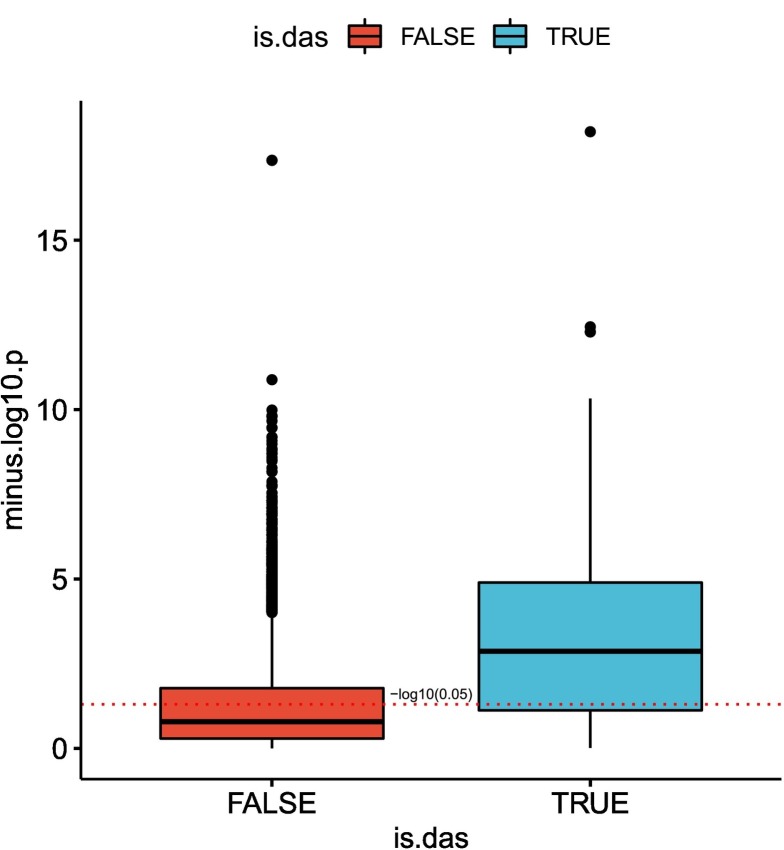
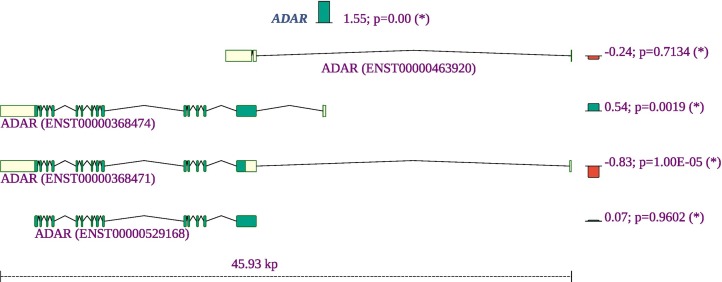
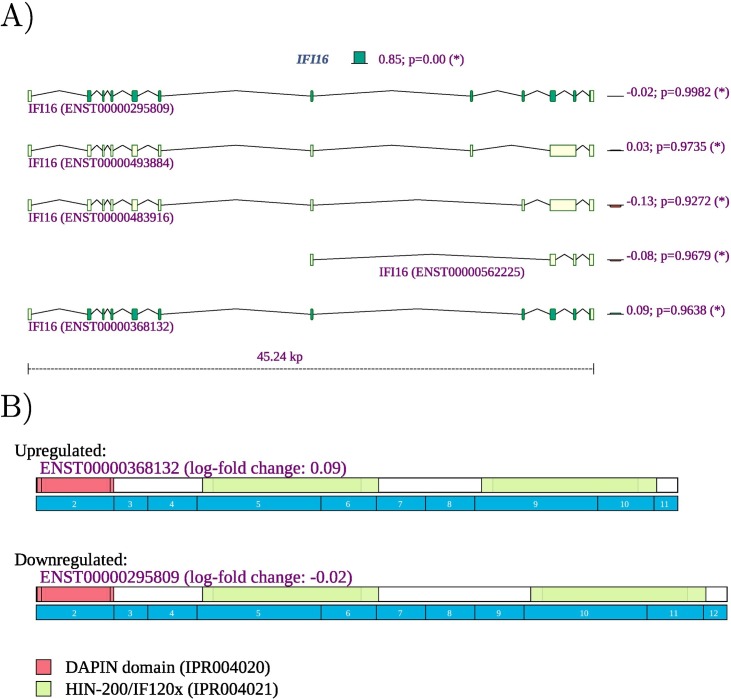
Viruses can subvert a number of cellular processes including splicing in order to block innate antiviral responses, and many viruses interact with cellular splicing machinery. SARS-CoV-2 infection was shown to suppress global mRNA splicing, and at least 10 SARS-CoV-2 proteins bind specifically to one or more human RNAs. Here, we investigate 17 published experimental and clinical datasets related to SARS-CoV-2 infection, datasets from the betacoronaviruses SARS-CoV and MERS, as well as Streptococcus pneumonia, HCV, Zika virus, Dengue virus, influenza H3N2, and RSV. We show that genes showing differential alternative splicing in SARS-CoV-2 have a similar functional profile to those of SARS-CoV and MERS and affect a diverse set of genes and biological functions, including many closely related to virus biology. Additionally, the differentially spliced transcripts of cells infected by coronaviruses were more likely to undergo intron-retention, contain a pseudouridine modification, and have a smaller number of exons as compared with differentially spliced transcripts in the control groups. Viral load in clinical COVID-19 samples was correlated with isoform distribution of differentially spliced genes. A significantly higher number of ribosomal genes are affected by differential alternative splicing and gene expression in betacoronavirus samples, and the betacoronavirus differentially spliced genes are depleted for binding sites of RNA-binding proteins. Our results demonstrate characteristic patterns of differential splicing in cells infected by SARS-CoV-2, SARS-CoV, and MERS. The alternative splicing changes observed in betacoronaviruses infection potentially modify a broad range of cellular functions, via changes in the functions of the products of a diverse set of genes involved in different biological processes.

Keywords: Alternative splicing; Betacoronavirus; COVID-19; Gene regulation; SARS-CoV-2.


Conflict of interest statement

The authors declare no competing interests.

Figures

Fig. 1
Fig. 1
GO enrichment for genes showing differential alternative splicing (DAS). 14 representative GO terms were chosen from a total of 1044 enriched terms (Supplemental Figure S1). The x-axis coordinate corresponds to the fold-change of the size of the GO term in the set of differentially-spliced genes compared to all the genes in the study. The size of the circle corresponds to the number of differentially-spliced genes that belong to the GO term. The color of the circle corresponds to the value of the −log10 of the corrected GO term enrichment p-values. Abbreviations. BPIIIIBO: biological process involved in interspecies interaction between organisms; CRTS: cellular response to stress; NROBP: negative regulation of biosynthetic process; PLTER: protein localization to endoplasmic reticulum; PROGE: posttranscriptional regulation of gene expression.
Fig. 2
Fig. 2
Enrichment for translation (GO:0006412) and RNA binding (GO:0003723) among DAS genes. The X and Y axes show the −log10(adjusted p value) for DAS enrichment for the GO terms translation (GO:0006412) and RNA binding (GO:0003723) in each of the datasets analyzed in this work. Betacoronavirus datasets are shown in red, others are shown in blue. The dashed lines correspond to an adjusted p-value of 0.05. Betacoronaviruses have higher enrichment scores for translation and RNA binding, suggesting that differential splicing has a larger impact on these processes. The datasets in blue (lower left) are the non-betacoronaviruses RSV,Zika, H3N2, Strep, DENV and HCV. For abbreviations see Table 1. (For interpretation of the references to colour in this figure legend, the reader is referred to the web version of this article.)
Fig. 3
Fig. 3
GO enrichment for genes showing differential gene expression (DGE). The GO terms and abbreviations are the same as in Fig. 1. The x-axis coordinate corresponds to the fold-change of the size of the GO term in the set of differentially-expressed genes compared to all the genes in the study. The size of the circle corresponds to the number of differentially-expressed genes that belong to the GO term. The color of the circle corresponds to the value of the −log10 of the corrected GO term enrichment p-values. Abbreviations as in Fig. 1.
Fig. 4
Fig. 4
Intron retention and exon count. (A) Comparison of the mean proportion of intron retention isoforms in 9 coronavirus samples against the remaining 7 samples for the other pathogens in cyan. p=0.016, Mann-Whitney-test. For each dataset, the mean proportion is calculated as the number of DAS isoforms annotated as retained intron isoforms is divided by the total number of DAS isoforms. (B) Comparison of the mean number of exons in 9 coronavirus samples against the remaining 7 samples for the other pathogens in cyan. p=0.016, Mann-Whitney-test. For each dataset, the mean number of exons is calculated over all DAS isoforms. In both panels, the four SARS-CoV-2 datasets (SARS-CoV-2-A, SARS-CoV-2-B, SARS-CoV-2-C,NSP1 and NSP2) are shown as triangles. (For interpretation of the references to colour in this figure legend, the reader is referred to the web version of this article.)
Fig. 5
Fig. 5
Proportion of DAS and DGE ribosomal genes. (A) Comparison of the mean proportion of DAS ribosomal genes in 7 coronavirus samples and cells infected with NSP1 or NSP2 against 7 samples infected with other pathogens. p=0.033, Mann-Whitney-test. For each dataset, the mean proportion is calculated as the number of ribosomal genes containing DAS isoforms divided by the total number of genes containing DAS isoforms. (B) Comparison of the mean proportion of differentially expressed ribosomal genes in 7 coronavirus samples and cells infected with NSP1 or NSP2 against 7 samples infected with other pathogens. p=0.004, Mann-Whitney-test. For each dataset, the mean proportion is calculated as the number of ribosomal genes that were differentially expressed divided by the total number of differentially expressed genes. In both panels, the four SARS-CoV-2 datasets (SARS-CoV-2-A, SARS-CoV-2-B, SARS-CoV-2-C, NSP1 and NSP2) are shown as triangles.
Fig. 6
Fig. 6
RNA modifications associated with betacoronavirus-enriched alternative splicing. The y-axis corresponds to the enrichment score of the modification in the set of differentially-spliced genes, calculated as −log10 of the hypergeometric test p-value. The dashed red line corresponds to a p-value of 0.05. RNA modifications were obtained from the RBM database [49]. Abbreviations: m6A: N6-methyladenine, PseudoU: pseudouridine, otherMod: other modification, m5c: 5-methylcytosine, Nm: 2′-O-methylation, RBP eraser: “erasers” of RNA modifications, RBP writer: “writers” of RNA modifications, m1a: N1-methyladenosine, RBP reader: “readers” of RNA modifications. (For interpretation of the references to colour in this figure legend, the reader is referred to the web version of this article.)
Fig. 7
Fig. 7
Differential splicing and enrichment/depletion of RNA Binding Protein Binding Sites. (A) For each dataset the number of RBP binding sites with enriched targets (adjusted p≤0.05,hypergeometric test) divided by the number of differentially spliced isoforms are displayed, with separate boxes for betacoronavirus datasets and other datasets(p=0.0289, Mann-Whitney test). RBP binding sites were obtained from the oRNAment database [50]. (B) Boxplots of the number of RBP binding sites with depleted targets (adjusted p≤0.05,hypergeometric test) divided by the number of non-differentially spliced isoforms (p=0.0216, Mann-Whitney test).
Fig. 8
Fig. 8
Isoform distribution and viral load. The correlation between viral load in each clinical sample and count proportion for isoforms that belong to DAS genes (blue) and for isoforms of non-DAS genes (red) is shown. For each isoform, the proportion of its counts out of the total number of isoform counts of its corresponding gene was calculated in each sample, and a Kendall correlation test between these values and the fractions of SARS-COV2 RNA was performed. The y-axis corresponds to the −log10 of the p-value. The red dashed line corresponds to a p-value of 0.05. The correlation between the raw proportions of differentially-spliced isoforms and suggest that the severity of viral infection as reflected in viral load may be a factor in determining the distribution of patterns of alternative splicing. (For interpretation of the references to colour in this figure legend, the reader is referred to the web version of this article.)
Fig. 9
Fig. 9
Summary of the gene expression and splicing profile of ADAR in COVID-19 patient samples. The expression of ADAR was increased by a factor of 21.55=3.1. The proportion of isoforms containing two Z-DNA binding domains are increased, whereas an isoform expressing one such domain is decreased. Green (red) bars mark isoforms that increase (decrease) in proportion. The number to the left of the semicolon is the log-fold-change of the isoform's proportion. The value is the probability of no effect (See Methods). Exons are shown as yellow or green boxes, with green signifying a coding region and the yellow segments indicating the 5′ and 3′ untranslated regions. (For interpretation of the references to colour in this figure legend, the reader is referred to the web version of this article.)
Fig. 10
Fig. 10
IFI16 A) The expression of IFI16 is increased with a fold change of 22.40=5.23. Reads were mapped to two of the 14 isoforms noted in Ensembl. The expression of isoform ENST00000295809, corresponding to IFI16A, was 20.85=1.80 higher in lung samples from COVID-19 patients, and the expression of isoform ENST00000448393, corresponding to IFI16C, was 2−1.95 or 3.86 times lower.

Update of

References

    1. Yuki K., Fujiogi M., Koutsogiannaki S. COVID-19 pathophysiology: a review. Clinical Immunol. (Orlando, Fla.) 2020;215 doi: 10.1016/j.clim.2020.108427. - DOI - PMC - PubMed
    1. Puelles V.G., Lütgehetmann M., Lindenmeyer M.T., Sperhake J.P., Wong M.N., Allweiss L., Chilla S., Heinemann A., Wanner N., Liu S., Braun F., Lu S., Pfefferle S., Schröder A.S., Edler C., Gross O., Glatzel M., Wichmann D., Wiech T., Kluge S., Pueschel K., Aepfelbacher M., Huber T.B. Multiorgan and renal tropism of SARS-CoV-2. N. Engl. J. Med. 2020;383(6):590–592. - PMC - PubMed
    1. Wiersinga W.J., Rhodes A., Cheng A.C., Peacock S.J., Prescott H.C. Pathophysiology, transmission, diagnosis, and treatment of coronavirus disease 2019 (COVID-19): a review. JAMA. 2020;324:782–793. doi: 10.1001/jama.2020.12839. - DOI - PubMed
    1. Baralle F.E., Giudice J. Alternative splicing as a regulator of development and tissue identity. Nat. Rev. Mol. Cell Biol. 2017;18:437–451. doi: 10.1038/nrm.2017.27. - DOI - PMC - PubMed
    1. Nilsen T.W., Graveley B.R. Expansion of the eukaryotic proteome by alternative splicing. Nature. 2010;463:457–463. doi: 10.1038/nature08909. - DOI - PMC - PubMed

Publication types