. 2022 Jan 25;119(4):e2119078119.
doi: 10.1073/pnas.2119078119.

Disruption of MeCP2-TCF20 complex underlies distinct neurodevelopmental disorders

Affiliations

Disruption of MeCP2-TCF20 complex underlies distinct neurodevelopmental disorders

Jian Zhou et al. Proc Natl Acad Sci U S A. .

Abstract

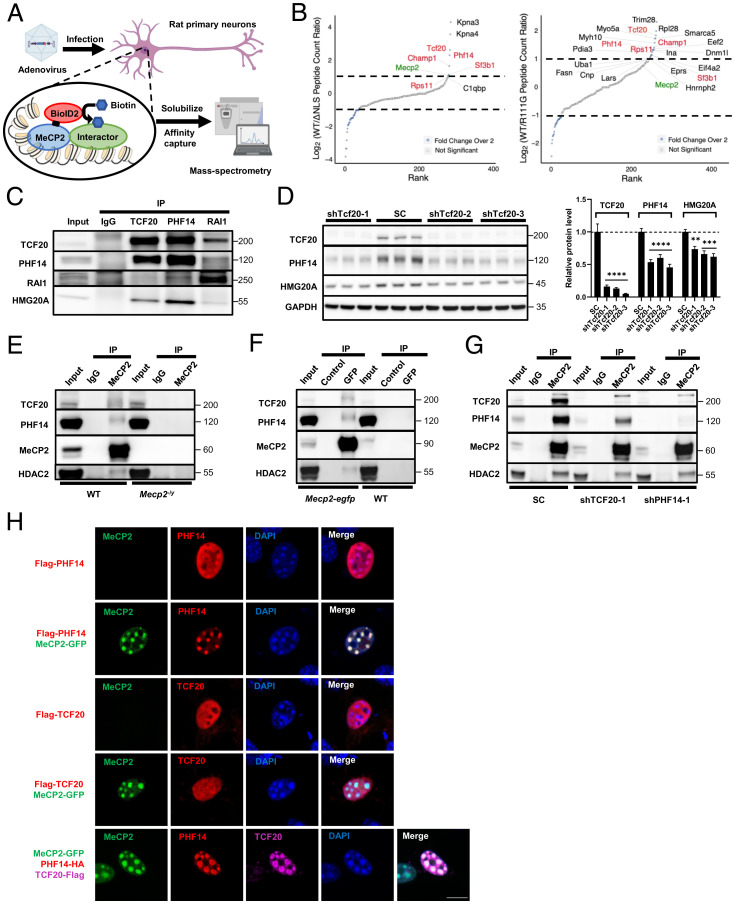
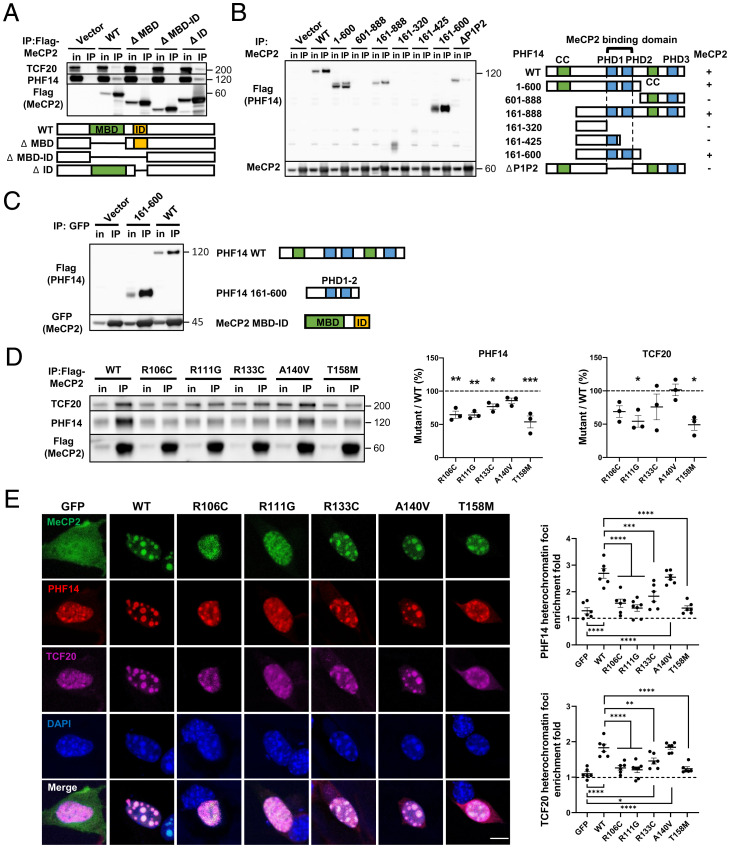
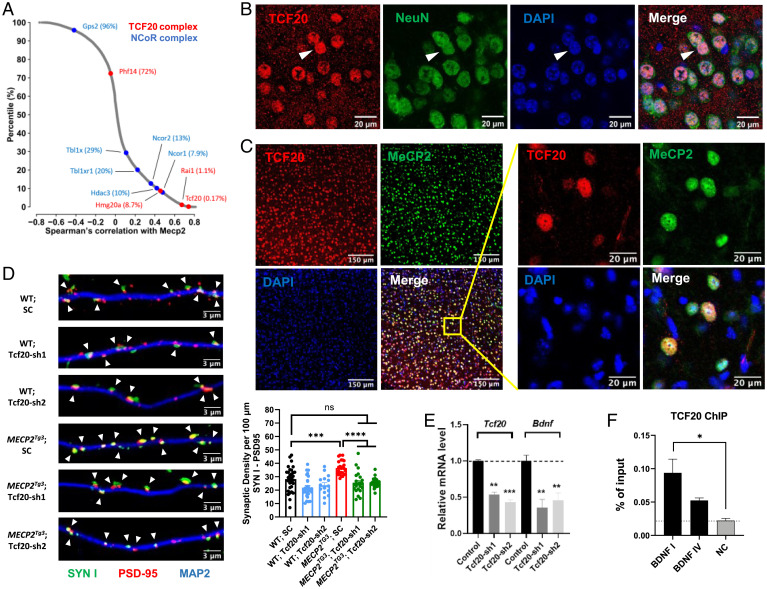
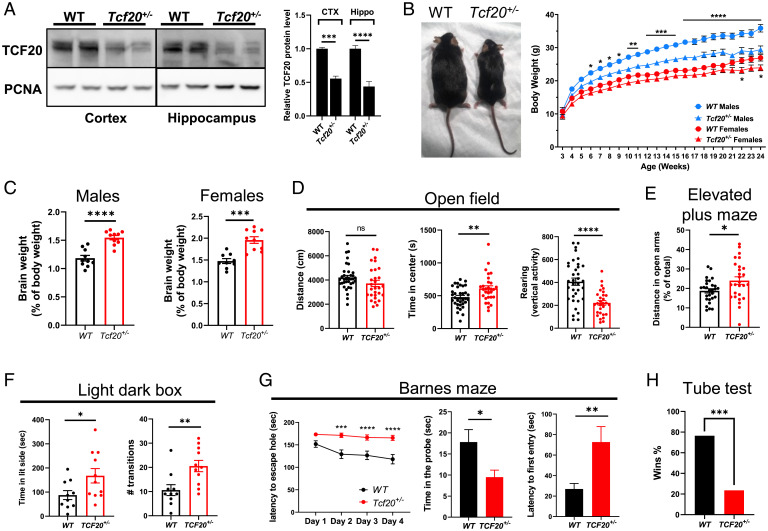
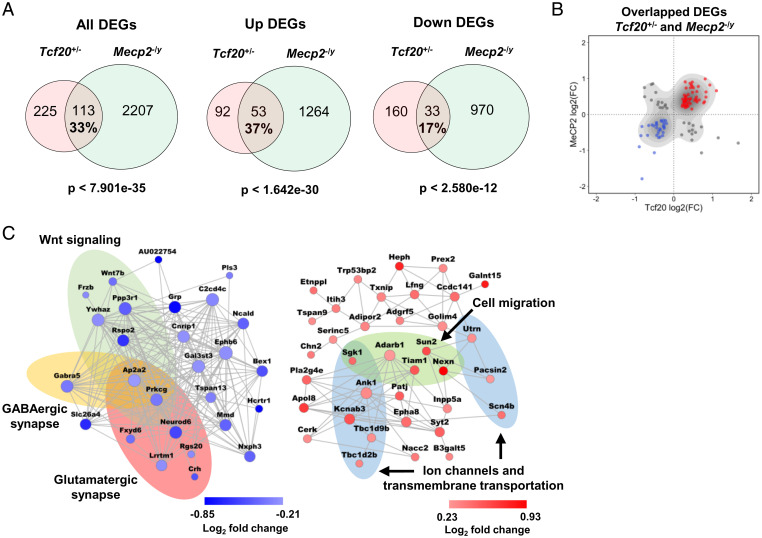
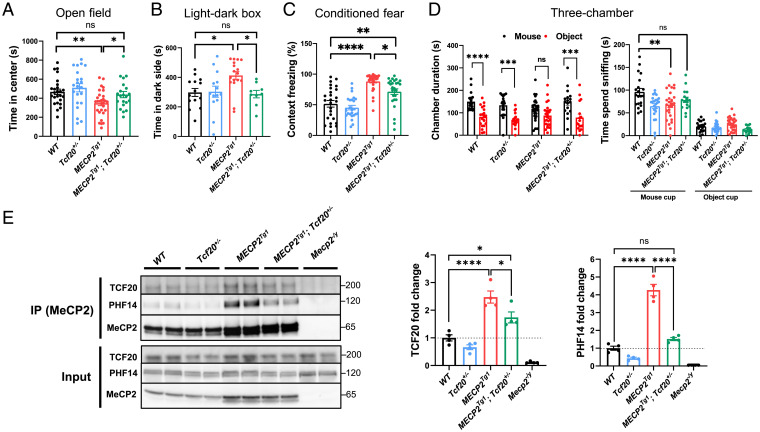
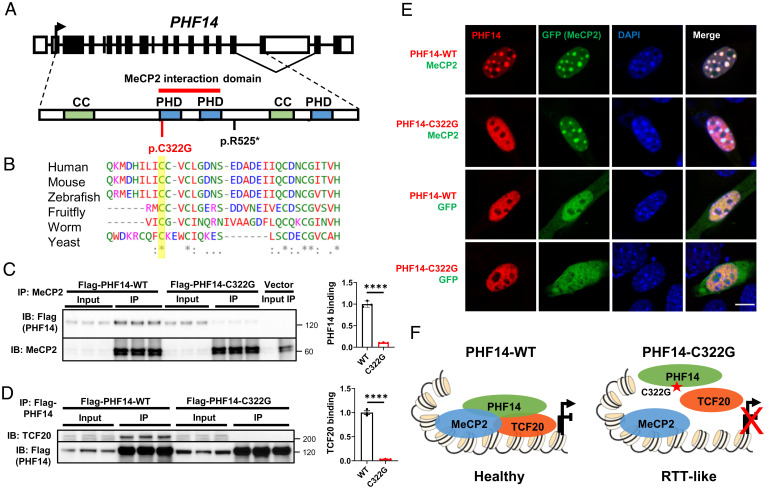
MeCP2 is associated with Rett syndrome (RTT), MECP2 duplication syndrome, and a number of conditions with isolated features of these diseases, including autism, intellectual disability, and motor dysfunction. MeCP2 is known to broadly bind methylated DNA, but the precise molecular mechanism driving disease pathogenesis remains to be determined. Using proximity-dependent biotinylation (BioID), we identified a transcription factor 20 (TCF20) complex that interacts with MeCP2 at the chromatin interface. Importantly, RTT-causing mutations in MECP2 disrupt this interaction. TCF20 and MeCP2 are highly coexpressed in neurons and coregulate the expression of key neuronal genes. Reducing Tcf20 partially rescued the behavioral deficits caused by MECP2 overexpression, demonstrating a functional relationship between MeCP2 and TCF20 in MECP2 duplication syndrome pathogenesis. We identified a patient exhibiting RTT-like neurological features with a missense mutation in the PHF14 subunit of the TCF20 complex that abolishes the MeCP2-PHF14-TCF20 interaction. Our data demonstrate the critical role of the MeCP2-TCF20 complex for brain function.

Keywords: BioID; MeCP2; Rett syndrome; TCF20 complex; neurodevelopmental disorders.


Conflict of interest statement

The authors declare no competing interest.

Figures

Fig. 1.
Fig. 1.
MeCP2 interacts with the TCF20 complex in vitro and in vivo. (A) The experimental strategy using BioID2-dependent proximity biotinylation to identify MeCP2 interactors. (B) Rank plots showing the enrichment of MeCP2-BioID2 peptide spectral matches (PSMs) over MeCP2ΔNLS-BioID2 (Left) and MeCP2R111G-BioID2 (Right) PSMs. BioID2-tagged protein (MeCP2) is indicated in green, proteins shown enrichment in both experiments are indicated in red. Only proteins with more than 10 peptide counts collected in the WT sample were plotted. Proteins with fewer than 10 peptide counts, such as RAI1, ATRX, and two components of the NCoR1/2 complex, TBL1XR1 and TBL1X, were not shown in the plots, although they were enriched for twofold or more compared to at least one negative controls (full lists of the peptides collected in the BioID MS is given in Dataset S1). (C) Representative immunoblot of TCF20, PHF14, RAI1, and HMG20A protein levels following IP of TCF20, PHF14 or RAI1 from mouse cortical lysates. (D) Representative immunoblot (Left) and quantification (Right) of TCF20, PHF14, and HMG20A protein levels following Tcf20 knockdown or scramble control (SC) in HEK293T cells (n = 3 per group; two-way ANOVA with post hoc Tukey’s tests). **P < 0.01, ***P < 0.001, ****P < 0.0001; data are mean ± SEM. (E and F) Representative immunoblots of TCF20, PHF14, and HDAC2 protein levels following IP of MeCP2 from WT and Mecp2-null cortical lysates (E) or GFP from Mecp2-egfp and WT cortical lysates (F). GFP-Trap Dynabeads (GFP) and control Dynabeads (Control) were used to IP GFP-tagged MeCP2 in F. (G) Representative immunoblot of TCF20, PHF14, and HDAC2 protein levels following IP of MeCP2 from HEK293T cells transduced with a nontargeting scramble (SC) lentivirus or lentiviral shRNA targeting TCF20 or PHF14. (H) Representative immunocytochemical images in mouse 3T3 fibroblasts showing the colocalization of Flag-tagged PHF14, Flag-tagged TCF20, or both HA-tagged PHF14 and Flag-tagged TCF20 relative to densely methylated heterochromatic foci (stained by DAPI) upon overexpression of MeCP2-GFP. (Scale bar, 10 µm.)
Fig. 2.
Fig. 2.
RTT-causing mutations in the MeCP2 MBD disrupt interactions with the TCF20 complex. (A) Representative immunoblot of TCF20 and PHF14 protein levels following IP of Flag-tagged WT and truncated MeCP2 in HEK293T cells. (B) Representative immunoblot (Left) and summary of the co-IP results (Right) of Flag-tagged WT and truncated PHF14 protein variants following IP of MeCP2 in HEK293T cells. The “+/−” denotes the presence (+) or absence (−) of MeCP2 interaction. (C) Representative immunoblot of Flag-tagged WT and truncated PHF14 (PHD1-2) proteins following IP of GFP-tagged truncated MeCP2 (MBD–ID) in HEK293T cells. (D) Representative immunoblot (Left) and quantification (Center and Right) of TCF20 and PHF14 protein levels following IP of Flag-MeCP2 variants in HEK293T cells. The abundance of the co-IP TCF20 and PHF14 was normalized to that of IP MeCP2 to quantify the interaction between TCF20/PHF14 and WT or mutant MeCP2. The ratio of normalized TCF20/PHF14 of each mutant to that of WT was calculated as the percentage of mutant/WT (n = 3 per group, one-way ANOVA with post hoc Tukey’s test). (E) Representative immunocytochemical images (Left) and quantification (Right) of HA-tagged PHF14 and Flag-tagged TCF20 enrichment to densely methylated heterochromatic foci (stained by DAPI) upon overexpression of WT and mutant MeCP2-GFP in mouse 3T3 fibroblasts. The heterochromatin foci enrichment fold was calculated as the ratio of mean gray value within foci area to mean gray value outside of foci area (n = 6 per group, one-way ANOVA with post hoc Tukey’s test). (Scale bar, 10 µm.) *P < 0.05, **P < 0.01, ***P < 0.001, ****P < 0.0001; data are mean ± SEM.
Fig. 3.
Fig. 3.
Tcf20 is coexpressed with Mecp2 in mouse neurons and regulates MECP2-mediated synapse formation. (A) Scatter plot shows the distribution of Spearman’s correlation with Mecp2 in adult mouse brain for all the genes expressed in at least one cell type. Red and blue dots denote the TCF20 complex and NCoR1/2 complex components, respectively, with top percentiles shown in parentheses. (B) Representative immunocytochemical images of mouse cortex showing TCF20 (red) is localized in the nucleus (blue, detected by DAPI) of NeuN+ (green) neurons, arrowheads. (C) Representative immunocytochemical images of mouse cortex showing TCF20 (red), MeCP2 (green), and DAPI (blue) proteins. (D) Representative images (Left) and quantification (Right bottom) of synaptic density marked by colocalization of Synapsin I (SYN I, green) and PSD-95 (red) puncta, arrowheads, with MAP2 (blue) in cultured mouse hippocampal neurons from WT and MECP2Tg3 mice infected with a nontargeting scramble (SC) AAV virus or AAV-shRNAs targeting TCF20 (n = 15 to 31, one-way ANOVA with post hoc Tukey’s tests). (E) Quantification of Tcf20 and Bdnf mRNA levels by qRT-PCR upon knockdown of Tcf20 in cultured hippocampal neurons from WT mice (n = 3, two-way ANOVA with post hoc Tukey’s tests). (F) ChIP with anti-TCF20 on cortex chromatin from WT mice. Three primer sets were used to amplify Bdnf promotor I, promoter IV, and an intergenic region as negative control (NC) (n = 3 per group, one-way ANOVA with post hoc Tukey’s tests). *P < 0.05, **P < 0.01, ***P < 0.001, ****P < 0.0001; data are mean ± SEM.
Fig. 4.
Fig. 4.
Haploinsufficiency in Tcf20 results in learning and memory deficits and autism-like phenotypes in mice. (A) Representative immunoblot (Left) and quantification (Right) of TCF20 protein levels in the cortex (CTX) and hippocampus (Hippo) from WT and Tcf20+/− mice (n = 3 per group, two-way ANOVA with post hoc Tukey’s tests). (B, Left) A photograph showing the body size of WT and Tcf20+/− mice at 8 mo of age. (Right) Body weights of WT and Tcf20+/− mice over the course of 24 wk. (For males, WT, n = 22, Tcf20+/−, n = 17; for females, WT, n = 21, Tcf20+/−, n = 14; two-way ANOVA with post hoc Tukey’s tests.) (C) Brain weights of adult WT and Tcf20+/− mice after being normalized to body weights. (For males, WT, n = 10, Tcf20+/−, n = 10; for females, WT, n = 9, Tcf20+/−, n = 10; unpaired two-tailed Student’s t test.) (D) Statistical analysis of open field test for WT and Tcf20+/− male mice. (Left) Total mouse movement in 30 min; (Center) time spent in the center area; (Right) time spent for vertical exploring (rearing) (WT, n = 35, Tcf20+/−, n = 29; unpaired two-tailed Student’s t test). (E) Statistical analysis of time spent in the open arm for WT and Tcf20+/− male mice in the elevated plus maze (WT, n = 28, Tcf20+/−, n = 27; unpaired two-tailed Student’s t test). (F) Statistical analysis of light–dark box test for WT and Tcf20+/− male mice. (Left) Time spent in the light side; (Right) the number of transitions between the two compartments (WT, n = 10, Tcf20+/−, n = 11; unpaired two-tailed Student’s t test). (G) Statistical analysis of Barnes maze for WT and Tcf20+/− male mice. (Left) Time spent to locate the escape hole during 4 d of training; (Center) time spent in the probe (escape hole) area during the test day; (Right) latency to first enter the escape hole during the test day (WT, n = 22, Tcf20+/−, n = 23, two-way ANOVA with post hoc Tukey’s tests for training, unpaired two-tailed Student’s t test for probe test). (H) Percentage of wins in test pairs between WT and Tcf20+/− male mice in the tube test (n = 51 matches, two-tailed binomial test). *P < 0.05, **P < 0.01, ***P < 0.001, ****P < 0.0001; data are mean ± SEM.
Fig. 5.
Fig. 5.
MeCP2 and TCF20 share common downstream neuronal genes and pathways. (A) Venn diagrams showing DEGs common to Tcf20+/− and Mecp2–/y mouse models; (Left) all DEGs; (Center) up-regulated DEGs; (Right) down-regulated DEGs (full lists of Tcf20+/− and Mecp2–/y DEGs are given in Datasets S2 and S3, respectively). The percentage rate indicates the ratio of the number of overlapped DEGs to the number of Tcf20+/− DEGs. (B) Scatter plot showing log2 fold-change for overlapped DEGs in Tcf20+/− vs. Mecp2–/y mouse models. Majority of the DEGs common to Tcf20+/− and Mecp2–/y mouse models changed in the same direction. (C) Coexpression networks of the down- (Left, blue) and up-regulated (Right, red) overlapped genes between Tcf20+/− and Mecp2–/y mouse models. Colored ellipses indicate the enriched gene ontology terms or pathways in each network. Node size is proportional to coexpression degree. Node color reflects log2 fold-change in Tcf20+/− mice.
Fig. 6.
Fig. 6.
Genetic reduction of Tcf20 improves behavioral deficits in MECP2 duplication mice. (A) Statistical analysis of open field test showing time spent in the center area for mice with the indicated genotypes (n = 21 to 29 per genotype, one-way ANOVA with post hoc Tukey’s tests). (B) Statistical analysis of light–dark box test for mice with the indicated genotypes (n = 9 to 17 per genotype, one-way ANOVA with post hoc Tukey’s tests). (C) Altered learning and memory in conditioned fear test for mice with the indicated genotypes (n = 19 to 26 per genotype, one-way ANOVA with post hoc Tukey’s tests). (D) Statistical analysis of three-chamber test for mice with the indicated genotypes. (Left) Time the mice stay in chambers with the partner mouse or with the inanimate object; (Right) time the mice spent interacting with the partner mouse (n = 16 to 27 per genotype). (Left) Two-way ANOVA with post hoc Tukey’s tests; (Right) one-way ANOVA with post hoc Tukey’s tests. (E) Representative immunoblot (Left) and quantification (Right) of TCF20, PHF14 following IP using antibodies to MeCP2 from mouse cortex of each genotype. Mecp2–/y as negative controls. The ratio of co-IP TCF20 and PHF14 from each indicated genotypes to that of WT is calculated as fold-change (n = 4 per group, one-way ANOVA with post hoc Tukey’s tests) *P < 0.05, **P < 0.01, ***P < 0.001, ****P < 0.0001; data are mean ± SEM. ns, not significant.
Fig. 7.
Fig. 7.
A PHF14 mutation that disrupts the interaction of MeCP2 and TCF20 complex is associated with a human neurodevelopmental syndrome similar to RTT. (A) Diagram of PHF14 gene and PHF14 protein domains with the mutations currently identified. PHD, plant homeodomain finger domain; CC, Coiled-coil domain. A red bar above the protein structure indicates the domain on PHF14 that interacts with MeCP2. (B) ClustalW multispecies alignment obtained with the region containing C322G, yellow bar showing the high level of conservation of the mutated residue. (C) Representative immunoblot (Left) and quantification (Right) of Flag-tagged PHF14-WT and PHF14-C322G following IP of endogenous MeCP2 in HEK293T cells (n = 3 per group, unpaired two-tailed Student’s t test). (D) Representative immunoblot (Left) and quantification (Right) of TCF20 following IP of Flag-tagged PHF14-WT and PHF14-C322G in HEK293T cells (n = 3 per group, unpaired two-tailed Student’s t test). (E) Representative immunocytochemical images in mouse 3T3 fibroblasts showing the localization of Flag-tagged PHF14-WT and PHF14-C322G relative to densely methylated heterochromatic foci (stained by DAPI) upon overexpression of MeCP2-GFP and GFP only as controls. (Scale bar, 10 µm.) (F) Schematic overview of the proposed model of MeCP2 and the TCF20 complex interaction. In wild-type brains, MeCP2 recruits the TCF20 complexes by binding to PHF14 to coregulate gene expression. Patient mutation (C322G) in the PHD1-2 domain of PHF14 disrupted the interaction between MeCP2 and PHF14 and also prevent the assembly of the TCF20 complex, potentially leading to dysregulation of downstream genes and RTT-like symptoms in the patient. ****P < 0.0001; data are mean ± SEM.

References

    1. Zablotsky B., et al. , Prevalence and trends of developmental disabilities among children in the United States: 2009–2017. Pediatrics 144, e20190811 (2019). - PMC - PubMed
    1. Satterstrom F. K., et al. ; Autism Sequencing Consortium; iPSYCH-Broad Consortium, Large-scale exome sequencing study implicates both developmental and functional changes in the neurobiology of autism. Cell 180, 568–584.e23 (2020). - PMC - PubMed
    1. McRae J. F., et al. ; Deciphering Developmental Disorders Study, Prevalence and architecture of de novo mutations in developmental disorders. Nature 542, 433–438 (2017). - PMC - PubMed
    1. Sakai Y., et al. , Protein interactome reveals converging molecular pathways among autism disorders. Sci. Transl. Med. 3, 86ra49 (2011). - PMC - PubMed
    1. Amir R. E., et al. , Rett syndrome is caused by mutations in X-linked MECP2, encoding methyl-CpG-binding protein 2. Nat. Genet. 23, 185–188 (1999). - PubMed

Publication types

MeSH terms