. 2022 Jan 25;119(4):e2100679119.
doi: 10.1073/pnas.2100679119.

Mechanical disruption of E-cadherin complexes with epidermal growth factor receptor actuates growth factor-dependent signaling

Affiliations

Mechanical disruption of E-cadherin complexes with epidermal growth factor receptor actuates growth factor-dependent signaling

Brendan Sullivan et al. Proc Natl Acad Sci U S A. .

Abstract

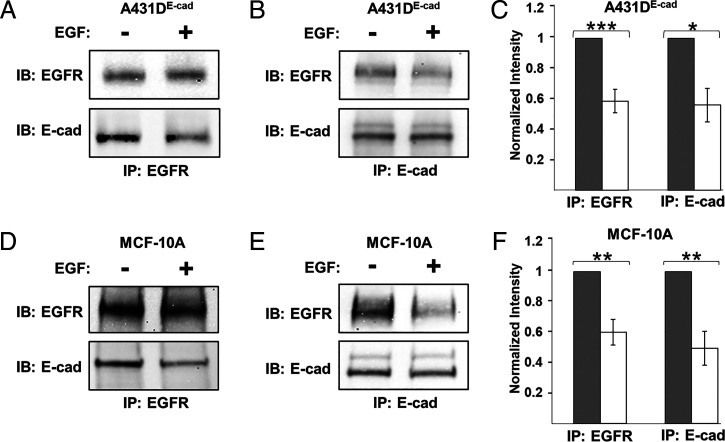
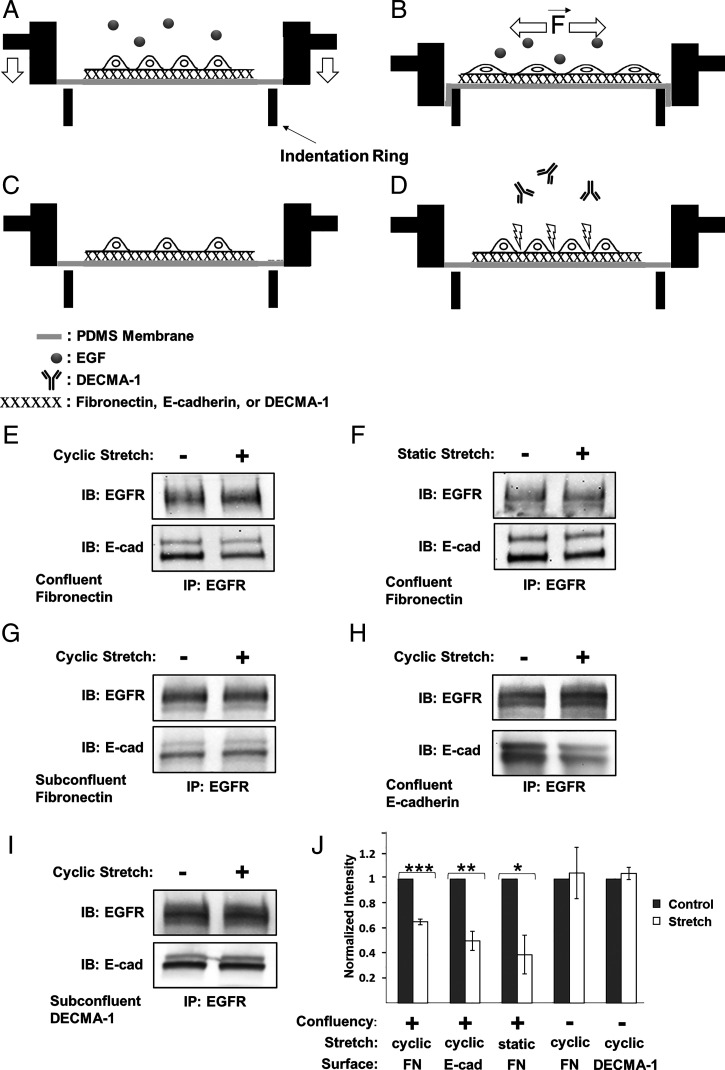
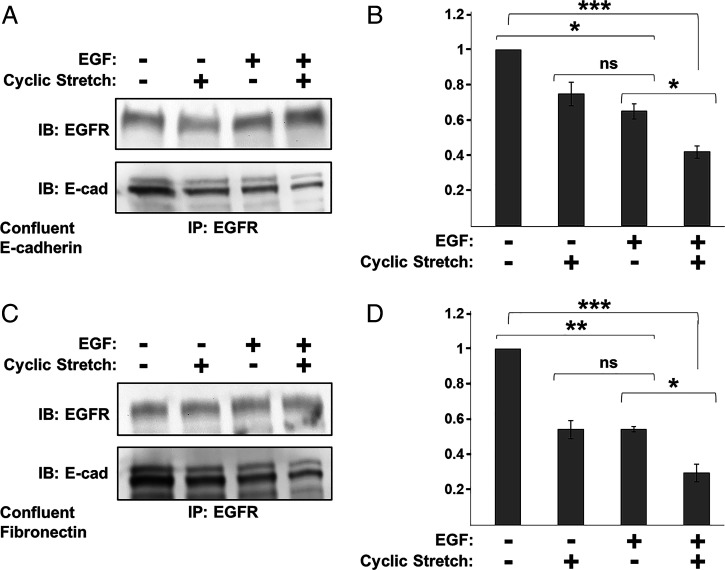
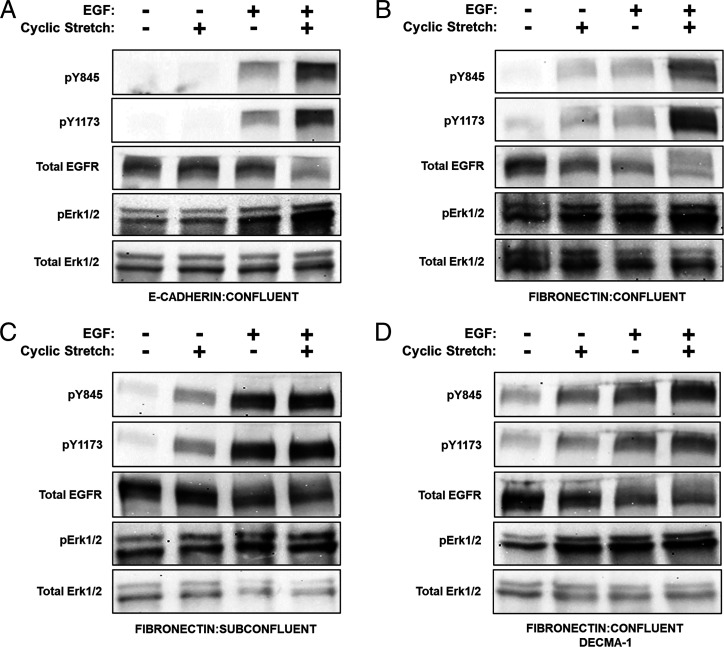
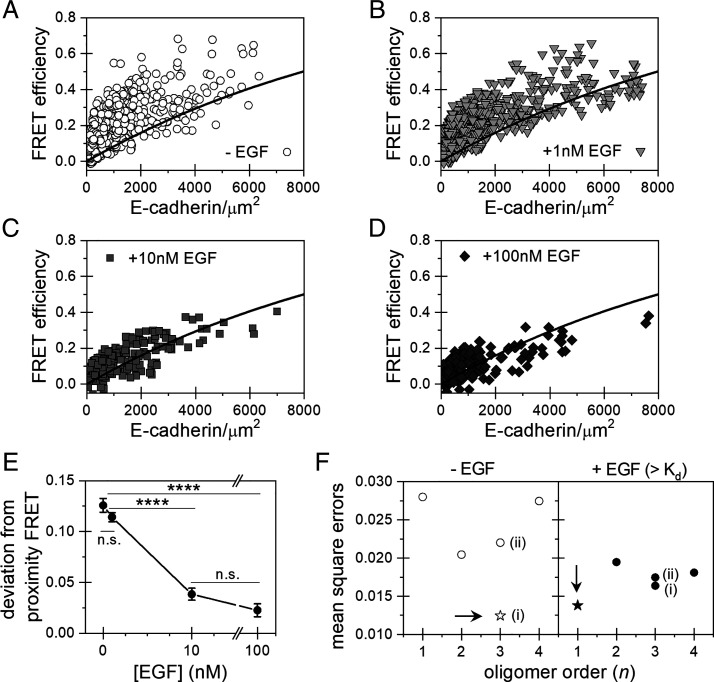
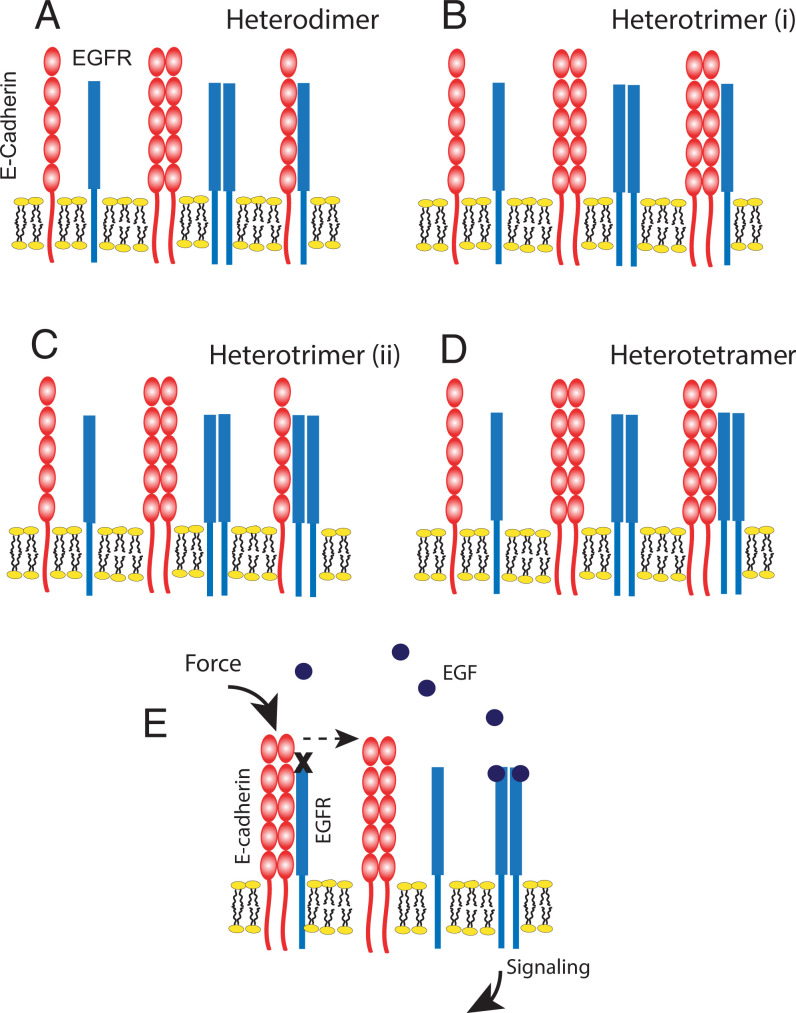
Increased intercellular tension is associated with enhanced cell proliferation and tissue growth. Here, we present evidence for a force-transduction mechanism that links mechanical perturbations of epithelial (E)-cadherin (CDH1) receptors to the force-dependent activation of epidermal growth factor receptor (EGFR, ERBB1)-a key regulator of cell proliferation. Here, coimmunoprecipitation studies first show that E-cadherin and EGFR form complexes at the plasma membrane that are disrupted by either epidermal growth factor (EGF) or increased tension on homophilic E-cadherin bonds. Although force on E-cadherin bonds disrupts the complex in the absence of EGF, soluble EGF is required to mechanically activate EGFR at cadherin adhesions. Fully quantified spectral imaging fluorescence resonance energy transfer further revealed that E-cadherin and EGFR directly associate to form a heterotrimeric complex of two cadherins and one EGFR protein. Together, these results support a model in which the tugging forces on homophilic E-cadherin bonds trigger force-activated signaling by releasing EGFR monomers to dimerize, bind EGF ligand, and signal. These findings reveal the initial steps in E-cadherin-mediated force transduction that directly link intercellular force fluctuations to the activation of growth regulatory signaling cascades.

Keywords: FRET; MAPK; cadherin; epidermal growth factor receptor; mechanotransduction.


Conflict of interest statement

The authors declare no competing interest.

Figures

Fig. 1.
Fig. 1.
Soluble EGF disrupts E-cadherin/EGFR complexes. (A and B) Co-IP results of EGFR and E-cadherin obtained with A-431DE-cad monolayers. Cells were seeded on PDMS membranes coated with fibronectin and cultured in reduced serum (0.5 vol%) for 24 h prior to treatment with 20 nM EGF for 15 min. Controls were not treated with EGF. Lysates were pulled down with (A) anti-EGFR antibody or (B) anti–E-cadherin and probed for respectively, E-cadherin or EGFR. (C) Quantified, normalized band intensities obtained under conditions in panel A (n = 4) and panel B (n = 3). Results were normalized by the band intensities in untreated samples. (D and E) Co-IP measurements of MCF-10A monolayers. Immunoprecipitation was done with either (D) anti-EGFR or (E) anti–E-cadherin antibody. (F) Band intensities, normalized as in panel C, were determined for anti-EGFR (n = 3) and anti-E-cadherin (n = 4) pulldowns. Error bars are SEM. *P < 0.05, **P < 0.005, ***P < 0.0005.
Fig. 2.
Fig. 2.
Mechanically perturbing E-cadherin receptors disrupts E-cadherin/EGFR complexes, independent of EGF. (AD) Experimental stretcher design and configurations used to apply equibiaxial strain to cells. (A and B) Confluent monolayers are cultured on PDMS membranes coated with either fibronectin, E-cad-Fc, or DECMA-1. Studies are done in the absence or presence of soluble EGF. (B) Membranes and overlying cell layers are stretched by pulling the membrane over an indenter ring (74). Other configurations used include (C) subconfluent cells on protein-coated membranes or (D) confluent monolayers on fibronectin, treated with E-cadherin blocking antibody, DECMA-1. Panels EI, were obtained with serum-starved A-431DE-cad cells treated with neutralizing anti-EGF antibody prior to applying 10% strain for 30 min. 16G3 antibody was added to all samples not seeded on fibronectin. Co-IP results obtained with (E) cyclically or (F) statically stretched confluent cell monolayers on fibronectin. (G) Co-IP results for cyclically stretched subconfluent culture on fibronectin. (H) Co-IP results of cyclically stretched confluent cells on E-cad-Fc–coated PDMS membranes. (I) Co-IP measurements done with subconfluent cells on DECMA-1–coated membranes (J) Normalized E-cadherin band intensities measured following cyclic (n = 4) or static (n = 3) monolayer stretching on fibronectin or E-cad-Fc (n = 3)–coated membranes. Cyclically stretched subconfluent A-431DE-cad cells seeded on fibronectin (n = 3) or DECMA-1 (n = 4) are also included. The band intensities are normalized by the EGFR band intensities of untreated cells (gray bars). The white bars indicate the normalized Co-IP data from stretched cells. Error bars are SEM. *P = 0.05, **P = 0.005, ***P = 0.0005.
Fig. 3.
Fig. 3.
EGF and cyclic stretch cooperate to disrupt E-cadherin/EGFR complexes. Co-IP results obtained with 24 h serum-starved confluent A-431DE-cad monolayers subjected to four conditions: ±3 nM EGF and ±10% cyclic stretch for 30 min. EGF-neutralizing antibody was added to all samples not treated with EGF. (A) Co-IP results for monolayers seeded on E-cad-Fc–coated PDMS membranes for 5 h in the presence of 16G3 antibody. (B) Normalized E-cadherin band intensities obtained from Co-IP measurements in panel A (n = 3). (C) Co-IP results obtained with confluent A-431DE-cad cells on fibronectin-coated PDMS. (D) Normalized E-cadherin band intensities for measurements shown in C (n = 3). Error bars are SEM. *P < 0.05, **P < 0.005, ***P < 0.0005.
Fig. 4.
Fig. 4.
E-cadherin and integrins cooperate to activate EGFR and downstream Erk1/2 in mechanically perturbed epithelia. In panels AD, cells were subjected to four conditions: ±10% cyclic stretch and ±3 nM EGF for 30 min followed by Western blot analysis of pY845, pY1173, total EGFR, pErk1/2, and total Erk1/2. Cells were serum starved overnight, and EGF-neutralizing antibody was applied to all non–EGF-treated samples. (A) A-431DE-cad cells were plated at monolayer density on E-cad-Fc–coated PDMS membranes and allowed to attach for 5 h in the presence of 16G3 antibody. (B) A-431DE-cad cells seeded on fibronectin-coated PDMS membranes at confluent density. (C) A-431DE-cad cells were plated on fibronectin-coated PDMS membranes for 5 h at subconfluent cell density to prevent cell–cell contacts. (D) Confluent A-431DE-cad monolayers on fibronectin-coated PDMS membranes at monolayer density were serum starved overnight. Cells were treated with DECMA-1 for 30 min to disrupt cell–cell junctions.
Fig. 5.
Fig. 5.
FSI-FRET measurements of E-cadherin interactions with EGFR, in the absence and presence of different concentrations of EGF. (AD) Plot of the E-cadherin/EGFR FRET efficiencies versus surface E-cadherin concentrations in the absence (A) or presence of (B) 1 nM, (C) 10 nM, (D) or 100 nM of EGF. The black curve is the proximity FRET void of specific interactions (48). Data Above the line are indicative of direct receptor interactions. (E) The FRET efficiencies were corrected for the contribution of the modeled proximity FRET and represented as the deviation from the proximity FRET. The deviations from the proximity FRET were calculated and plotted as histograms (SI Appendix, Fig. S8). The mean values and SEs are plotted as a function of EGF concentration. Errors that are not visible are smaller than the size of the symbol. Significance was calculated by ANOVA. (****P < 0.0001 and n.s., P ≥ 0.05). (F) MSEs calculated by comparing various hetero-oligomerization models with the FRET data. The model which minimizes the MSE is the most probable complex size and stoichiometry, indicated as a star and by an arrow. The two different heterotrimer models are (i) one EGFR and two E-cadherin or (ii) two EGFR and one E-cadherin.
Fig. 6.
Fig. 6.
Cartoon representations of the hetero-interaction models considered for the E-cadherin/EGFR complex and proposed mechanism of force-activated EGFR signaling. (A) Heterodimer model consisting of one E-cadherin and one EGFR molecule. (B) Heterotrimer (i) model consisting of two E-cadherins and one EGFR. (C) Heterotrimer (ii) model consisting of one E-cadherin and two EGFR molecules. (D) Heterotetramer model consisting of two E-cadherin and two EGFR molecules. (E) Proposed model of E-cadherin/EGFR complex formation and EGFR activation by mechanically perturbing E-cadherin receptors. E-cadherin homodimers sequester EGFR monomers at the plasma membrane. Applied force on homophilic E-cadherin bonds triggers EGFR dissociation and frees EGFR monomers to dimerize, bind EGF ligand, and signal. Soluble EGF can also disrupt the complex by shifting the equilibrium in favor of the more stable, ligand-bound EGFR state.

Similar articles

Cited by

References

    1. Marsden M., DeSimone D. W., Integrin-ECM interactions regulate cadherin-dependent cell adhesion and are required for convergent extension in Xenopus. Curr. Biol. 13, 1182–1191 (2003). - PubMed
    1. Hayashi T., Carthew R. W., Surface mechanics mediate pattern formation in the developing retina. Nature 431, 647–652 (2004). - PubMed
    1. Humphrey J. D., Dufresne E. R., Schwartz M. A., Mechanotransduction and extracellular matrix homeostasis. Nat. Rev. Mol. Cell Biol. 15, 802–812 (2014). - PMC - PubMed
    1. Huynh J., et al. , Age-related intimal stiffening enhances endothelial permeability and leukocyte transmigration. Sci. Transl. Med. 3, 112ra122 (2011). - PMC - PubMed
    1. Tzima E., et al. , A mechanosensory complex that mediates the endothelial cell response to fluid shear stress. Nature 437, 426–431 (2005). - PubMed

Publication types

MeSH terms