. 2022 Jan 24;7(1):22.
doi: 10.1038/s41392-022-00878-3.

SARS-CoV-2 NSP5 and N protein counteract the RIG-I signaling pathway by suppressing the formation of stress granules

Affiliations

SARS-CoV-2 NSP5 and N protein counteract the RIG-I signaling pathway by suppressing the formation of stress granules

Yi Zheng et al. Signal Transduct Target Ther. .

Abstract

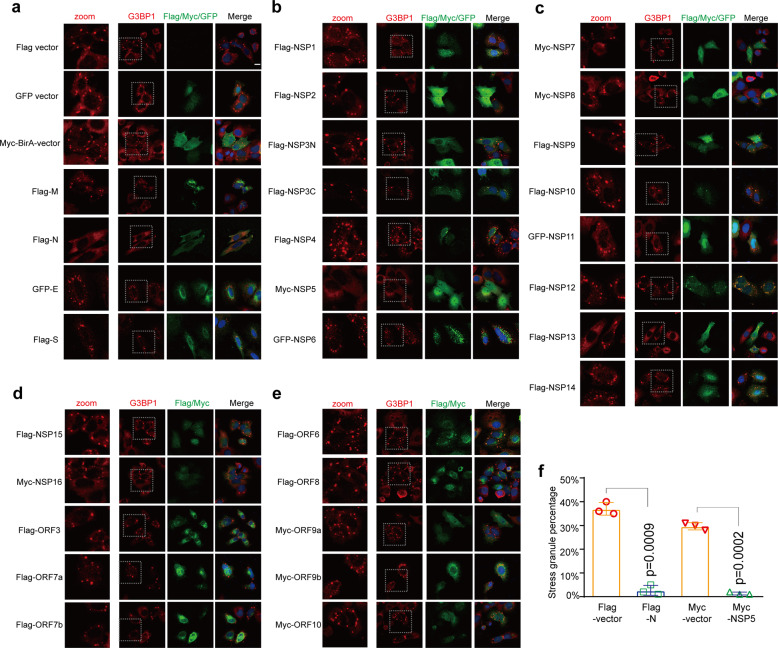
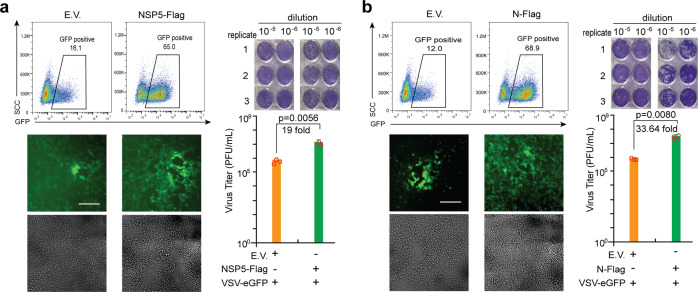
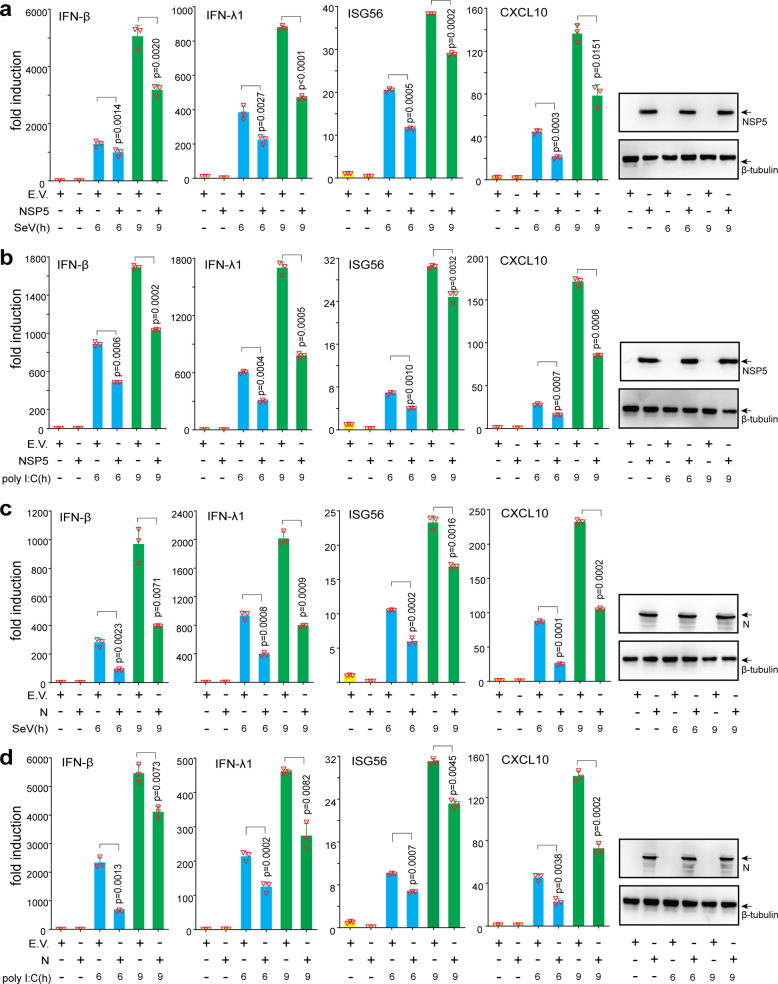
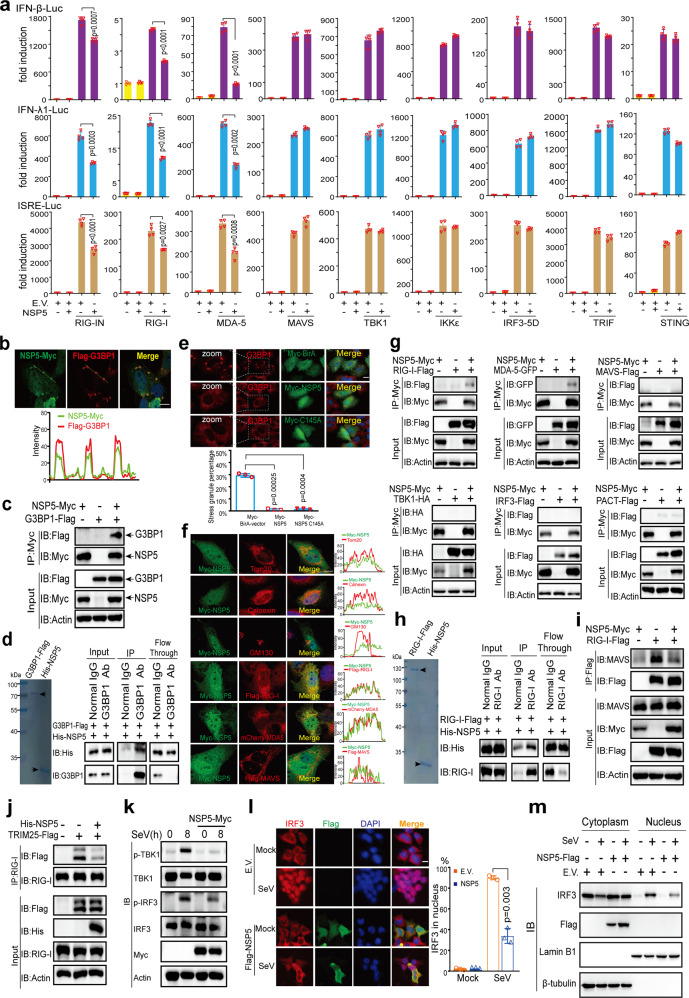
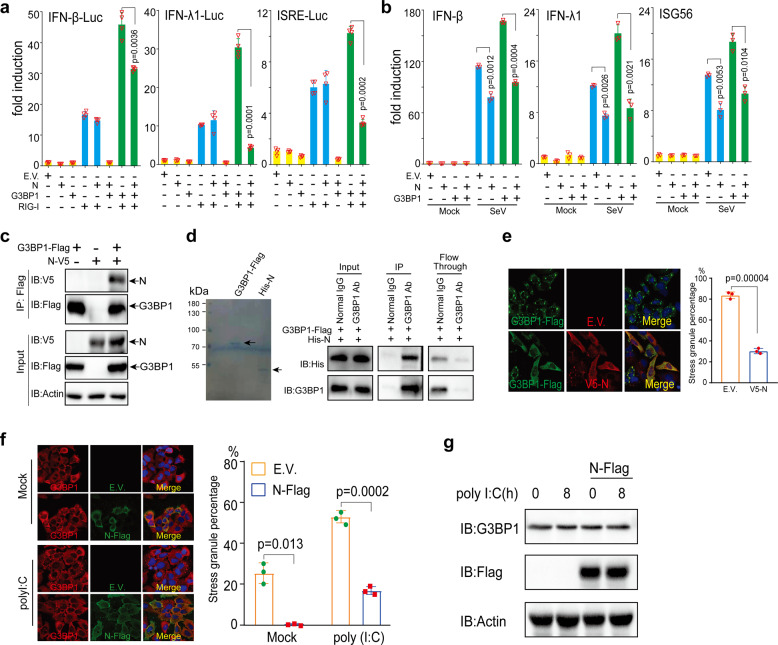
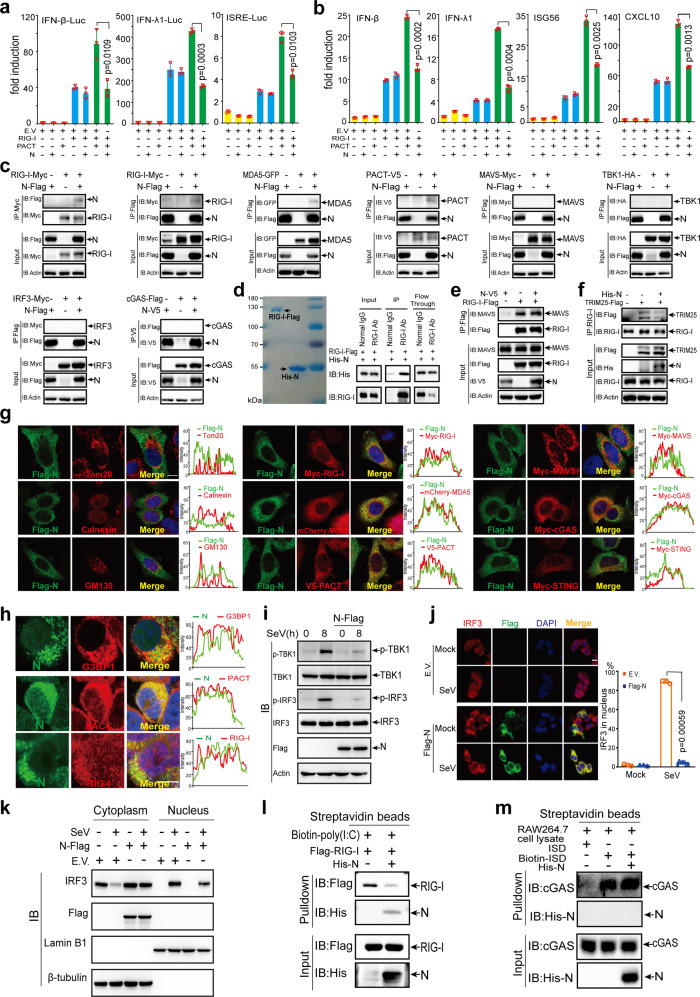
As a highly pathogenic human coronavirus, SARS-CoV-2 has to counteract an intricate network of antiviral host responses to establish infection and spread. The nucleic acid-induced stress response is an essential component of antiviral defense and is closely related to antiviral innate immunity. However, whether SARS-CoV-2 regulates the stress response pathway to achieve immune evasion remains elusive. In this study, SARS-CoV-2 NSP5 and N protein were found to attenuate antiviral stress granule (avSG) formation. Moreover, NSP5 and N suppressed IFN expression induced by infection of Sendai virus or transfection of a synthetic mimic of dsRNA, poly (I:C), inhibiting TBK1 and IRF3 phosphorylation, and restraining the nuclear translocalization of IRF3. Furthermore, HEK293T cells with ectopic expression of NSP5 or N protein were less resistant to vesicular stomatitis virus infection. Mechanistically, NSP5 suppressed avSG formation and disrupted RIG-I-MAVS complex to attenuate the RIG-I-mediated antiviral immunity. In contrast to the multiple targets of NSP5, the N protein specifically targeted cofactors upstream of RIG-I. The N protein interacted with G3BP1 to prevent avSG formation and to keep the cofactors G3BP1 and PACT from activating RIG-I. Additionally, the N protein also affected the recognition of dsRNA by RIG-I. This study revealed the intimate correlation between SARS-CoV-2, the stress response, and innate antiviral immunity, shedding light on the pathogenic mechanism of COVID-19.


Conflict of interest statement

The authors declare no competing interests.

Figures

Fig. 1
Fig. 1
SARS-CoV-2 NSP5 and N inhibit avSG formation. ae HeLa cells seeded on coverslips in 12-well plates (5 × 104 cells per well) were transfected with an empty vector as a control or a plasmid expressing each viral protein as indicated. Each plasmid was transfected with 1.5 µg per well. Twenty-four hours after transfection, the cells were subjected to fixation, permeabilization, and blocking as described in the Methods section. The cells were further stained with antibodies as indicated. Scale bar, 10 μm. f The percentage of cells with SGs was quantified in the N and NSP5 groups and their corresponding control groups (N = 200)
Fig. 2
Fig. 2
SARS-CoV-2 NSP5 and N facilitate viral replication. The HEK293T cells were subjected to transfection with empty vector (E.V.), NSP5 (a)-, or N (b)-expressing plasmids as indicated for 24 h. The cells were subsequently infected with VSV-eGFP (MOI = 0.001) for 12 h before imaging and flow cytometry analysis. The culture supernatant collected at 20 h postinfection was used to determine viral titers (PFU per mL) via plaque assays. The fluorescent imaging and flow cytometry data are representative of two independently performed experiments with similar results. Scale bar, 50 μm. In plaque assays, data are presented as mean values ± SEM from triplicate infections from one representative experiment of two. Statistical significance is shown as indicated. EV empty vector, h hours, PFU plaque-forming units.
Fig. 3
Fig. 3
NSP5 and N proteins inhibit IFN production. A549 cells were transfected with plasmids of empty vector, NSP5 (a and b), or N protein (c and d) as indicated, 24 h later. the cells were further stimulated with SeV (a and c) or poly (I:C) (b and d). At the indicated time points, cells were collected for RT-qPCR analysis to determine the relative expression levels of target genes normalized by GAPDH. Data are presented as mean values ± SEM from three biological replicates from one representative experiment of two. EV empty vector, h hours.
Fig. 4
Fig. 4
NSP5 inhibits RLR-induced IFN activation. a IFN-β, IFN-λ1, or ISRE luciferase reporters and protein-expressing plasmids were transfected into HEK293T cells as indicated. pRL-TK plasmid was transfected to normalize transfection efficiency. After transfection for 36 h, the cells were lysed to examine the luciferase activities by dual-luciferase assays. b NSP5 colocalizes with SG marker G3BP1. Top panel: Representative confocal images of NSP5-Myc colocalization with G3BP1-Flag in HeLa cells. Scale bar, 10 µm. Bottom panel: Line profiling of NSP5-Myc with G3BP1-Flag. The intensity of each line was measured by ImageJ software and drawn by GraphPad Prism 8.0. c Co-IP analysis of the interaction between NSP5-Myc and G3BP1-Flag in HEK293T cells. HEK293T cells were transfected with the indicated plasmids for 24 h before co-IP with Myc antibody. Results shown are representative of two independent experiments. d NSP5 directly binds to G3BP1. Left panel: Coomassie blue staining analysis of the purified G3BP1-Flag and His-NSP5 proteins. Right panel: Co-IP analysis of the in vitro interaction between G3BP1-Flag and His-NSP5. e NSP5 inhibits SG formation induced by plasmid transfection. Top panel: Confocal microscopic analysis of SG formation in HeLa cells transfected with plasmids of Myc-BirA (control group), Myc-NSP5, or Myc-NSP5 C145A for 24 h. Scale bars, 10 μm. Bottom panel: Quantification analysis of the percentage of SG formation (50 cells per sample). f NSP5 colocalizes with RIG-I and MDA5. Representative confocal images of immunofluorescence staining for NSP5-Myc with the indicated organelles or signaling molecules in HeLa cells. Scale bar, 10 µm. Tom20, mitochondrial marker; Calnexin, ER marker; GM130, Golgi marker. g-i NSP5 interacts with RLRs and prevents the interaction of RIG-I and MAVS. g NSP5 interacts with RIG-I and MDA5 but not with MAVS, TBK1, IRF3, or PACT. HEK293T cells were transfected with the indicated plasmids for 24 h before coimmunoprecipitation. The input and immunoprecipitates were immunoblotted with the indicated antibodies. The pcDNA6B vector was used to balance the total amount of DNA in each transfection. Immunoblotting results are representative of two independent experiments. h NSP5 directly binds to RIG-I. Left panel: Coomassie blue staining analysis of the purified RIG-I-Flag and His-NSP5 proteins. Right panel: Co-IP analysis of the in vitro interaction between RIG-I-Flag and His-NSP5. i and j NSP5 impairs the RIG-I–MAVS and RIG-I–TRIM25 interactions. HEK293T cells were transfected with the indicated plasmids for 24 h. Coimmunoprecipitation and immunoblot analyses were performed with the indicated antibodies. k NSP5 inhibits the phosphorylation of TBK1 and IRF3 induced by SeV infection. HeLa cells were transfected with NSP5-expressing plasmids and subsequently infected with SeV as indicated. The expression of total and phosphorylated (p-) TBK1, total and phosphorylated (p-) IRF3, and NSP5 was detected by immunoblotting. l and m NSP5 prevents the nuclear translocation of IRF3. l Left panel: Confocal microscopic analysis of IRF3 localization in HEK293T cells transfected with an empty vector or NSP5-expressing plasmid for 24 h, followed by SeV infection. Scale bars, 10 μm. Right panel: Quantification analysis of IRF3 nuclear localization (50 cells per sample). m Immunoblot analysis of cytoplasmic and nuclear IRF3. HEK293T cells were transfected with an empty vector or NSP5-expression plasmid. Twenty-four hours later, the cells were infected with SeV for 6 h and the cytoplasmic and nuclear proteins were fractionated. The fractions were immunoblotted with antibodies of IRF3, NSP5, Lamin B1 (nuclear marker), and β-tubulin (cytoplasmic marker). EV empty vector, h hours.
Fig. 5
Fig. 5
N protein inhibits G3BP1-mediated RIG-I signaling activation by suppressing SG formation. a and b N protein inhibits G3BP1-mediated RIG-I signaling activation. Thirty-six hours after transfection into HEK293T cells with indicated plasmids, the luciferase activities were measured using dual-luciferase assays (a). Twenty-four hours after transfection, HEK293T cells were infected with SeV (b), and 6 h after infection, the cells were harvested to determine the induction of IFN-β, IFN-λ1, and ISG56 using RT-qPCR. c and d N protein interacts with G3BP1. Co-IP analysis of the interaction between N-V5 and G3BP1-Flag in HEK293T cells (c). d Left panel: Coomassie blue staining analysis of the purified G3BP1-Flag and His-N proteins. Right panel: Co-IP analysis of the in vitro interaction between His-N and G3BP1-Flag. e N protein inhibits G3BP1-induced SG formation. Left panel: Confocal microscopic analysis of SG formation in HeLa cells transfected with G3BP1-Flag together with empty vector or expression vector of N for 24 h. Scale bars, 10 μm. Right panel: Quantification analysis of the percentage of SG formation (50 cells per sample). f N protein inhibits poly (I:C)-induced SG formation. Left panel: Confocal microscopic analysis of SG formation in HeLa cells transfected with empty vector or expression vector of N for 24 h followed by stimulation with poly (I:C) for 0 or 8 h. Scale bars, 10 μm. Right panel: Quantification analysis of the percentage of SG formation (200 cells per sample). g N protein does not affect G3BP1 expression. HeLa cells were transfected with plasmids as indicated, 16 h later, the cells were further stimulated with poly (I:C) by transfection. The expression of G3BP1, N-Flag, and actin was detected by immunoblotting. EV empty vector, h hours.
Fig. 6
Fig. 6
N protein prevents PACT-induced RIG-I signaling activation. a and b N protein inhibits PACT-mediated RIG-I signaling activation. IFN-β, IFN-λ1, or ISRE luciferase reporters and protein-expressing plasmids were transfected into HEK293T cells as indicated. Thirty-six hours after transfection (a), dual-luciferase assay was used to measure the luciferase activities. Forty-eight hours after transfection (b), the cells were harvested to analyze the expression of IFN-β, IFN-λ1, ISG56, and CXCL10 using RT-qPCR. c The N protein interacts with RIG-I, MDA5, and PACT rather than with MAVS, TBK1, IRF3, or cGAS. Protein expression plasmids were transfected into HEK293T cells as indicated, 24 h later, the cells were lysed for co-IP. d N protein directly binds to RIG-I. Left panel: Coomassie blue staining analysis of the purified RIG-I-Flag and His-N proteins. Right panel: Co-IP analysis of the in vitro interaction between RIG-I-Flag and His-N. e N protein does not affect RIG-I–MAVS interaction using co-IP assays in HEK293T cells. f N protein disrupts RIG-I–TRIM25 interaction. HEK293T cells were subjected to transfection with the protein expression plasmids as indicated, 24 h later, the cells were lysed for co-IP. g Representative confocal images of N protein with the indicated organelles or signaling molecules in HeLa cells. Scale bar, 10 µm. h Colocalization between endogenous N protein and signaling molecules. HEK293T cells were transfected with pBAC-nCoV-Replicon plasmid to obtain the endogenous expression of viral proteins for 24 h. Immunofluorescence staining was performed with antibodies as indicated. i N protein inhibits the phosphorylation of TBK1 and IRF3 induced by SeV infection. HeLa cells were transfected with empty vector or N protein-expressing plasmids; 16 h later, the cells were subsequently infected with SeV as indicated. The protein levels of total TBK1 and total IRF3 as well as phosphorylated (p-) TBK1, p-IRF3, and N protein were detected by immunoblotting. j and k N protein blocks SeV-induced IRF3 nuclear translocation. j Left panel: Confocal microscopic analysis of IRF3 localization in HEK293T cells transfected with empty vector or expression vector of N protein for 24 h, followed by SeV infection as indicated. Scale bars, 10 μm. Right panel: Quantification analysis of IRF3 nuclear localization (50 cells per sample). k IRF3 expression in the cytoplasmic and nuclear fractions. HEK293T cells were transfected with an empty vector or expression vector of N protein for 24 h followed by SeV infection for 6 h. Afterward, the cells were harvested and separated into cytoplasmic and nuclear portions. Each portion was analyzed by immunoblot for the detection of IRF3, N protein, Lamin B1 (nuclear marker), and β-tubulin (cytoplasmic marker). l N protein prevents poly (I:C) binding to RIG-I. Pulldown analysis of Flag-RIG-I from transfected HEK293T cells binding to poly (I:C) with or without N protein. m N protein does not affect the association between ISD and cGAS. Pulldown analysis of cGAS from RAW264.7 cells binding to ISD with or without the N protein. EV empty vector, h hours.

Similar articles

Cited by

References

    1. Akira S, Uematsu S, Takeuchi O. Pathogen recognition and innate immunity. Cell. 2006;124:783–801. doi: 10.1016/j.cell.2006.02.015. - DOI - PubMed
    1. Cai X, Chiu YH, Chen ZJ. The cGAS-cGAMP-STING pathway of cytosolic DNA sensing and signaling. Mol. Cell. 2014;54:289–296. doi: 10.1016/j.molcel.2014.03.040. - DOI - PubMed
    1. Belgnaoui SM, Paz S, Hiscott J. Orchestrating the interferon antiviral response through the mitochondrial antiviral signaling (MAVS) adapter. Curr. Opin. Immunol. 2011;23:564–572. doi: 10.1016/j.coi.2011.08.001. - DOI - PubMed
    1. Protter DSW, Parker R. Principles and Properties of Stress Granules. Trends Cell Biol. 2016;26:668–679. doi: 10.1016/j.tcb.2016.05.004. - DOI - PMC - PubMed
    1. Dalet A, Gatti E, Pierre P. Integration of PKR-dependent translation inhibition with innate immunity is required for a coordinated anti-viral response. FEBS Lett. 2015;589:1539–1545. doi: 10.1016/j.febslet.2015.05.006. - DOI - PubMed

Publication types

MeSH terms

LinkOut - more resources