. 2022 Jan 24;6(1):5.
doi: 10.1038/s41538-021-00120-4.

Cocoa bean fingerprinting via correlation networks

Affiliations

Cocoa bean fingerprinting via correlation networks

Santhust Kumar et al. NPJ Sci Food. .

Abstract

Cocoa products have a remarkable chemical and sensory complexity. However, in contrast to other fermentation processes in the food industry, cocoa bean fermentation is left essentially uncontrolled and is devoid of standardization. Questions of food authenticity and food quality are hence particularly challenging for cocoa. Here we provide an illustration how network science can support food fingerprinting and food authenticity research. Using a large dataset of 140 cocoa samples comprising three cocoa fermentation/processing stages and eight countries, we obtain correlation networks between the cocoa samples by computing measures of pairwise correlation from their liquid chromatography-mass spectrometry (LC-MS) profiles. We find that the topology of correlation networks derived from untargeted LC-MS profiles is indicative of the fermentation and processing stage as well as the origin country of cocoa samples. Progressively increasing the correlation threshold firstly reveals network clusters based on processing stage and later country-based clusters. We present both, qualitative and quantitative evidence through network visualization, network statistics and concepts from machine learning. In our view, this network-based approach for classifying mass spectrometry data has broad applicability beyond cocoa.


Conflict of interest statement

The authors declare no competing interests.

Figures

Fig. 1
Fig. 1. Schematic illustration of working procedure.
(a) Schematic of LC-MS data structure. Subset of real LC-MS dataset (compounds in rows, samples in columns): the darker the color of a box, the higher the concentration of the compound in the sample. In this schematic illustration a couple of samples from Ecuador and Brazil of unfermented and fermented categories are shown. (b) Schematic representation of correlation matrix. Spearman correlation between different samples. (c) Schematic of network generation. Correlation networks as a function of increasing correlation thresholds. An edge exists between two nodes only when the correlation between them is greater than or equal to some specified threshold.
Fig. 2
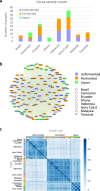
Fig. 2. Initial network details.
(a) Distribution of Cocoa samples used in this study—a total of eight countries and three cocoa processing stages are represented. Ivory Coast contributes most samples and Ghana the least. (b) Correlation Network. Full correlation network made using all correlations between the set of cocoa samples using Spearman correlation (i.e., at correlation threshold of zero). The nodes are color coded according to their processing-stage sample type and shape coded by their country of origin. The network is visualized using Cytoscape with ‘edge-weighted spring embedded layout’ which keeps nodes connected with higher correlations closer together. (c) Correlation Heatmap. Darker regions represent high correlation, and lighter regions represent low correlation. Samples have been sorted on twin axes, first on processing stage sample-type, and then second internally on country of origin. Two distinct square block regions are clearly visible along the diagonal of the matrix, corresponding to Unfermented (smaller block) and Fermented (bigger block) samples.
Fig. 3
Fig. 3. Network transformation as a function of varying correlation threshold.
(a) Processing-stage modules: modules of LC-MS samples belonging to the same cocoa processing-stage in a typical cocoa processing pipeline. (r~0.1) Mild separation of unfermented, fermented and liquor cluster; (r~0.4) modular structure improves; (r~0.5) groups of unfermented, fermented and liquor samples are clearly separated. The figure follows same legend as of Fig. 2b. See Supplementary Fig. 2 for a detailed version of networks and for a movie of evolving network as the correlation threshold is progressively increased. (b) Country modules: correlation thresholds of 0.6, 0.7 and 0.8. Several modules with nodes belonging to the same country of origin are revealed. For a quick and better comprehension, and unlike the legend of earlier correlation networks, in this figure, different countries are represented through a different color. (For corresponding node-labeled network see Supplementary Fig. 4. The networks with same thresholds but with previous node color/shape scheme is given in Supplementary Fig. 5) (c) Connected nodes’ similarity. The sample-type similarity (blue line) starts to increase linearly right from smaller correlation threshold values, reaches close to 1 around a correlation threshold value of 0.5. The origin similarity remains constant for a long range of correlation threshold (0, 0.50) and then increases rapidly. The dashed lines and error bars show corresponding similarities and standard deviation, respectively (see Similarity of nodes connected by an edge), as expected from an ensemble of control networks. (d) Accuracy of links in thresholded correlation networks, or closeness of a thresholded correlation network to expected ideal network. As the correlation threshold increases the threshold networks become closer to their ideal counterparts. (For an explanation of ‘accuracy’ through a toy-example, see Supplementary Fig. 10) In regions of lower correlation threshold, the thresholded networks describe the sample type character of the network more than the origin type character. In regions of higher correlation threshold, opposite is true and the thresholded networks are closer in their character to the origin attribute of LC-MS samples. This is coherent with the network pictures at various threshold seen in earlier figures.
Fig. 4
Fig. 4. Simple majority vote model to infer sample-type or origin of a node/sample.
(a) Sample-type. Prediction result for inference of sample-type of all nodes (vertical axis) at continuously increasing correlation thresholds (horizontal axis): green indicates correct prediction, yellow indicates false prediction. (b) Origin. Prediction result for inference of country of origin of all nodes. Note: (1) Only few sample names (not all) are shown on the vertical axis to avoid clutter, however all samples are represented in the heatmaps. (2) At high correlation thresholds corresponding networks become sparse thus loosing edges/nodes, hence, sample-type/origin inference for some nodes may not be possible. These are shown by white portion in the heatmaps. (c) Mean prediction score of sample-type and country of origin as a function of increasing correlation thresholds. It is evident that, on average, sample-type can be predicted correctly at mid and higher correlation thresholds, while origin is correctly predicted at higher correlation threshold regions.

References

    1. Ellis DI, et al. Fingerprinting food: current technologies for the detection of food adulteration and contamination. Chem. Soc. Rev. 2012;41:5706–5727. - PubMed
    1. Medina S, Pereira JA, Silva P, Perestrelo R, Câmara JS. Food fingerprints–A valuable tool to monitor food authenticity and safety. Food Chem. 2019;278:144–162. - PubMed
    1. Sobolev AP, Circi S, Capitani D, Ingallina C, Mannina L. Molecular fingerprinting of food authenticity. Curr. Opin. Food Sci. 2017;16:59–66.
    1. Kongor JE, et al. Factors influencing quality variation in cocoa (Theobroma cacao) bean flavour profile—A review. Food Res. Int. 2016;82:44–52.
    1. Medina S, Perestrelo R, Silva P, Pereira JAM, Câmara JS. Current trends and recent advances on food authenticity technologies and chemometric approaches. Trends Food Sci. Technol. 2019;85:163–176.