. 2022 Jan 24;8(1):33.
doi: 10.1038/s41420-022-00823-x.

MicroRNA-181a-2-3p shuttled by mesenchymal stem cell-secreted extracellular vesicles inhibits oxidative stress in Parkinson's disease by inhibiting EGR1 and NOX4

Affiliations

MicroRNA-181a-2-3p shuttled by mesenchymal stem cell-secreted extracellular vesicles inhibits oxidative stress in Parkinson's disease by inhibiting EGR1 and NOX4

Jianjun Ma et al. Cell Death Discov. .

Abstract

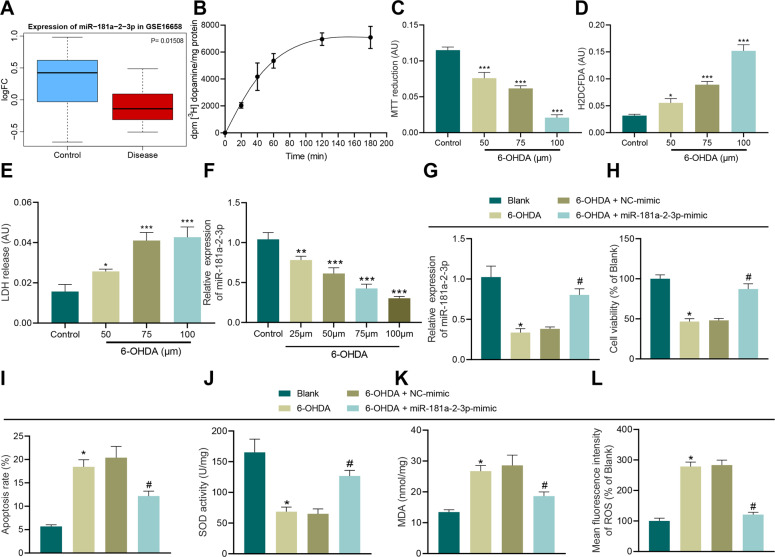
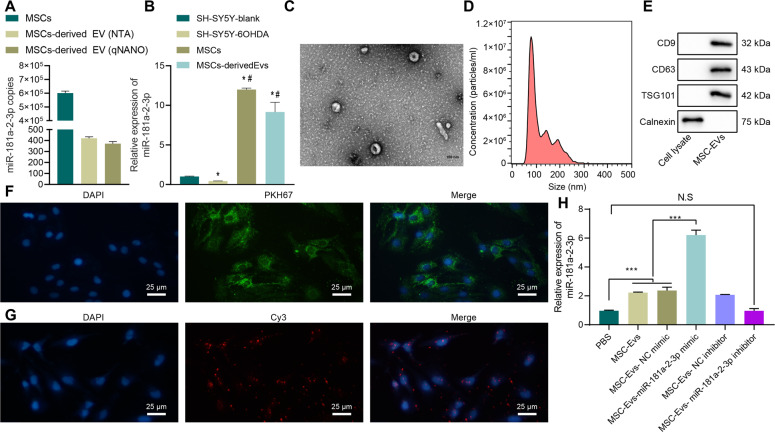
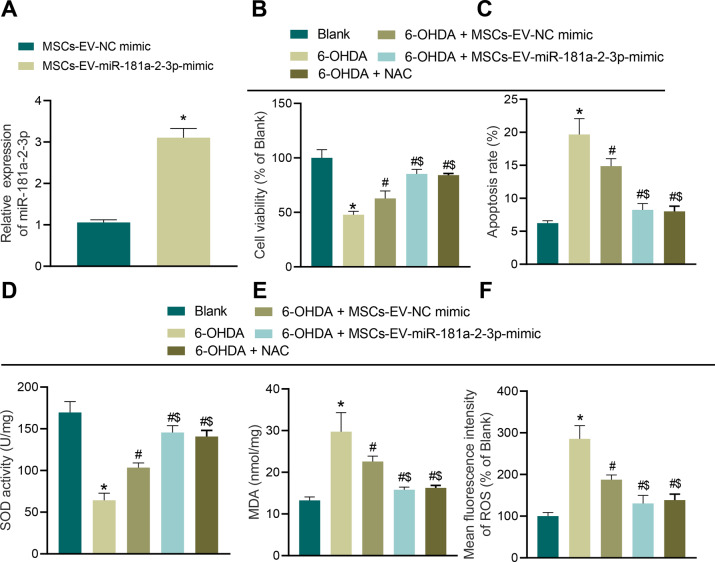
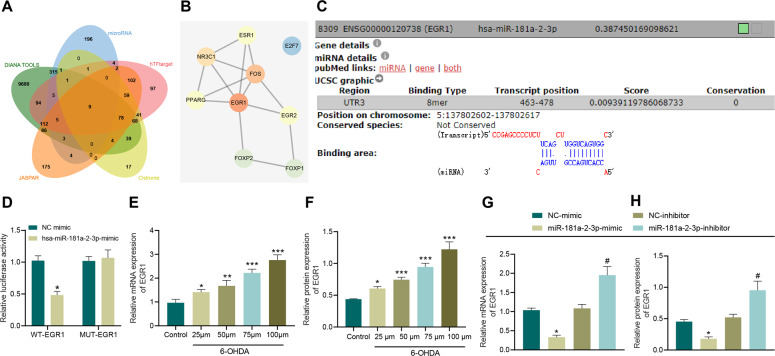
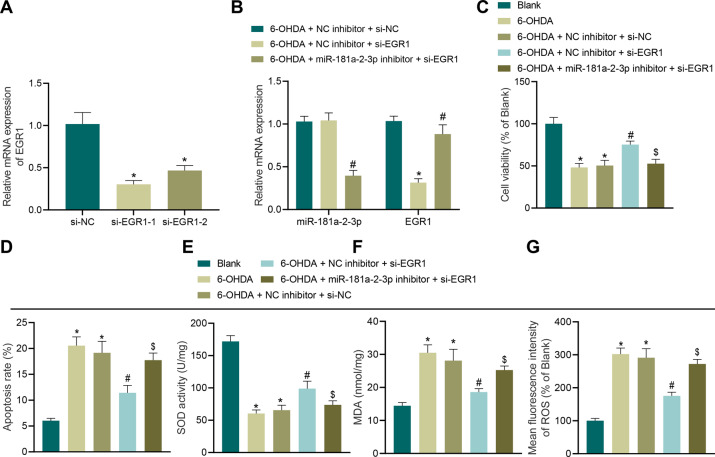
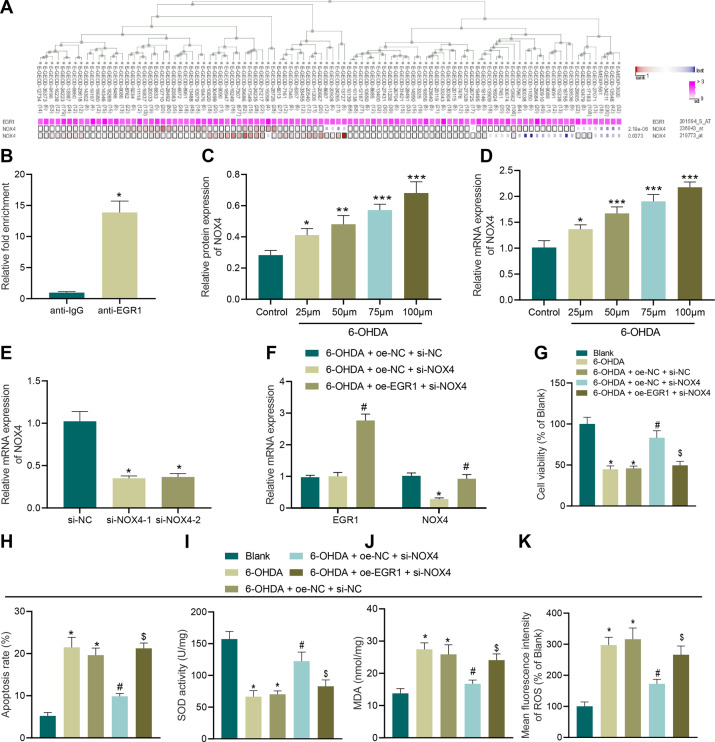
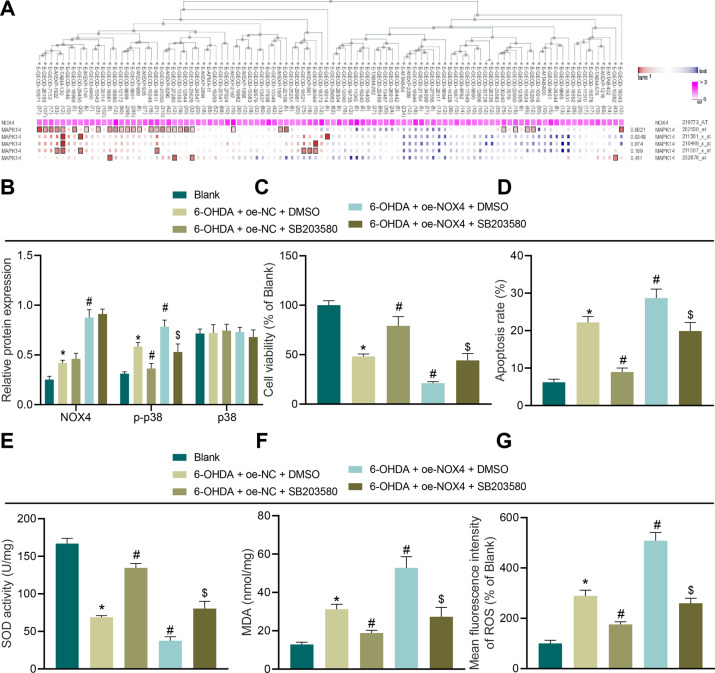
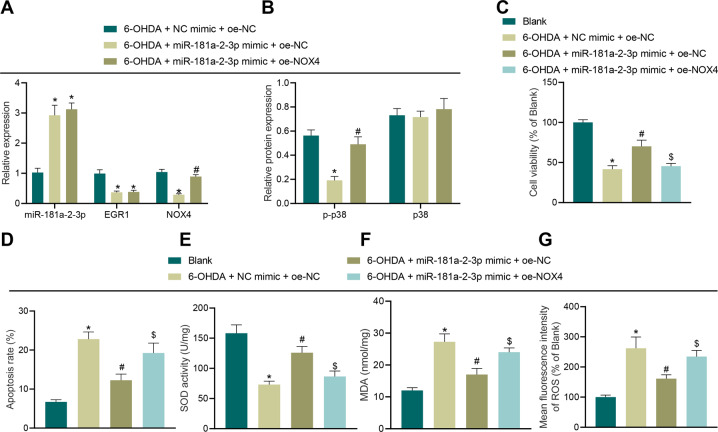
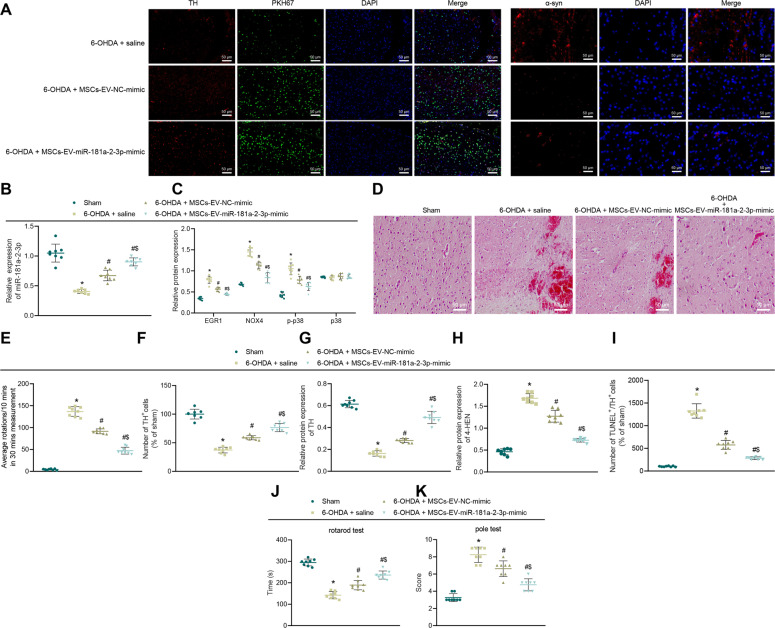
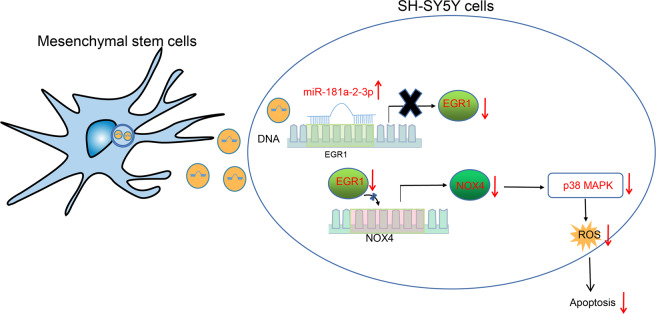
The current study investigated the physiological mechanisms by which extracellular vesicle (EV)-encapsulated miR-181a-2-3p derived from mesenchymal stem cells (MSCs) might mediate oxidative stress (OS) in Parkinson's disease (PD). First, 6-hydroxydopamine (6-OHDA)-induced PD cell and mouse models were established, after which miR-181a-2-3p, EGR1, and NOX4 expression patterns were determined in SH-SY5Y cells and substantia nigra (SN) of PD mice. Next, the binding affinity among miR-181a-2-3p, EGR1, and NOX4 was identified using multiple assays. Gain- or loss-of-function experiments were further adopted to detect SH-SY5Y cell proliferation and apoptosis and to measure the levels of SOD, MDA, and ROS. Finally, the effects of miR-181a-2-3p from MSC-derived EVs in PD mouse models were also explored. It was found that miR-181a-2-3p was poorly expressed in 6-OHDA-induced SH-SY5Y cells, whereas miR-181a-2-3p from MSCs could be transferred into SH-SY5Y cells via EVs. In addition, miR-181a-2-3p could target and inhibit EGR1, which promoted the expression of NOX4. The aforementioned miR-181a-2-3p shuttled by MSC-derived EVs facilitated SH-SY5Y proliferation and SOD levels, but suppressed apoptosis and MDA and ROS levels by regulating EGR1 via inhibition of NOX4/p38 MAPK, so as to repress OS of PD. Furthermore, in PD mice, miR-181a-2-3p was carried by EVs from MSCs to alleviate apoptosis of dopamine neurons and OS, accompanied by increased expressions of α-syn and decreased 4-HNE in SN tissues. Collectively, our findings revealed that MSC-derived EV-loaded miR-181a-2-3p downregulated EGR1 to inhibit OS via the NOX4/p38 MAPK axis in PD.


Conflict of interest statement

The authors declare no competing interests.

Figures

Fig. 1
Fig. 1. miR-181a–2–3p inhibits apoptosis and OS of SH-SY5Y cells.
A The box plot of miR-181a–2–3p in GSE16658, the blue box on the left indicated expression of normal samples, and the red box on the right indicates miR-181a–2–3p expression in PD patients. B Radioactive dopamine-uptake test. C Cell viability in SH-SY5Y cells treated with 6-OHDA determined with MTT assay. D Intracellular oxidation level evaluated after treatment with different drug concentrations. E LDH-release assay. F miR-181a-2-3p expression detected in SH-SY5Y cells treated with 6-OHDA for 24 h. G miR-181a–2–3p expression detected in 6-OHDA-induced SH-SY5Y cells using RT-qPCR. H SH-SY5Y cell proliferation detected using CCK-8 assay after 6-OHDA treatment. I Apoptosis of SH-SY5Y cells treated with 6-OHDA detected using flow cytometry. J SOD level in SH-SY5Y cells treated with 6-OHDA detected using SOD kit. K MDA level in SH-SY5Y cells treated with 6-OHDA detected using MDA kit. L ROS levels in SH-SY5Y cells treated with 6-OHDA detected using DCFH-DA fluorescent staining. *p < 0.05, **p < 0.01, ***p < 0.001 vs. control or SH-SY5Y cells without treatment. Cell experiments were repeated three times independently.
Fig. 2
Fig. 2. miR-181a–2–3p could be carried to SH-SY5Y cells through MSC–EVs.
A Abundance of miR-181a–2–3p in MSCs and MSC-derived EVs. B miR-181a–2–3p expression by RT-qPCR. C EVs observed under the TEM. D EV diameter detected using dynamic light scattering. E EV surface markers detected using Western blot. F Uptake of MSC–EV by SH-SY5Y cells detected using EV PKH67 tracing method. G Cy3-labeled miR-181a–2–3p entered SH-SY5Y cells via MSC–EV (200×). H miR-181a–2–3p expression in the SH-SY5Y cells. *p < 0.05 vs. SH-SY5Y blank, ***p < 0.001, NS insignificant difference. Cell experiments were repeated three times independently.
Fig. 3
Fig. 3. MSC–EVs carrying miR-181a–2–3p inhibit apoptosis and OS of SH-SY5Y cells.
A miR-181a–2–3p expression determined by RT-qPCR. B Cell proliferation in SH-SY5Y cells co-incubated with MSC–EVs. C Apoptosis of SH-SY5Y cells co-incubated with MSC–EVs. D SOD level in SH-SY5Y cells co-incubated with MSC–EVs using SOD kit. E MDA level in SH-SY5Y cells co-incubated with MSC–EVs using MDA kit. F ROS levels in SH-SY5Y cells co-incubated with MSC-EVs using DCFH-DA fluorescent staining. *p < 0.05 vs. MSC–EV–NC mimic or SH-SY5Y cells without treatment, #p < 0.05 vs. 6-OHDA-induced SH-SY5Y cells; $p < 0.05 vs. SH-SY5Y cells co-incubated with MSC–EV–NC mimic. Cell experiments were repeated three times independently.
Fig. 4
Fig. 4. miR-181a–2–3p targets EGR1.
A The downstream genes of miR-181a–2–3p predicted using DIANA TOOLS and mircroRNA and Venn map of the human transcription factor obtained from hTFtarget, Cistrome and JASPAR. B The interaction network of proteins of 9 important transcription factors constructed by String. Red represents the higher core degree, and blue represents the lower core degree. C The binding sites between miR-181a–2–3p and EGR1 predicted using DIANA TOOL. D The binding of miR-181a–2–3p to EGR1 using dual-luciferase assay. E EGR1 mRNA level in SH-SY5Y cells treated with 6-OHDA determined using RT-qPCR. F Western blot analysis of EGR1 protein level in SH-SY5Y cells treated with 6-OHDA. G EGR1 mRNA level in SH-SY5Y cells treated with miR-181a–2–3p mimic or inhibitor determined using RT-qPCR. H Western blot analysis of EGR1 protein level in SH-SY5Y cells treated with miR-181a-2-3p mimic or inhibitor. *p < 0.05 vs. NC mimic or *p < 0.05, **p < 0.01, ***p < 0.001 vs. SH-SY5Y cells without treatment; #p < 0.05 vs. NC inhibitor. Cell experiments were repeated three times independently.
Fig. 5
Fig. 5. miR-181a–2–3p suppresses apoptosis and OS of SH-SY5Y cells by inhibiting EGR1 expression.
A The knockdown effect of the two interference sequences of EGR1. B Expression of miR-181a–2–3p and EGR1 in SH-SY5Y cells after different treatments. C Cell proliferation in SH-SY5Y cells after different treatments. D Apoptosis of SH-SY5Y cells after different treatments. E SOD level in SH-SY5Y cells after different treatments detected using SOD kit. F MDA level in SH-SY5Y cells after different treatments using MDA kit. G ROS levels in SH-SY5Y cells after different treatments detected using DCFH-DA fluorescent staining. *p < 0.05 vs. si-NC, NC inhibitor + si-NC, or cells without treatment, #p < 0.05 vs. NC inhibitor + si-EGR1 or NC inhibitor + si-NC; $p < 0.05 vs. NC inhibitor + si-EGR1. Cell experiments were repeated three times independently.
Fig. 6
Fig. 6. EGR1 promotes apoptosis and OS of SH-SY5Y cells by regulating NOX4.
A Significant co-expression of EGR1 and NOX4 analyzed using MEM. B EGR1 enriched in the NOX4 promoter region verified by ChIP assay. C NOX4 mRNA level in SH-SY5Y cells treated with 6-OHDA at different concentrations detected using RT-qPCR. D NOX4 protein level in SH-SY5Y cells treated with 6-OHDA at different concentrations. E The knockdown effect of the two interference sequences of NOX4. F Expression of EGR1 and NOX4 in SH-SY5Y cells after different treatments measured using RT-qPCR. G Cell proliferation in SH-SY5Y cells after different treatments. H Cell apoptosis in SH-SY5Y cells after different treatments. I SOD level in SH-SY5Y cells after different treatments. J MDA level in SH-SY5Y cells after different treatments. K ROS levels in SH-SY5Y cells after different treatments detected using DCFH-DA fluorescent staining. *p < 0.05 vs. si-NC, oe-NC + si-NC, or SH-SY5Y cells without treatment, #p < 0.05 vs. oe-NC + si-NOX4, oe-NC + si-NC; $p < 0.05 vs. oe-NC + si-NOX4. Cell experiments were repeated three times independently.
Fig. 7
Fig. 7. p38 MAPK pathway mediates NOX4 to promote apoptosis and OS of SH-SY5Y cells.
A MEM analysis of NOX4 and p38 MAPK significant co-expression. B The levels of NOX4, p–p38, and p38 in SH-SY5Y cells after different treatments measured by Western blot assay. C Cell proliferation in SH-SY5Y cells after different treatments. D Cell apoptosis in SH-SY5Y cells after different treatments. E SOD level in SH-SY5Y cells after different treatments. F MDA level in SH-SY5Y cells after different treatments. G ROS levels in SH-SY5Y cells after different treatments detected using DCFH-DA fluorescent staining. *p < 0.05 vs. SH-SY5Y cells without treatment, #p < 0.05 vs. oe-NC + DMSO; $p < 0.05 vs. oe-NOX4 + DMSO. Cell experiments were repeated three times independently.
Fig. 8
Fig. 8. miR-181a–2–3p inhibits apoptosis and OS of SH-SY5Y cells by regulating the EGR1/NOX4 axis.
A miR-181a–2–3p, EGR1, and NOX4 expression in SH-SY5Y cells treated with 6-OHDA in combination with different plasmids determined using RT-qPCR. B Levels of p–p38 and p38 in SH-SY5Y cells treated with 6-OHDA in combination with different plasmids determined using Western blot analysis. C Cell proliferation in SH-SY5Y cells treated with 6-OHDA in combination with different plasmids. D Cell apoptosis in SH-SY5Y cells treated with 6-OHDA in combination with different plasmids. E SOD level in SH-SY5Y cells treated with 6-OHDA in combination with different plasmids detected using SOD kit. F MDA level in SH-SY5Y cells treated with 6-OHDA in combination with different plasmids detected using MDA kit. G ROS levels in SH-SY5Y cells treated with 6-OHDA in combination with different plasmids detected using DCFH-DA fluorescent staining. C, E, F, and G, *p < 0.05 vs. NC mimic + oe-NC or SH-SY5Y cells without treatment, #p < 0.05 vs. miR-181a–2–3p mimic + oe-NC or NC mimic + oe-NC; $p < 0.05 vs. miR-181a–2–3p mimic + oe-NC. Cell experiments were repeated three times independently.
Fig. 9
Fig. 9. MSC–EVs carrying miR-181a–2–3p inhibit neuronal loss and OS injury in the SN area of PD mice.
A The PKH67-labeled EVs were injected intravenously into mice. Colocalization of EVs (green) with dopaminergic neurons in the SN tissues (the left panel). α-SYN expression (red) determined by immunofluorescence. DAPI (blue) located in the nucleus (scale bar = 15 μm). B miR-181a–2–3p expression in SN tissues detected using RT-qPCR. C EGR1, NOX4, p–p38, and p38 levels in SN tissues detected using Western blot analysis. D Pathological changes of SN tissues determined with H&E staining. The arrow represents the lost neurons (200 ×). E APO-induced asymmetric rotation in PD mice injected with EVs after 8 weeks. F TH expression in mouse SN tissues detected by immunohistochemical staining. G TH expression in mouse SN tissues detected using Western blot analysis. H OS marker 4-HNE in mouse SN tissues. I The dopaminergic neuron apoptosis in SN tissues detected by immunofluorescence staining. J The motor ability of mice detected by roller test. K The motor ability of mice determined by rod-climbing pole test *p < 0.05 vs. sham-operated mice, #p < 0.05 vs. saline; $p < 0.05 vs. MSC–EV–NC mimic.
Fig. 10
Fig. 10
MSC–EVs carrying miR-181a–2–3p into SH-SY5Y cells inhibit EGR1 to suppress NOX4 transcription and activation of p38 MAPK pathway, thereby repressing the apoptosis and OS of SH-SY5Y cells in PD.

References

    1. Bi XA, Wu H, Xie Y, Zhang L, Luo X, Fu Y et al. The exploration of Parkinson’s disease: a multi-modal data analysis of resting functional magnetic resonance imaging and gene data. Brain Imaging Behav. 2020;15:1986–96. - PubMed
    1. Wu DM, Han XR, Wen X, Wang S, Fan SH, Zhuang J, et al. Salidroside protection against oxidative stress injury through the Wnt/beta-catenin signaling pathway in rats with Parkinson’s disease. Cell Physiol. Biochem. 2018;46:1793–806. doi: 10.1159/000489365. - DOI - PubMed
    1. Puspita L, Chung SY, Shim JW. Oxidative stress and cellular pathologies in Parkinson’s disease. Mol. Brain. 2017;10:53. doi: 10.1186/s13041-017-0340-9. - DOI - PMC - PubMed
    1. Morry J, Ngamcherdtrakul W, Yantasee W. Oxidative stress in cancer and fibrosis: Opportunity for therapeutic intervention with antioxidant compounds, enzymes, and nanoparticles. Redox Biol. 2017;11:240–53. doi: 10.1016/j.redox.2016.12.011. - DOI - PMC - PubMed
    1. Glavaski-Joksimovic A, Bohn MC. Mesenchymal stem cells and neuroregeneration in Parkinson’s disease. Exp Neurol. 2013;247:25–38. doi: 10.1016/j.expneurol.2013.03.016. - DOI - PubMed