. 2022 Jan 24;12(1):1186.
doi: 10.1038/s41598-022-05152-8.

Impact of hemolysis on multi-OMIC pancreatic biomarker discovery to derisk biomarker development in precision medicine studies

Affiliations

Impact of hemolysis on multi-OMIC pancreatic biomarker discovery to derisk biomarker development in precision medicine studies

Richard Searfoss et al. Sci Rep. .

Abstract

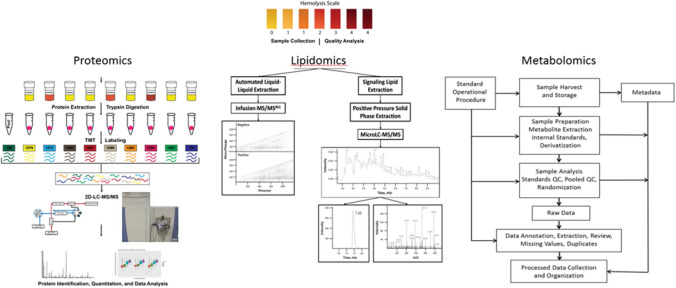
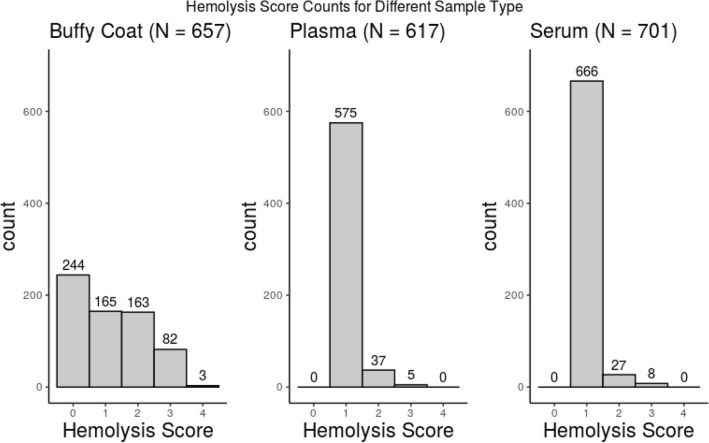
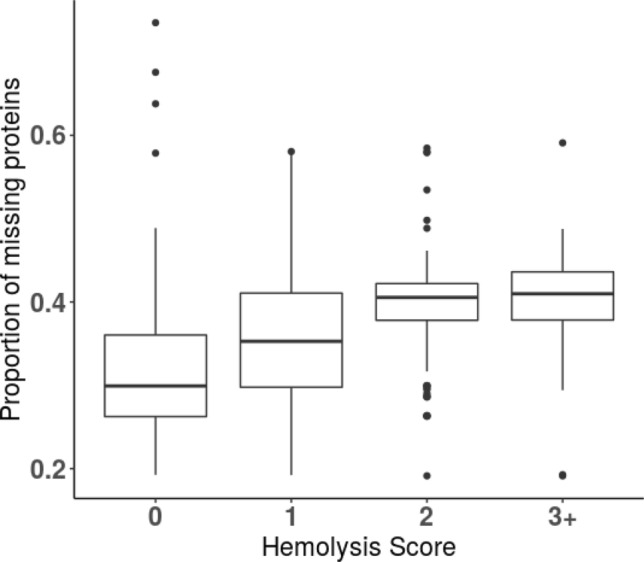
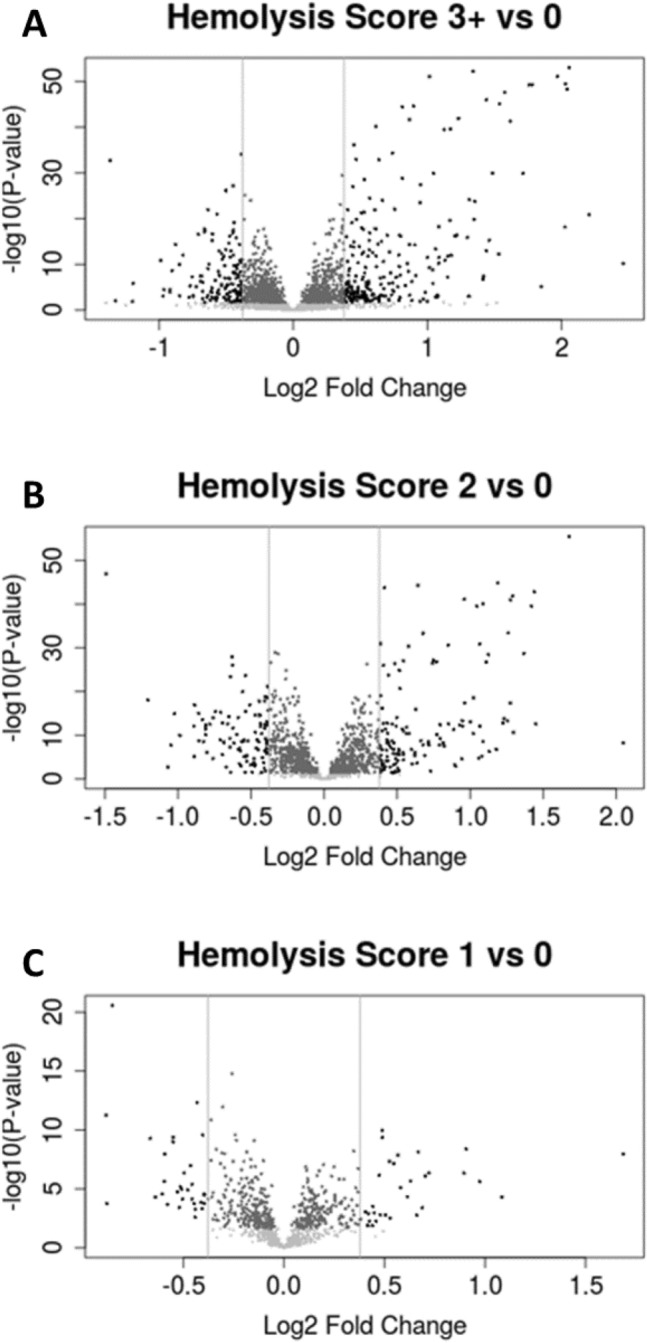
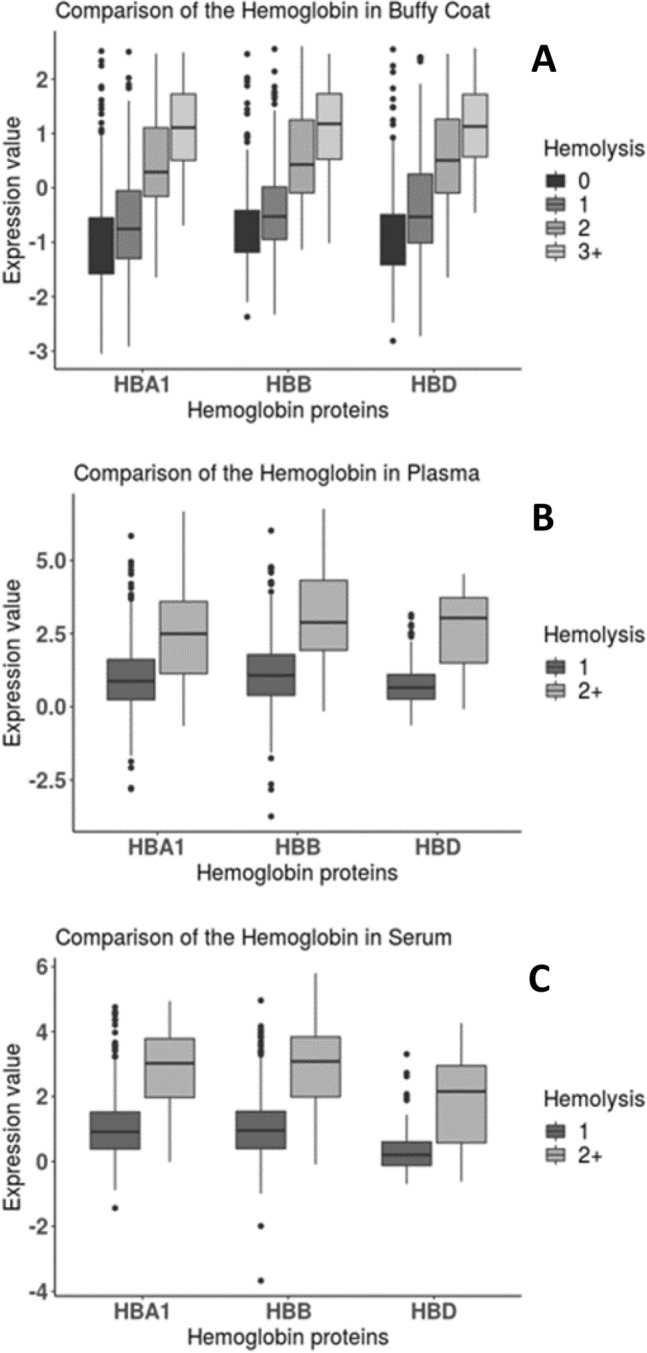
Cancer biomarker discovery is critically dependent on the integrity of biofluid and tissue samples acquired from study participants. Multi-omic profiling of candidate protein, lipid, and metabolite biomarkers is confounded by timing and fasting status of sample collection, participant demographics and treatment exposures of the study population. Contamination by hemoglobin, whether caused by hemolysis during sample preparation or underlying red cell fragility, contributes 0-10 g/L of extraneous protein to plasma, serum, and Buffy coat samples and may interfere with biomarker detection and validation. We analyzed 617 plasma, 701 serum, and 657 buffy coat samples from a 7-year longitudinal multi-omic biomarker discovery program evaluating 400+ participants with or at risk for pancreatic cancer, known as Project Survival. Hemolysis was undetectable in 93.1% of plasma and 95.0% of serum samples, whereas only 37.1% of buffy coat samples were free of contamination by hemoglobin. Regression analysis of multi-omic data demonstrated a statistically significant correlation between hemoglobin concentration and the resulting pattern of analyte detection and concentration. Although hemolysis had the greatest impact on identification and quantitation of the proteome, distinct differentials in metabolomics and lipidomics were also observed and correlated with severity. We conclude that quality control is vital to accurate detection of informative molecular differentials using OMIC technologies and that caution must be exercised to minimize the impact of hemolysis as a factor driving false discovery in large cancer biomarker studies.


Conflict of interest statement

The authors declare no competing interests.

Figures

Figure 1
Figure 1
Workflow of the methods used to study the impact of Hemolysis. Initially, clinical samples were assigned a hemolysis score of 0–4 following the hemolysis scale color legend. In proteomics, plasma and serum were filtered and depleted of the top 14 most abundant proteins, and buffy coat cells were lysed. Proteins were extracted and digested with trypsin before being labeled with TMT 10-Plex. TMT-labeled peptides were analyzed using 2D LC–MS/MS platform and quantified using Proteome Discoverer v1.4. In lipidomics, structural lipids were extracted via liquid/liquid extraction method on an automated Hamilton Robotics STARlet system. Extracted lipids were analyzed via direct injection electrospray ionization TOF–MS. Further, mediator lipids were acidified and extracted using SPE. Eluted lipids were dried and resuspended for LC–MS analysis. In metabolomics, metabolites were extracted in organic conditions and analyzed using gas chromatography–mass spectrometry (GC/MS), reversed-phase liquid chromatography–mass spectrometry (RP-LC/MS), and hydrophilic interaction chromatography–liquid chromatography–tandem mass spectrometry (HILIC-LC/MS/MS). Post-processing of data included inspection and merging.
Figure 2
Figure 2
Hemolysis score distribution of sample count buffy coat (N = 657), Plasma (N = 617), and Serum (N = 701) samples included in this study.
Figure 3
Figure 3
Boxplots visualizing relative proportion of missing proteins. Missing proteins were determined by comparing total number of proteins identified across all samples of each type, and number of proteins not identified in each sample relative to total identified proteins 3647, groups by hemolysis score of 0, 1, 2 and 3.
Figure 4
Figure 4
Volcano plots showing a comparison of protein expression between 3 versus 0, 2 versus 0 and 1 versus 0. The expression of protein ratio to the QCP was exhibited as Log2 fold and compared to − Log10 of p value. Significant proteins required minimum 1.3 fold-change difference and maximum p value of 0.05.
Figure 5
Figure 5
Expression of hemoglobin proteins in (A) buffy coat, (B) plasma, and (C) serum (HBA1 = Hemoglobin Subunit Alpha, HBB = Hemoglobin Subunit Beta, HBD = Hemoglobin Subunit Delta) as a relative measure of hemolysis. (A) HBA1 protein expression comparison between hemolysis score of 0 versus 1 in buffy coat with adjusted p value of 0.0014, comparison between 0 versus 2 with adjusted p value of 1.29e−38 and comparison between 0 versus 3 with adjusted p value of 2.29e−47. HBD protein comparison between 0 versus 1 with adjusted p value of 1.40E−05, comparison of 0 versus 2 with adjusted p value of 6.23e−44 and comparison of 0 versus 3 with adjusted p value of 7.28E−49. HBB protein comparison between 0 versus 1 with adjusted p value of 0.0005, comparison of 0 versus 2 with adjusted p value of 1.13e−40 and comparison of 0 versus 3 with an adjusted p value of 2.62e−47. Samples were grouped into hemolysis score 1 and 2+ for plasma and serum due to low number of score 3 and 4 samples in these matrices. (B) For plasma shows HBA1 protein comparison of hemolysis score 1 versus 2 with adjusted p value of 6.65E−09, HBB protein comparison 1 versus 2 with adjusted p value of 4.24e−10, and HBD protein comparison of 1 versus 2 with adjusted p value of 0.00027. C For serum shows HBA1 protein comparison 1 versus 2 with adjusted p value of 4.16e−22, HBB protein comparison 1 versus 2 with adjusted p value of 1.15e−23, and HBD protein comparison of 1 versus 2 with adjusted p value of 3.56e−09.
Figure 6
Figure 6
is a boxplot of buffy coat proteins expressions of (CA1 = Carbonic anhydrase, HIST1H2BL = Histone H2B type 1-L, UBN2 = Ubinuclein-2) that were identified as significantly differentially expressed proteins in comparison to their Hemolysis score of 0, 1, 2 and 3+. Expression values are log2 ratio to the reference sample. CA1 protein comparison between 0 versus 1 with an adjusted p value of 5.54E−07, comparison of 0 versus 2 with adjusted p value of 1.56e−53 and comparison of 0 versus 3 with adjusted p value of 3.27e−50. UBN2 protein comparison between 0 versus 1 with adjusted p value of 4.57e−07, comparison of 0 versus 2 with adjusted p value of 2.88e−08 and comparison of 0 versus 3 with adjusted p value of 5.42e−05. H2BC13 protein comparison between 0 versus 1 with adjusted p value of 2.72e−18, whereas comparison of 0 versus 2 with adjusted p value of 2.60e−45 and comparison of 0 versus 3 with adjusted p value of 3.12e−31.

References

    1. Chen D, Schubert P, Devine DV. Proteomic analysis of red blood cells from donors exhibiting high hemolysis demonstrates a reduction in membrane-associated proteins involved in the oxidative response. Transfusion. 2017;57(9):2248–2256. doi: 10.1111/trf.14188. - DOI - PubMed
    1. Barasa B, Slijper M. Challenges for red blood cell biomarker discovery through proteomics. Biochim. Biophys. Acta (BBA) 2014;1844(5):1003–1010. doi: 10.1016/j.bbapap.2013.10.002. - DOI - PubMed
    1. Mescher AL. Junqueira's basic histology: text and atlas. New York: McGraw-Hill; 2013.
    1. Bittremieux W, Tabb DL, Impens F, Staes A, Timmerman E, Martens L, Laukens K. Quality control in mass spectrometry-based proteomics. Mass Spectrom. Rev. 2018;37(5):697–711. doi: 10.1002/mas.21544. - DOI - PubMed
    1. Geyer PE, Voytik E, Treit PV, Doll S, Kleinhempel A, Niu L, Müller JB, Buchholtz ML, Bader JM, Teupser D. Plasma proteome profiling to detect and avoid sample-related biases in biomarker studies. EMBO Mol. Med. 2019;11(11):e10427. doi: 10.15252/emmm.201910427. - DOI - PMC - PubMed

Publication types