. 2022 Jan 24;12(1):1207.
doi: 10.1038/s41598-022-05228-5.

MAFLD progression contributes to altered thalamus metabolism and brain structure

Affiliations

MAFLD progression contributes to altered thalamus metabolism and brain structure

Saverio Nucera et al. Sci Rep. .

Abstract

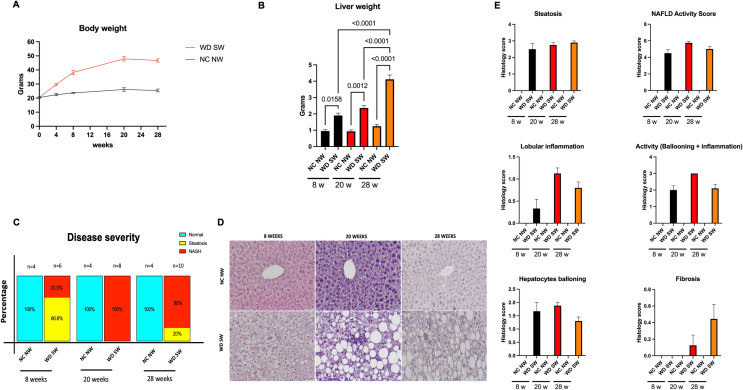
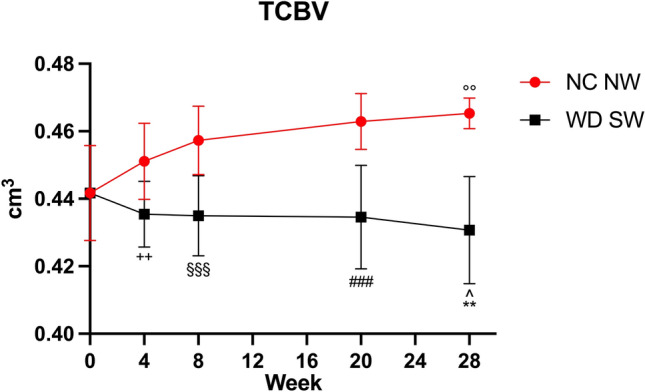
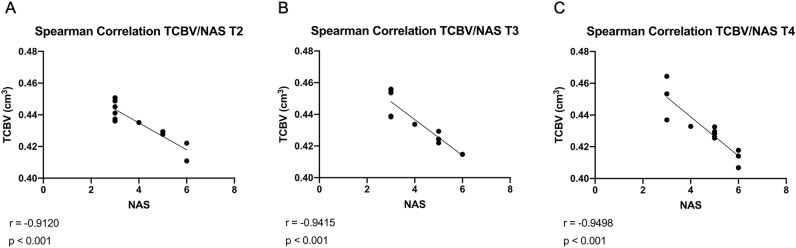
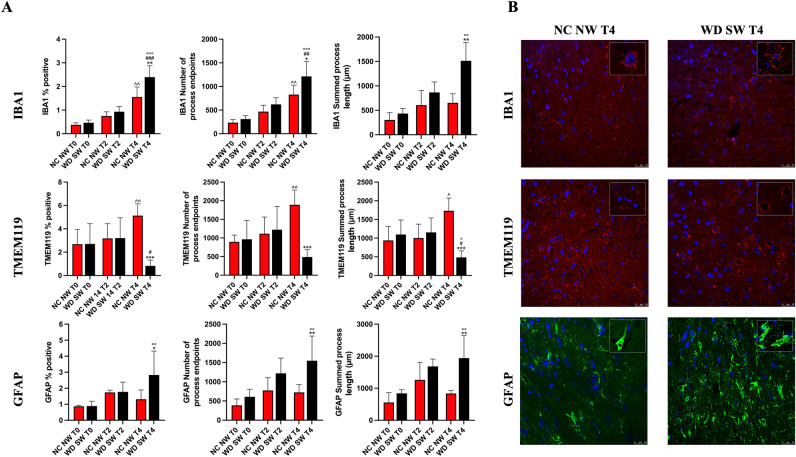
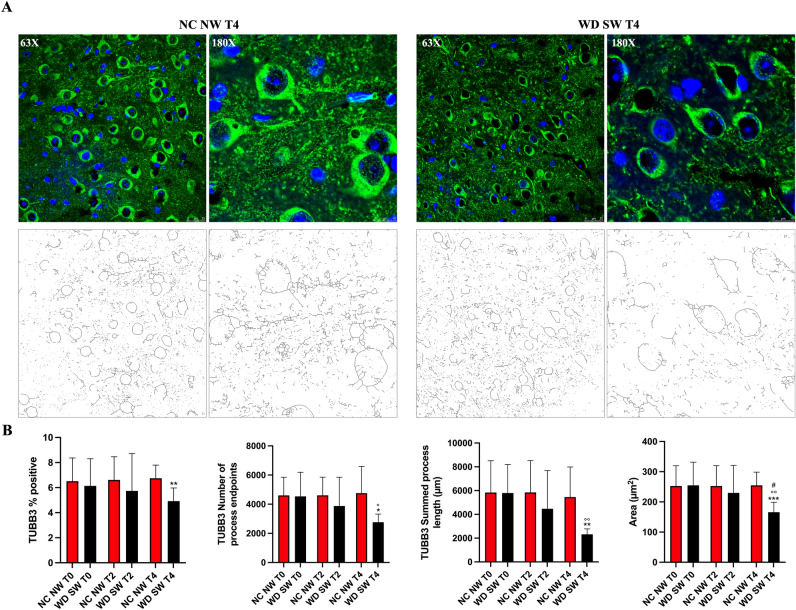
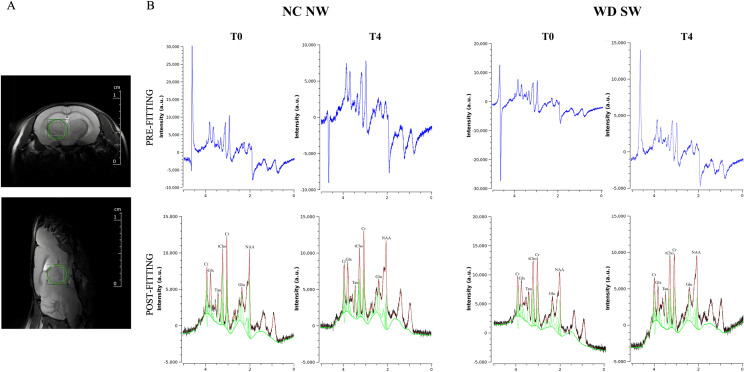
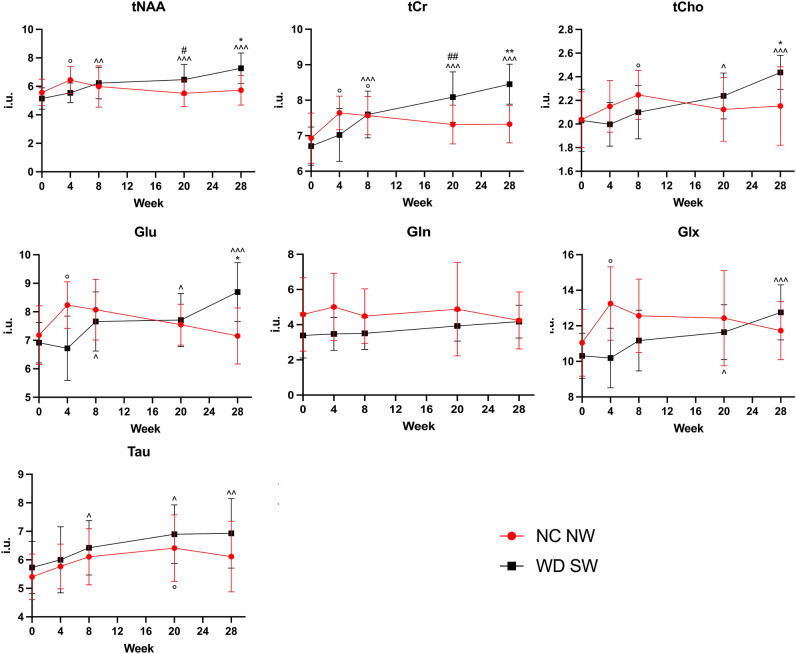
Metabolic associated fatty liver disease (MAFLD), commonly known as non-alcoholic fatty liver disease, represents a continuum of events characterized by excessive hepatic fat accumulation which can progress to nonalcoholic steatohepatitis (NASH), fibrosis, cirrhosis, and in some severe cases hepatocellular carcinoma. MAFLD might be considered as a multisystem disease that affects not only the liver but involves wider implications, relating to several organs and systems, the brain included. The present study aims to investigate changes associated with MAFLD-induced alteration of thalamic metabolism in vivo. DIAMOND (Diet-induced animal model of non-alcoholic fatty liver disease) mice were fed a chow diet and tap water (NC NW) or fat Western Diet (WD SW) for up to 28 weeks. At the baseline and weeks 4, 8, 20, 28 the thalamic neurochemical profile and total cerebral brain volume were evaluated longitudinally in both diet groups using 1H-MRS. To confirm the disease progression, at each time point, a subgroup of animals was sacrificed, the livers excised and placed in formalin. Liver histology was assessed and reviewed by an expert liver pathologist. MAFLD development significantly increases the thalamic levels of total N-acetylaspartate, total creatine, total choline, and taurine. Furthermore, in the WD SW group a reduction in total cerebral brain volume has been observed (p < 0.05 vs NC NW). Our results suggest that thalamic energy metabolism is affected by MAFLD progression. This metabolic imbalance, that is quantifiable by 1H-MRS in vivo, might cause structural damage to brain cells and dysfunctions of neurotransmitter release.


Conflict of interest statement

The authors declare no competing interests.

Figures

Figure 1
Figure 1
High-fat diet-fed mice develop fatty liver and steatohepatitis. (A) body changes over time. Animals were fed a normal chow diet and tap water (NC NW) or high fructose/glucose, high fat Western Diet (WD SW) for up to 28 weeks. (B) High fat Western Diet was associated with a significant increase in terminal liver weight compared to CD NW-fed animals at 8, 20 and 28 weeks. (C) Disease severity expressed in percentage. (D) Gross liver from DIAMOND mice fed a control diet (NC NW) or high fat Western Diet (WD SW) for 8, 20 and 28 weeks. Representative liver sections stained with hematoxylin–eosin (H&E) of livers from CD NW or WD SW mice at 8, 20 or 28 weeks of diet are shown. Original magnification, × 20. (E) Histology score for steatosis, hepatocyte ballooning, lobular inflammation, fibrosis and NAFLD Activity Score were quantified. Data are expressed as the mean ± SEM for 4–10 mice per group. For body weight NC NW AUC = 683.1 ± 20.2; WD SW AUC = 1131 ± 50.2. WD SW AUC < 0.001 vs NC NW AUC.
Figure 2
Figure 2
Total cerebral brain volume for the NC NW (red) and WD SW (black) mice during the 24 weeks investigated. T0: 0 weeks, T1: 4 weeks, T2: 8 weeks, T3: 20 weeks, T4: 28 weeks. The results are expressed as mean ± S.D. ^: p < 0.05 vs WD SW T0, **: p < 0.01 vs NC NW T4, °°: p < 0.01 vs NC NW T0, +  + : p < 0.01 vs NC NW T1, §§§: p < 0.001 vs NC NW T2, ###: p < 0.001 vs NC NW T3. NC NW: Normal Chow Normal Water, WD SW: Western Diet Sugar Water.
Figure 3
Figure 3
Relationship between TCBV (Total cerebral brain volume, cm3) and NAS (NAFLD Activity Score, 0–8) by Spearman-related analysis. Lines are generated using regression analysis (GraphPad Prism); r = Spearman’s correlation coefficient; NAS represents the sum of scores for steatosis, lobular inflammation, and ballooning; (A) T2: 8 weeks; (B) T3: 20 weeks; (C) T4: 28 weeks.
Figure 4
Figure 4
Immunofluorescence staining for IBA1 and TMEM119 in microglia and for GFAP in astrocytes. (A) The results are expressed as mean ± S.D. NC NW: Normal Chow Normal Water; WD SW: Western Diet Sugar Water. T0: 0 weeks; T2: 8 weeks; T4: 28 weeks. IBA1: Ionized calcium-binding adaptor molecule 1, TMEM119: Transmembrane protein 119, GFAP: Glial fibrillary acidic protein. *: p < 0.05, **: p < 0.01, ***: p < 0.001 vs NC NW T4; #: p < 0.05, ##: p < 0.01, ###: p < 0.001 vs WD SW T2, °: p < 0.05, °°: p < 0.01, °°°: p < 0.001 vs WD SW T0; ^: p < 0.05, ^^: p < 0.01 vs NC NW T0. (B) Representative confocal images of IBA1 positive microglia (above), TMEM119 positive microglia (middle), GFAP positive astrocytes (below) and magnified illustrations of microglia and astrocytes morphology.
Figure 5
Figure 5
Immunofluorescence staining for TUBB3 in neurons. (A) Representative confocal 63X and 180X images (above) and respective 63X and 180X skeletonized images (below) of TUBB3 positive neurons at T4 (28 weeks) (B) The results are expressed as mean ± S.D. NC NW: Normal Chow Normal Water; WD SW: Western Diet Sugar Water. T0: 0 weeks; T2: 8 weeks; T4: 28 weeks. TUBB3: anti-β III Tubulin. *: p < 0.05, **: p < 0.01, ***: p < 0.001 vs NC NW T4; °: p < 0.05, °°: p < 0.01 vs WD SW T0; #: p < 0.05 vs WD SW T2.
Figure 6
Figure 6
1H-MRS of the mouse thalamus. (A) Representative axial and sagittal T2_turboRARE weighted images with fat suppression of mouse brain and corresponding voxel location centered in the thalamic region (2 × 2 × 2 mm3). (B) Representative in vivo pre-fitting and post-fitting 1H-MRS spectra from NC NW mouse thalamus at baseline (T0) and after 28 weeks (T4) (left) and WD SW mouse thalamus at baseline (T0) and after 28 weeks (T4) (right), performed by Tarquin. In post-fitting 1H-MRS spectra the black trace represents the processed signal, the red trace is the model signal, while the green trace is the baseline plus the individual metabolite spectral lines.
Figure 7
Figure 7
Concentration values of the metabolites for NC NW (red) and WD SW (black) mice during the 28 weeks investigated. The results are expressed as mean ± S.D. *: p < 0.05, **: p < 0.01 vs NC NW T4; #: p < 0.05, ##: p < 0.01 vs NC NW T3; ^: p < 0.05, ^^: p < 0.01, ^^^: p < 0.001 vs WD SW T0; °: p < 0.05 vs NC NW T0. i.u.: institutional units. NC NW: Normal Chow Normal Water, WD SW: Western Diet Sugar Water; T0: 0 weeks, T1: 4 weeks, T2: 8 weeks, T3: 20 weeks, T4: 28 weeks. tNAA, total N-acetylaspartate; tCr, total creatine; tCho, total choline; Glu, glutamate; Gln, Glutamine; Glx, glutamate + glutamine; Tau, Taurine.

References

    1. Eslam, M., Sanyal, A. J., George, J., International consensus panel. MAFLD: a consensus-driven proposed nomenclature for metabolic associated fatty liver disease. Gastroenterology 158, 1999–2014.e1 (2020). - PubMed
    1. Fouad Y, Elwakil R, Elsahhar M, et al. The NAFLD-MAFLD debate: eminence vs evidence. Liver Int. 2021;41:255–260. - PubMed
    1. Chen Y, Li H, Li S, et al. Prevalence of and risk factors for metabolic associated fatty liver disease in an urban population in China: a cross-sectional comparative study. BMC Gastroenterol. 2021;21:212. - PMC - PubMed
    1. Estes C, Razavi H, Loomba R, Younossi Z, Sanyal AJ. Modeling the epidemic of nonalcoholic fatty liver disease demonstrates an exponential increase in burden of disease. Hepatology. 2018;67:123–133. - PMC - PubMed
    1. Kleiner DE, et al. Design and validation of a histological scoring system for nonalcoholic fatty liver disease. Hepatology. 2005;41:1313–1321. - PubMed

Publication types