. 2022 Jan 24;12(1):1221.
doi: 10.1038/s41598-022-05273-0.

Proteome alterations in the aqueous humor reflect structural and functional phenotypes in patients with advanced normal-tension glaucoma

Affiliations

Proteome alterations in the aqueous humor reflect structural and functional phenotypes in patients with advanced normal-tension glaucoma

Si Hyung Lee et al. Sci Rep. .

Abstract

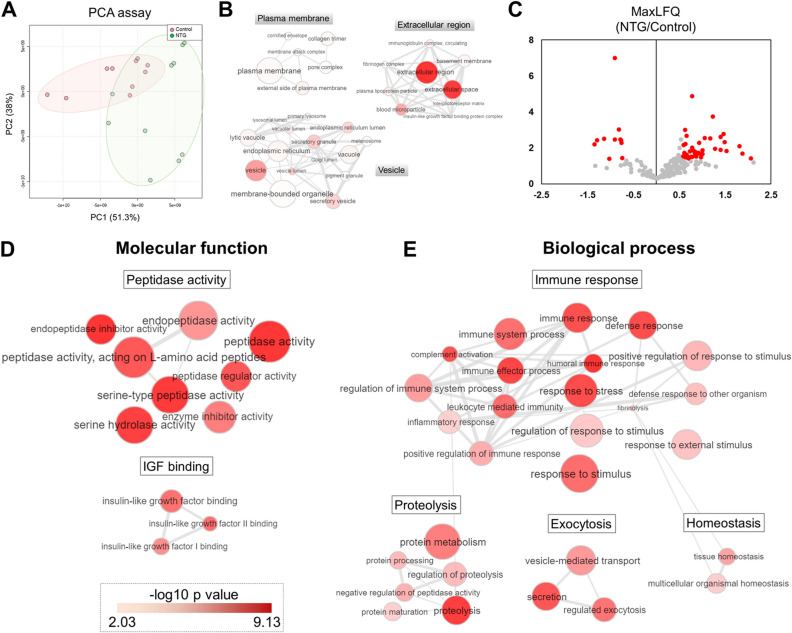
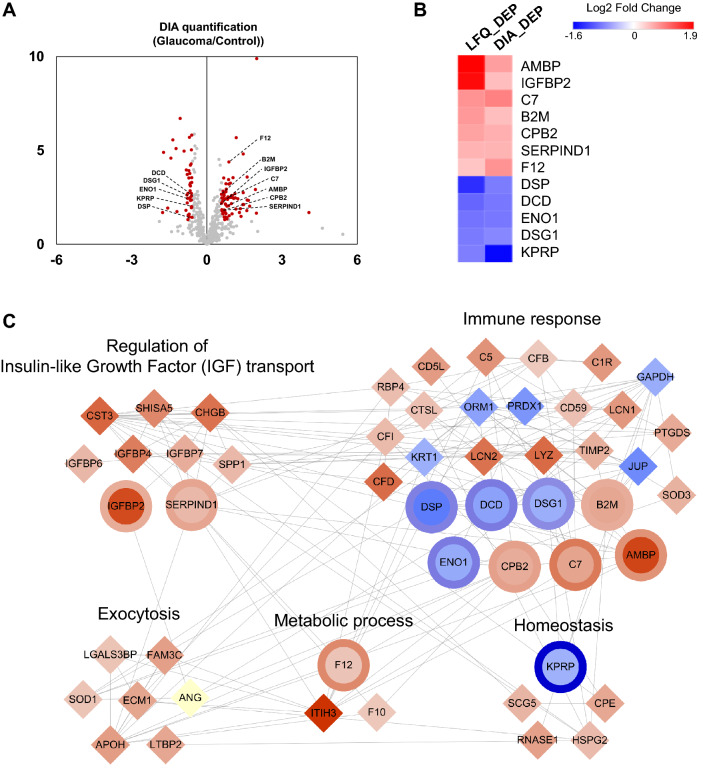
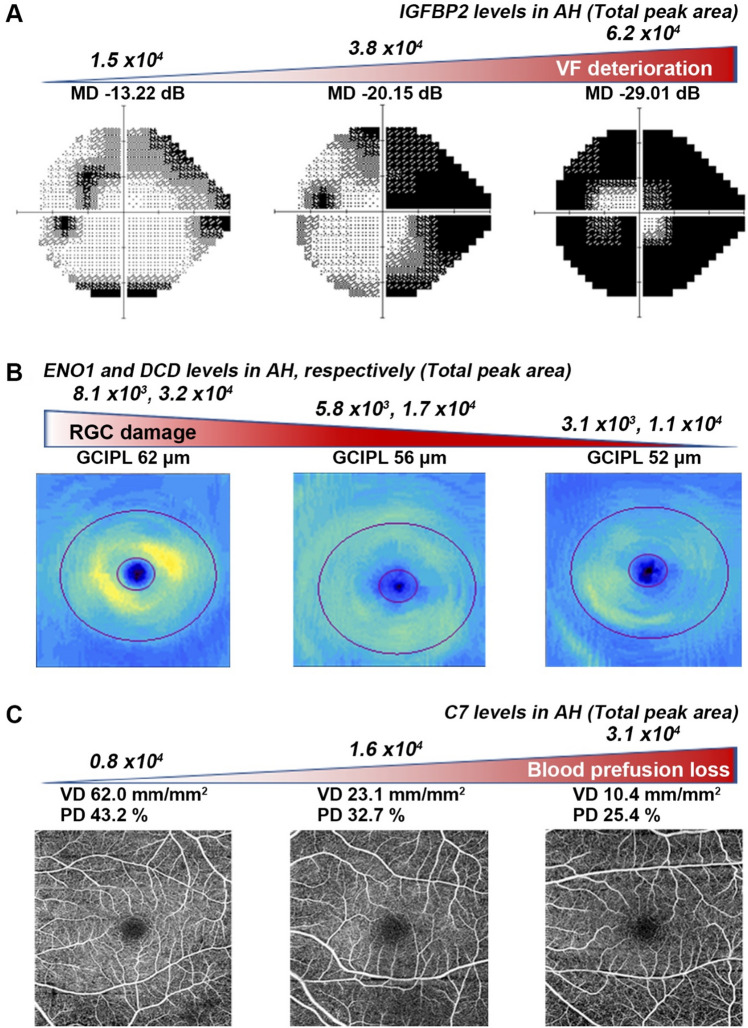
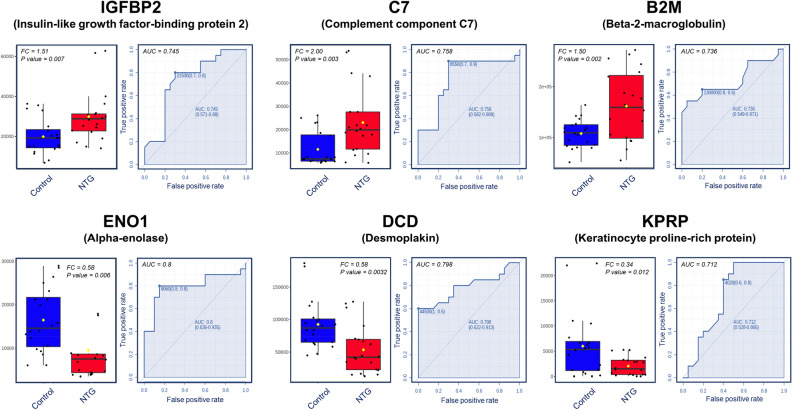
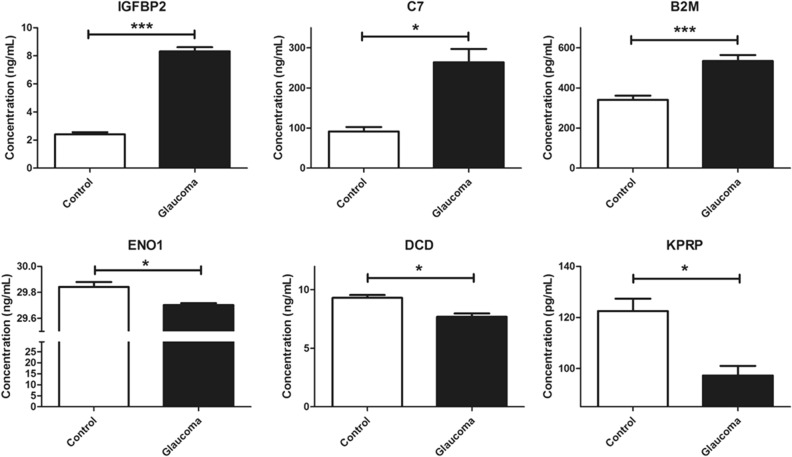
Previous reports have shown possible association between altered protein levels in aqueous humor (AH) and normal-tension glaucoma (NTG), but the underlying pathogenetic mechanism as well as specific molecular biomarkers for NTG remains still elusive. Here, we aimed to identify novel biomarkers for advanced NTG by analyzing the proteome of patient-derived AH and their correlation with various functional and structural parameters from the visual field test (VF), optical coherence tomography (OCT), and OCT angiography (OCTA). We determined differentially expressed proteins (DEPs) of the AH of patients with advanced NTG (n = 20) using label-free quantitative (LFQ) proteomics with pooled samples and data-independent acquisition (DIA) analysis with individual samples, and the roles of AH DEPs in biological pathways were evaluated using bioinformatics. We identified 603 proteins in the AH of patients with advanced NTG, and 61 of them were selected as DEPs via global proteome LFQ profiling. Individual DIA analyses identified a total of 12 DEPs as biomarker candidates, seven of which were upregulated, and five were downregulated. Gene ontology enrichment analysis revealed that those DEPs were mainly involved in the immune response. Moreover, IGFBP2, ENO1, C7, B2M, AMBP, DSP, and DCD showed a significant correlation with the mean deviation of VF and with peripapillary and macular parameters from OCT and OCTA. The present study provides possible molecular biomarkers for the diagnosis of advanced NTG.


Conflict of interest statement

The authors declare no competing interests.

Figures

Figure 1
Figure 1
(A) Principal component analysis plot for global proteomic data in the control and normal tension glaucoma (NTG) groups. (B) Gene Ontology cellular component (GOCC) interactive clusters of proteome in aqueous humor (AH), indicating proteins found in AH were mainly located in plasma membrane, extracellular region, or associated with vesicles. (C) Volcano plot displaying the differences in protein expression according to p value (y-axis) and the difference in their relative abundance ratio (log2 fold change) in AH between the two groups. Red dots represent differentially expressed proteins (DEPs) with p value less than 0.05 and fold change upper than 1.3. (D) GO molecular functions significantly enriched by DEPs in NTG compared with the control group are shown. (E) Significantly enriched GO biological processes (terms are clustered by representative group (Immune response, Proteolysis, Exocytosis, Homeostasis). GO terms are represented by circles, and semantic similarities were applied to clusters by other GO terms in the gene ontology. GO term is proportional to the size of the circle, whereas the color indicates the − log10 p value for the enrichment.
Figure 2
Figure 2
(A) Volcano plot depicting the variance in expression of proteins in the aqueous humor (AH) between the normal tension glaucoma (NTG) and control groups. Red dots represent significantly differentially expressed proteins (DEPs) (fold change > 1.5, p value < 0.05). Twelve DEPs in the label free quantification (LFQ) and data independent acquisition (DIA) analysis were consistently highlighted and labeled. (B) Heatmap showing the relative abundance of 12 DEPs consistently altered in the LFQ and DIA analysis. (C) Protein–protein interaction Network of AH DEPs in the NTG group versus the control group. Network model showing the biological processes affected, including the immune response, insulin-like growth factor transport, exocytosis, metabolic processes, and homeostasis. The colors of the nodes represent proteins whose levels were greatly increased (red) or decreased (blue) in NTG. The gray lines between nodes represent either a regulatory role or a physical interaction between proteins. Circle shaped nodes represent 12 verified DEPs (inner node: abundance change in the LFQ, outer layer: abundance change in DIA).
Figure 3
Figure 3
Representative cases showing the correlation between visual field (VF), optical coherence tomography (OCT) and OCT angiography (OCTA) parameters, and protein levels of aqueous humor (AH) in patients with normal tension glaucoma. (A) Insulin-growth factor binding protein 2 (IGFBP2) in AH showed a significant correlation with the mean deviation (MD) value from the VF test. (B) Alpha-enolase (ENO1) and dermcidin (DCD) levels in AH were significantly associated with a decrease in macular ganglion cell inner plexiform layer (GCIPL) thickness representing retinal ganglion cell (RGC) damage. (C) Reduced retinal vascular (VD) and perfusion density (PD). Blood perfusion was significantly related to AH protein expression of complement component 7 (C7).
Figure 4
Figure 4
Box plot and receiver operating characteristic (ROC) curve of six selected marker proteins in the aqueous humor (AH) of patients with normal tension glaucoma (NTG). The box plot demonstrates the differences of protein abundance in AH between the control and NTG groups. The fold change (FC) and p value for each marker are indicated on the interactive box plots. The ROC curve yielded an area under the curve (AUC) that indicates diagnostic efficiency.
Figure 5
Figure 5
Measurement of six selected marker protein levels using ELISA. Bar graphs demonstrate expression levels of six marker proteins, including IGFBP2, C7, B2M, ENO1, DCD, and KPRP. All experiments were repeated three times in at least triplicate (n = 5, Mann–Whitney U test for statistical analysis). *p < 0.05, **p < 0.01, ***p < 0.001.

References

    1. Resnikoff S, et al. Global data on visual impairment in the year 2002. Bull. World Health Organ. 2004;82:844–851. - PMC - PubMed
    1. Quigley HA, Broman AT. The number of people with glaucoma worldwide in 2010 and 2020. Br. J. Ophthalmol. 2006;90:262–267. doi: 10.1136/bjo.2005.081224. - DOI - PMC - PubMed
    1. Jonas JB, et al. Glaucoma. Lancet. 2017;390:2183–2193. doi: 10.1016/s0140-6736(17)31469-1. - DOI - PubMed
    1. Iwase A, et al. The prevalence of primary open-angle glaucoma in Japanese: The Tajimi Study. Ophthalmology. 2004;111:1641–1648. doi: 10.1016/j.ophtha.2004.03.029. - DOI - PubMed
    1. Kim CS, Seong GJ, Lee NH, Song KC. Prevalence of primary open-angle glaucoma in central South Korea the Namil study. Ophthalmology. 2011;118:1024–1030. doi: 10.1016/j.ophtha.2010.10.016. - DOI - PubMed

Publication types