Comparative Study
. 2022 Jan 24;12(1):1274.
doi: 10.1038/s41598-022-05202-1.

Morphological, physiological, biochemical, and transcriptome studies reveal the importance of transporters and stress signaling pathways during salinity stress in Prunus

Affiliations
Comparative Study

Morphological, physiological, biochemical, and transcriptome studies reveal the importance of transporters and stress signaling pathways during salinity stress in Prunus

Biswa R Acharya et al. Sci Rep. .

Abstract

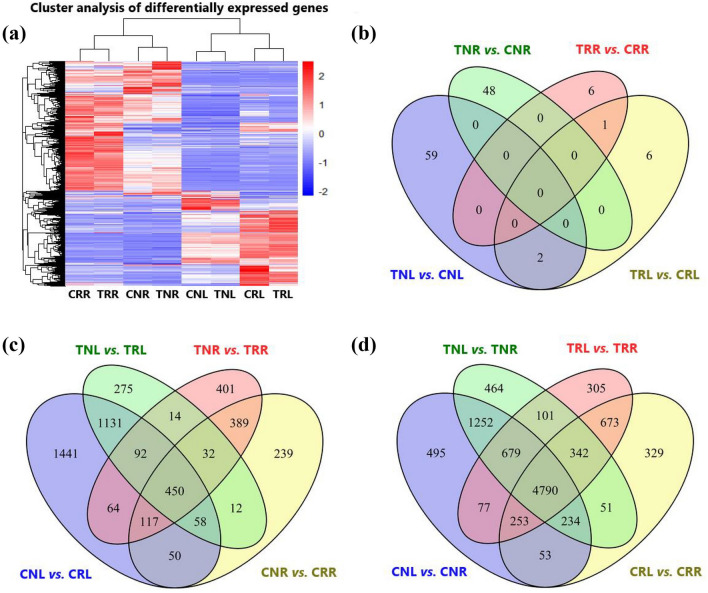
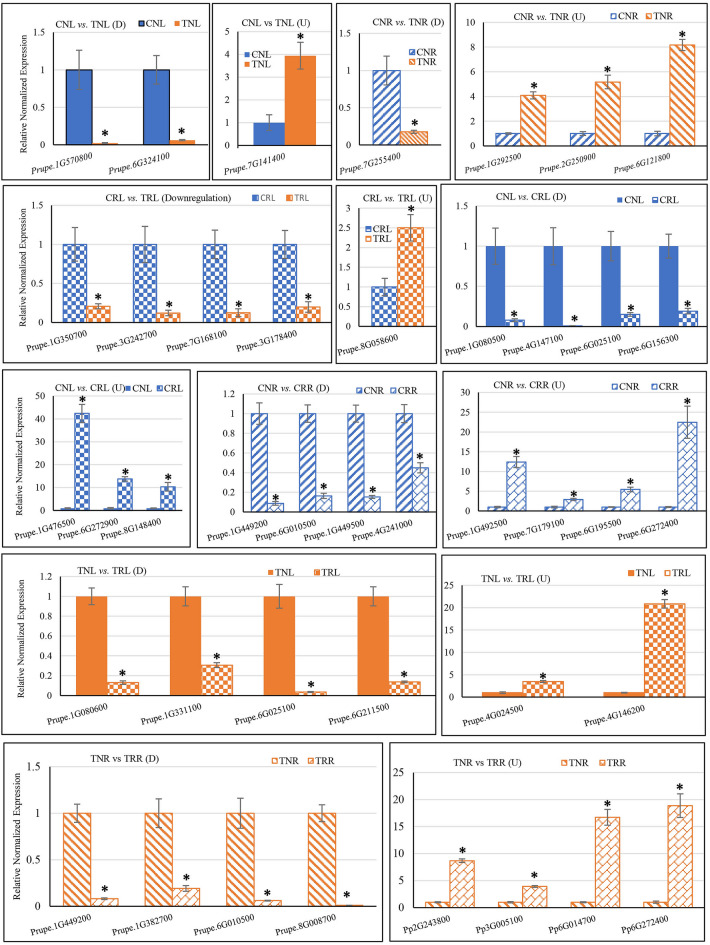
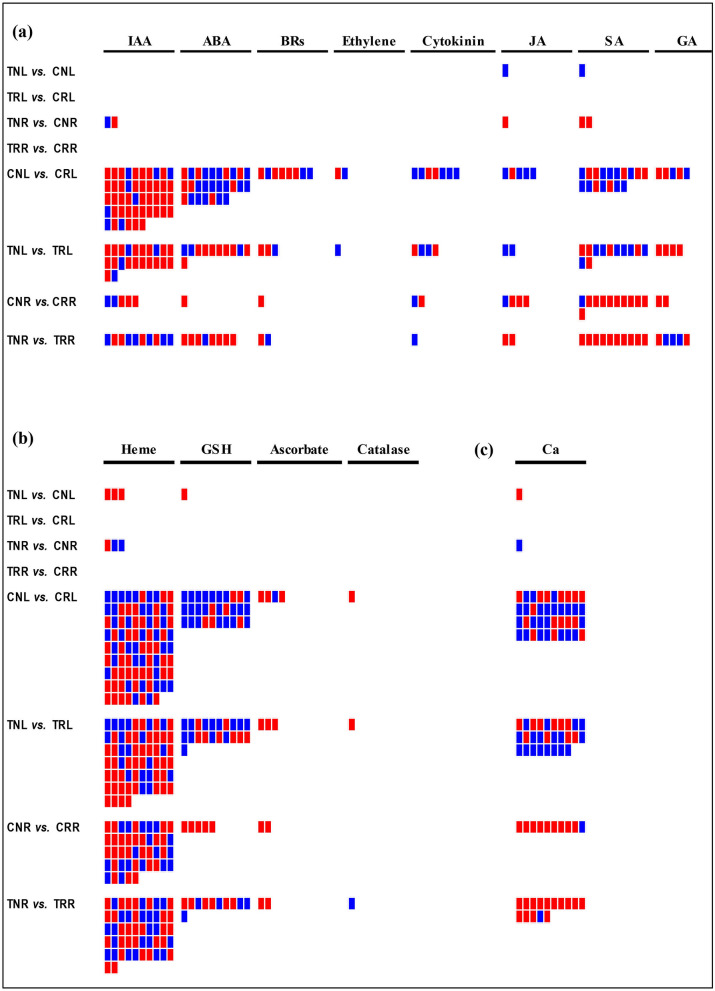
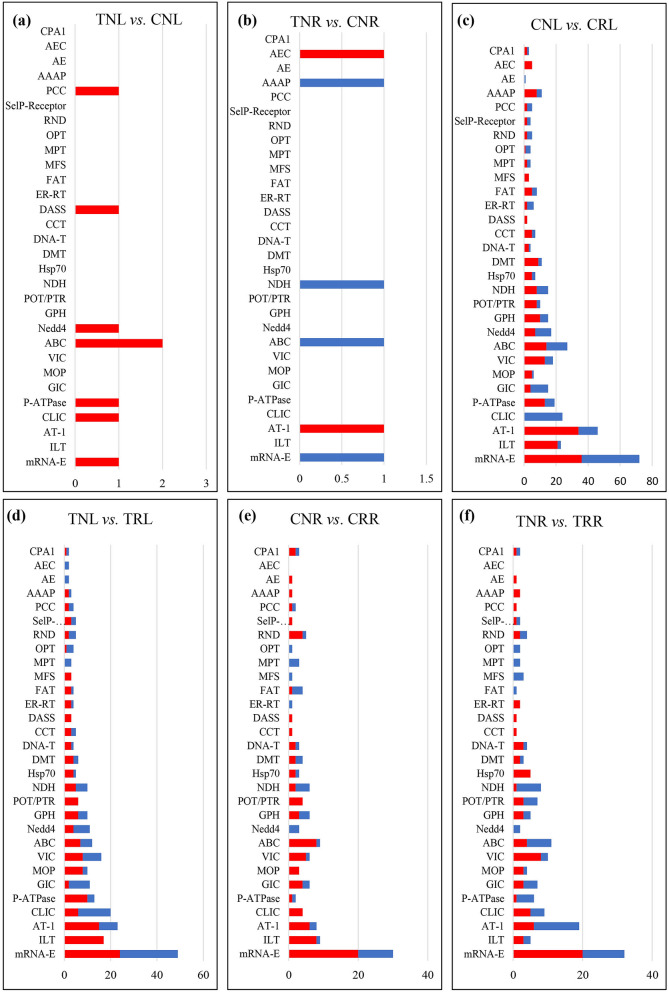
The almond crop has high economic importance on a global scale, but its sensitivity to salinity stress can cause severe yield losses. Salt-tolerant rootstocks are vital for crop economic feasibility under saline conditions. Two commercial rootstocks submitted to salinity, and evaluated through different parameters, had contrasting results with the survival rates of 90.6% for 'Rootpac 40' (tolerant) and 38.9% for 'Nemaguard' (sensitive) under salinity (Electrical conductivity of water = 3 dS m-1). Under salinity, 'Rootpac 40' accumulated less Na and Cl and more K in leaves than 'Nemaguard'. Increased proline accumulation in 'Nemaguard' indicated that it was highly stressed by salinity compared to 'Rootpac 40'. RNA-Seq analysis revealed that a higher degree of differential gene expression was controlled by genotype rather than by treatment. Differentially expressed genes (DEGs) provided insight into the regulation of salinity tolerance in Prunus. DEGs associated with stress signaling pathways and transporters may play essential roles in the salinity tolerance of Prunus. Some additional vital players involved in salinity stress in Prunus include CBL10, AKT1, KUP8, Prupe.3G053200 (chloride channel), and Prupe.7G202700 (mechanosensitive ion channel). Genetic components of salinity stress identified in this study may be explored to develop new rootstocks suitable for salinity-affected regions.


Conflict of interest statement

The authors declare no competing interests.

Figures

Figure 1
Figure 1
Performances of ‘Rootpac 40’ and ‘Nemaguard’ rootstocks under control and saline environments. (a) Relative survival rates (%) of ‘Rootpac 40’ and ‘Nemaguard’ rootstocks in response to the saline treatment compared to control. (b) Relative change in trunk diameters. (c) Leaf proline concentrations. (d) Leaf Na concentrations. (e) Leaf Cl concentrations. (f) Leaf K concentrations. Error bars represent standard errors of three biological replicates. An asterisk (*) indicates a significant difference (t-test p ≤ 0.05). C indicates control, and T indicates saline treatment.
Figure 2
Figure 2
Heat map-based clustering and Venn diagram analysis of differentially expressed genes (DEGs). (a) Heatmap and hierarchical clustering showing the status of gene expression and clustering of DEGs (those which were differentially expressed at least in one comparison) across all eight indicated samples in a specific column. (b) Venn diagram shows the number of DEGs across four salt treatment versus control comparisons. (c) Venn diagram shows the number of DEGs across four salt-sensitive (‘Nemaguard’) versus four salt-tolerant (‘Rootpac 40’) comparisons. (d) Venn diagram shows the number of DEGs across four leaf versus root comparisons as indicated from left to right. Compared samples are shown from left to right in (b)–(d). CNL, Control ‘Nemaguard’ Leaf; TNL, Treatment ‘Nemaguard’ Leaf; CNR, Control ‘Nemaguard’ Root; TNR, Treatment ‘Nemaguard’ Root; CRL, Control ‘Rootpac 40’ Leaf; TRL, Treatment Rootpac Leaf; CRR: control ‘Rootpac 40’ root; TRR, treatment ‘Rootpac 40’ Root.
Figure 3
Figure 3
qRT-PCR validation of gene expression observed in RNA-Seq data. The Y-axis indicates relative normalized expression, and the X-axis indicates gene IDs. Samples used for the gene expression comparisons are shown on top of the graph. Graphs for downregulated (D) gene(s) and upregulated (U) genes are shown separately. The blue color indicates control (blue solid, CNL; blue diagonal stripes, CNR; blue large checkerboard, CRL; blue diagonal bricks, CRR), and the orange color indicates treatment (orange solid, TNL; orange diagonal stripes, TNR; orange large checkerboard TRL; and orange diagonal bricks, TRR). An asterisk (*) indicates a significant difference (t-test p ≤ 0.05). CNL, Control ‘Nemaguard’ Leaf; TNL, Treatment ‘Nemaguard’ Leaf; CNR, Control ‘Nemaguard’ Root; TNR, Treatment ‘Nemaguard’ Root; CRL, Control ‘Rootpac 40’ Leaf; TRL, Treatment Rootpac Leaf; CRR: control ‘Rootpac 40’ root; TRR, treatment ‘Rootpac 40’ Root.
Figure 4
Figure 4
DEGs associated with phytohormone, redox, and calcium signaling pathways. (a) DEGs associated with phytohormone pathways (are indicated at the top). (b) DEGs associated with redox signaling pathways (are indicated at the top). (c) DEGs associated with calcium signaling (Ca). The red color indicates downregulated DEGs, and the blue color indicates upregulated DEGs. Left-side texts show pairwise comparisons. The top four compared samples indicate treatment versus control, and the bottom for compared samples indicate salt-sensitive versus salt-tolerant comparisons. IAA, indole acetic acid (auxin); ABA, abscisic acid; BRs, brassinosteroids; JA, jasmonic acid; SA, salicylic acid; GA, gibberellins; GSH, glutathione; Ca, calcium.
Figure 5
Figure 5
Transporter analysis of DEGs. The Y-axis indicates transporter superfamilies. The X-axis shows gene counts. Salt treatment versus control comparisons are shown in (a) and (b). Salt-sensitive versus salt-tolerant comparisons are shown in (c)–(f). The red color indicates downregulated DEGs, and the blue color indicates upregulated DEGs. Compared samples are indicated at the top of each panel.

References

    1. Zhu JK. Plant salt tolerance. Trends Plant Sci. 2001;6:66–71. doi: 10.1016/s1360-1385(00)01838-0. - DOI - PubMed
    1. Welle PD, Mauter MS. High-resolution model for estimating the economic and policy implications of agricultural soil salinization in California. Environ. Res. Lett. 2017;12:094010. doi: 10.1088/1748-9326/aa848e. - DOI
    1. Isayenkov SV, Maathuis FJM. Plant salinity stress: Many unanswered questions remain. Front. Plant Sci. 2019 doi: 10.3389/fpls.2019.00080. - DOI - PMC - PubMed
    1. Zörb C, Geilfus CM, Dietz KJ. Salinity and crop yield. Plant Biol. (Stuttg) 2019;21(Suppl 1):31–38. doi: 10.1111/plb.12884. - DOI - PubMed
    1. Butcher K, Wick A, Desutter T, Chatterjee A, Harmon J. Soil salinity: A threat to global food security. Agron. J. 2016;108:2189–2200. doi: 10.2134/agronj2016.06.0368. - DOI

Publication types