. 2022 Jan 24;12(1):1279.
doi: 10.1038/s41598-022-05341-5.

Construction and validation of a novel gene signature for predicting the prognosis of osteosarcoma

Affiliations

Construction and validation of a novel gene signature for predicting the prognosis of osteosarcoma

Jinpo Yang et al. Sci Rep. .

Abstract

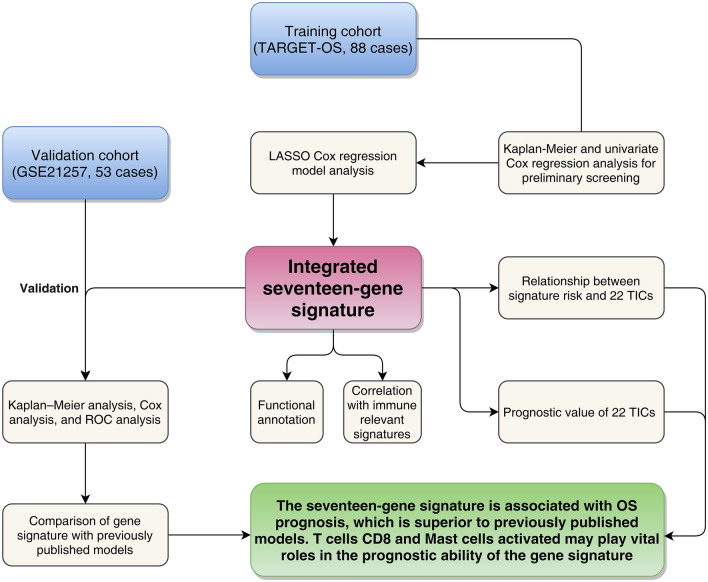
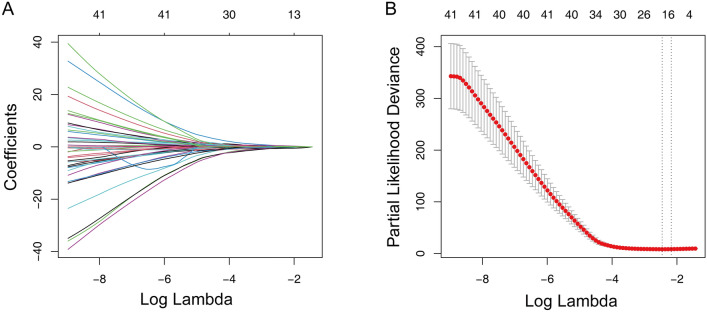
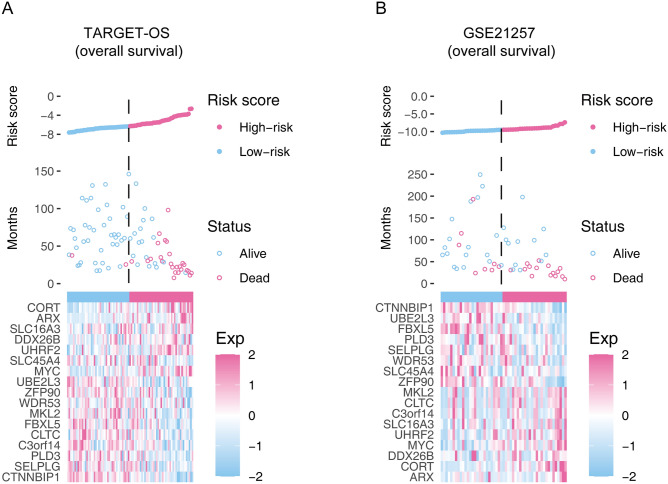
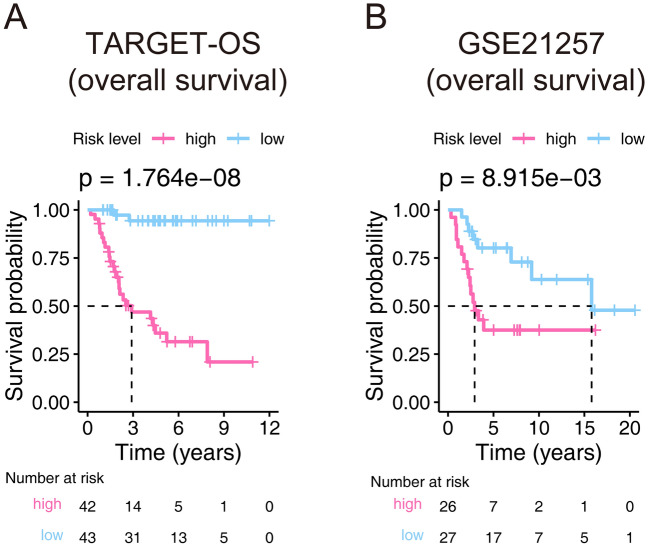
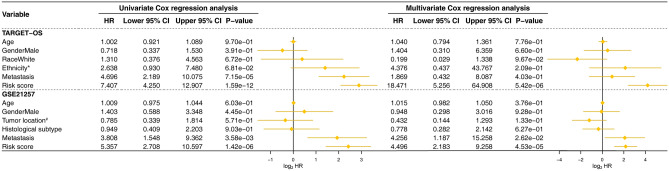
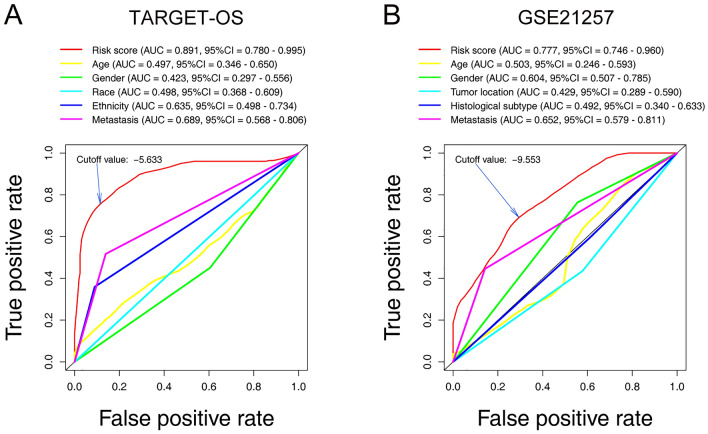
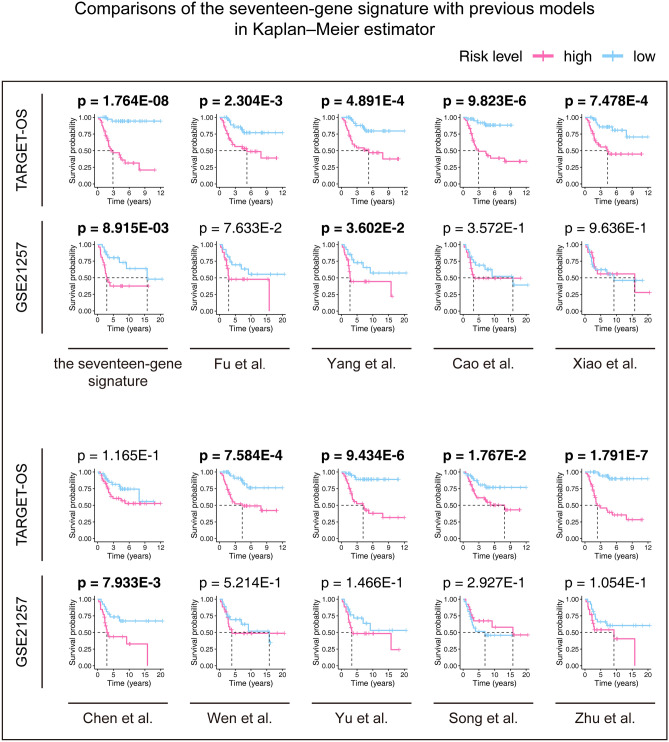
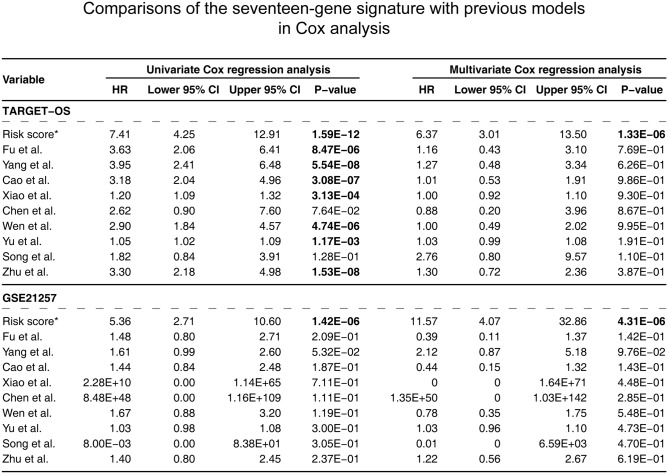
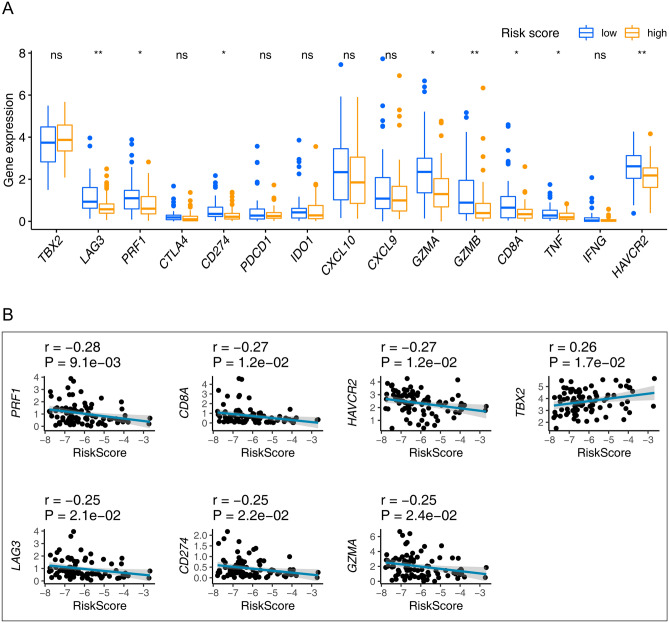
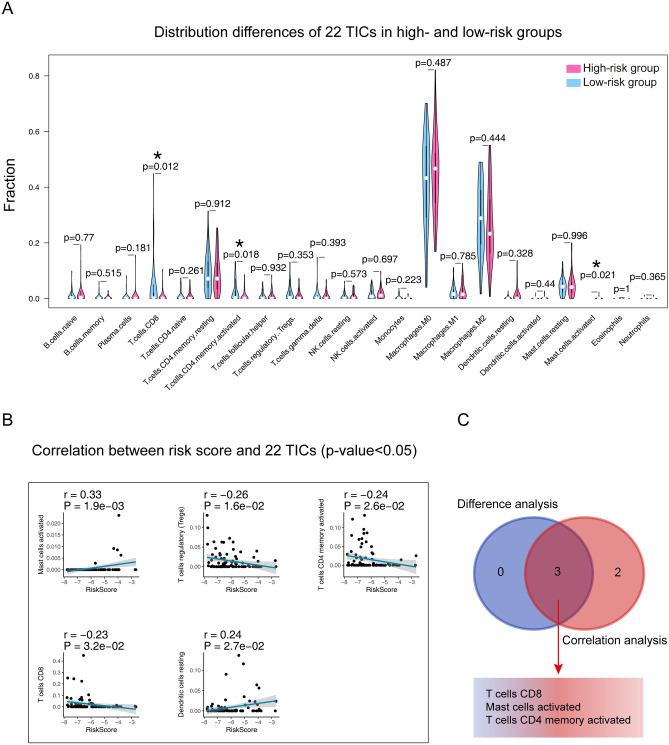
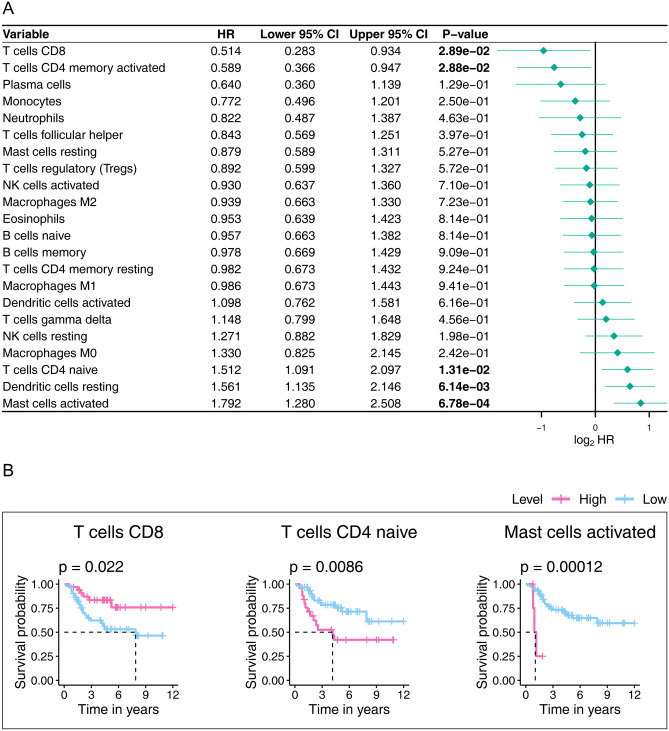
Osteosarcoma (OS) is the most common type of primary malignant bone tumor. The high-throughput sequencing technology has shown potential abilities to illuminate the pathogenic genes in OS. This study was designed to find a powerful gene signature that can predict clinical outcomes. We selected OS cases with gene expression and survival data in the TARGET-OS dataset and GSE21257 datasets as training cohort and validation cohort, respectively. The univariate Cox regression and Kaplan-Meier analysis were conducted to determine potential prognostic genes from the training cohort. These potential prognostic genes underwent a LASSO regression, which then generated a gene signature. The harvested signature's predictive ability was further examined by the Kaplan-Meier analysis, Cox analysis, and receiver operating characteristic (ROC curve). More importantly, we listed similar studies in the most recent year and compared theirs with ours. Finally, we performed functional annotation, immune relevant signature correlation identification, and immune infiltrating analysis to better study he functional mechanism of the signature and the immune cells' roles in the gene signature's prognosis ability. A seventeen-gene signature (UBE2L3, PLD3, SLC45A4, CLTC, CTNNBIP1, FBXL5, MKL2, SELPLG, C3orf14, WDR53, ZFP90, UHRF2, ARX, CORT, DDX26B, MYC, and SLC16A3) was generated from the LASSO regression. The signature was then confirmed having strong and stable prognostic capacity in all studied cohorts by several statistical methods. We revealed the superiority of our signature after comparing it to our predecessors, and the GO and KEGG annotations uncovered the specifically mechanism of action related to the gene signature. Six immune signatures, including PRF1, CD8A, HAVCR2, LAG3, CD274, and GZMA were identified associating with our signature. The immune-infiltrating analysis recognized the vital roles of T cells CD8 and Mast cells activated, which potentially support the seventeen-gene signature's prognosis ability. We identified a robust seventeen-gene signature that can accurately predict OS prognosis. We identified potential immunotherapy targets to the gene signature. The T cells CD8 and Mast cells activated were identified linked with the seventeen-gene signature predictive power.


Conflict of interest statement

The authors declare no competing interests.

Figures

Figure 1
Figure 1
Flow chart of the study. LASSO least absolute shrinkage and selection operator Cox regression model, ROC receiver operating characteristic, OS osteosarcoma, TICs tumor-infiltrating immune cells.
Figure 2
Figure 2
LASSO regression analysis for the construction of prognostic gene signature. (A) Cross-validation for tuning parameter screening upon LASSO regression analysis. (B) Screening of optimal parameter (lambda) at which the vertical lines were drawn. LASSO the least absolute shrinkage and selection operator Cox regression model.
Figure 3
Figure 3
The overall distributions of the risk score (upper), survival status (middle), and gene expression profiles (bottom) of the seventeen-gene signature in the training (A) and validation (B) cohorts.
Figure 4
Figure 4
Kaplan–Meier estimator that evaluating the prognosis capacity of the seventeen-gene signature in the training (A) and validation (B) cohorts. The bottom part indicates the number of patients at risk. The two-sided log-rank test measured the differences between the high- and low-risk groups with a p value < 0.05.
Figure 5
Figure 5
Univariate and multivariate Cox proportional-hazards models that built for testing the predicting ability of the seventeen-gene signature in two cohorts. HR hazard ratio, CI confidence interval.
Figure 6
Figure 6
ROC curves that constructed for examining the predictive ability of the seventeen-gene signature in the training (A) and validation (B) cohorts. ROC receiver operating characteristic, AUC area under the ROC curve, 95% CI 95% confidence interval.
Figure 7
Figure 7
Comparisons between the seventeen-gene signature and previous studies conducted in the training and validation cohorts using Kaplan–Meier estimator. The two-sided log-rank test measured the differences between the high- and low-risk groups. The bold p value indicates that < 0.05, which considers significantly.
Figure 8
Figure 8
Comparisons between the seventeen-gene signature and previous studies conducted in the training and validation cohorts using Cox models. HR hazard ratio, CI confidence interval. *The seventeen-gene signature that identified in this study; the bold p value indicates that < 0.05, which considers significantly.
Figure 9
Figure 9
Identification of the relationships between the seventeen-gene signature and immune relevant signatures. (A) Wilcoxon rank-sum was adopted to differentiate immune relevant signatures between the high- and low-risk groups. (B) The Pearson coefficient was applied for the correlation test between the immune relevant signatures and seventeen-gene signature. Only correlations with p value < 0.05 were plotted. ns: p value > 0.05; *p value < 0.05; **p value < 0.01; ***p value < 0.001; p value < 0.05 was considered statistically significant.
Figure 10
Figure 10
Integrating analysis for the relationship between TICs and the seventeen-gene signature. (A) Wilcoxon rank-sum was adopted to differentiate each of 22 TICs between the high- and low-risk groups. (B) The Pearson coefficient was applied for the correlation test between the TICs and the seventeen-gene signature. Only correlations with p value < 0.05 were plotted. (C) The Venn diagram that integrating the results from (A) and (B). TIC: tumor-infiltrating immune cell; *p value < 0.05; p value < 0.05 was considered statistically significant.
Figure 11
Figure 11
Univariate Cox proportional-hazards model (A) and Kaplan–Meier estimator (B) that built for evaluating the prognostic ability of 22 TICs. Only graphs with a p value < 0.05 in the log-rank test were plotted in (B). The bold p value indicates that < 0.05, which considers significant. TIC tumor-infiltrating immune cell.

References

    1. Fang F, et al. Targeting the Wnt/beta-catenin pathway in human osteosarcoma cells. Oncotarget. 2018;9:36780–36792. - PMC - PubMed
    1. Harrison DJ, Geller DS, Gill JD, Lewis VO, Gorlick R. Current and future therapeutic approaches for osteosarcoma. Expert Rev. Anticancer Ther. 2018;18:39–50. - PubMed
    1. Isakoff MS, Bielack SS, Meltzer P, Gorlick R. Osteosarcoma: Current treatment and a collaborative pathway to success. J. Clin. Oncol. 2015;33:3029–3035. - PMC - PubMed
    1. Whelan JS, Davis LE. Osteosarcoma, chondrosarcoma, and chordoma. J. Clin. Oncol. 2018;36:188–193. - PubMed
    1. Jia Y, Liu Y, Han Z, Tian R. Identification of potential gene signatures associated with osteosarcoma by integrated bioinformatics analysis. PeerJ. 2021;9:e11496. - PMC - PubMed

Publication types