. 2022 Jan 24;5(1):92.
doi: 10.1038/s42003-022-03033-4.

Flanking sequences influence the activity of TET1 and TET2 methylcytosine dioxygenases and affect genomic 5hmC patterns

Affiliations

Flanking sequences influence the activity of TET1 and TET2 methylcytosine dioxygenases and affect genomic 5hmC patterns

Sabrina Adam et al. Commun Biol. .

Abstract

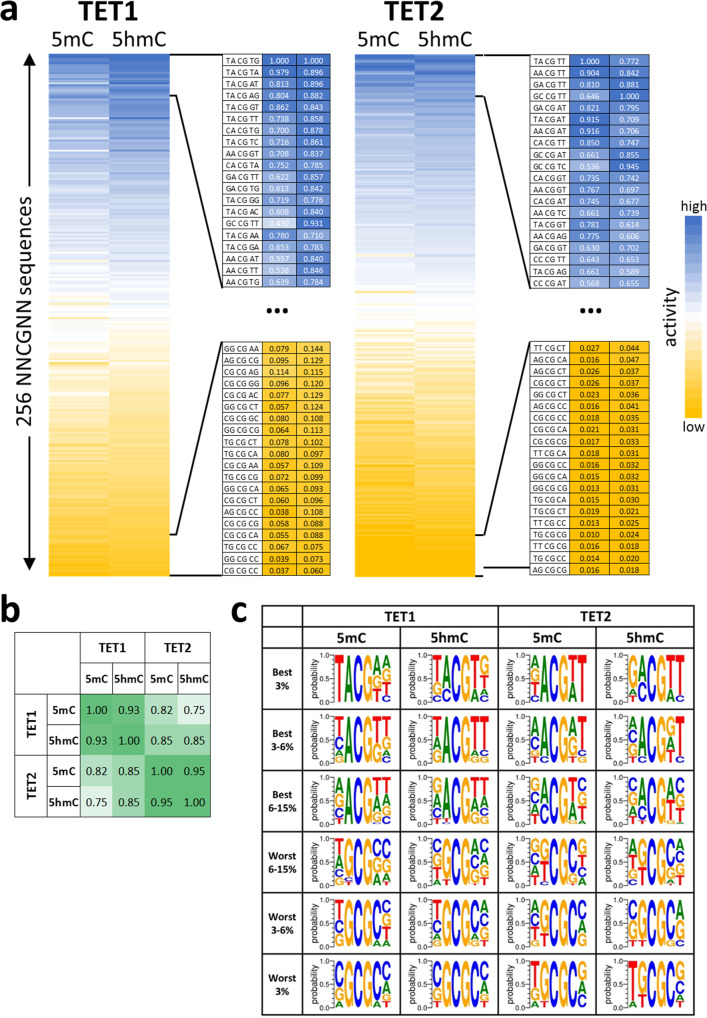
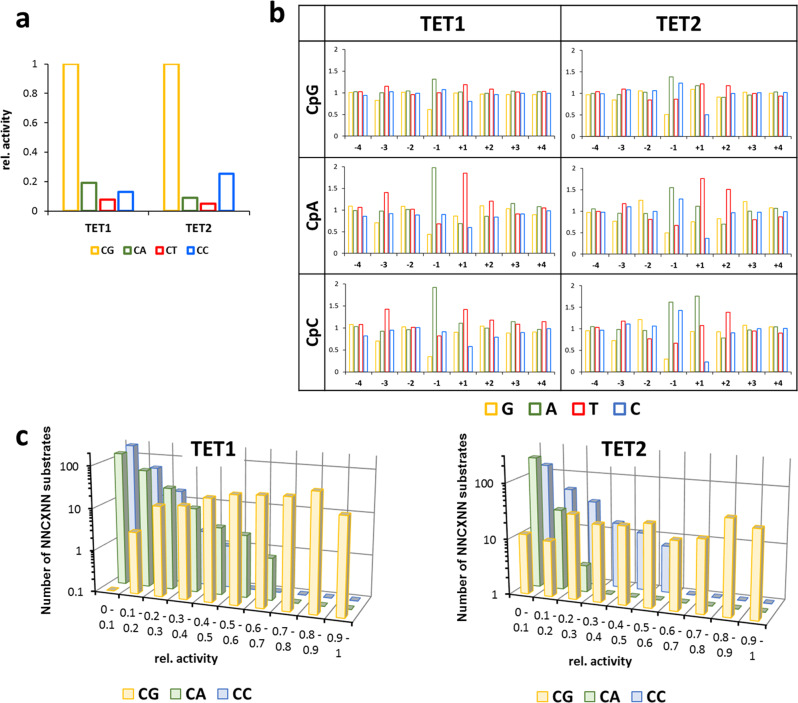
TET dioxygenases convert 5-methylcytosine (5mC) preferentially in a CpG context into 5-hydroxymethylcytosine (5hmC) and higher oxidized forms, thereby initiating DNA demethylation, but details regarding the effects of the DNA sequences flanking the target 5mC site on TET activity are unknown. We investigated oxidation of libraries of DNA substrates containing one 5mC or 5hmC residue in randomized sequence context using single molecule readout of oxidation activity and sequence and show pronounced 20 and 70-fold flanking sequence effects on the catalytic activities of TET1 and TET2, respectively. Flanking sequence preferences were similar for TET1 and TET2 and also for 5mC and 5hmC substrates. Enhanced flanking sequence preferences were observed at non-CpG sites together with profound effects of flanking sequences on the specificity of TET2. TET flanking sequence preferences are reflected in genome-wide and local patterns of 5hmC and DNA demethylation in human and mouse cells indicating that they influence genomic DNA modification patterns in combination with locus specific targeting of TET enzymes.


Conflict of interest statement

The authors declare no competing interests.

Figures

Fig. 1
Fig. 1. Global analysis of flanking sequence effects on mCpG and hmCpG oxidation by TET1 and TET2.
a Principle of the Deep enzymology approach. Libraries of DNA sequences containing one target cytosine (here mCpG) in a randomized context of ten nucleotides on either side are oxidized by TET enzymes and subjected to bisulfite conversion. By NGS the oxidation state and individual DNA sequences of single product molecules are determined (for details cf. Supplementary Fig. 1). b Principle of the first step of the data analysis. At each flanking position, the enrichment and depletion of individual bases in the methylated product pool is determined and expressed as observed/expected (obs/exp) values. c Principle of the second step of the data analysis. Methylation levels are averaged for all 256 NNCGNN sites, thereby revealing combinatorial flanking sequence effects. d Position-specific variance of oxidation of mCpG substrates. For the averaged TET1 and TET2 data sets, the sum of the (obs/exp -1)² values for G, A, T, and C were determined for all −10 to +10 flank positions and plotted after scaling to the largest value. The data show that the −3 to +2 flank positions have the largest influence on the methylation rate. e Average mCpG oxidation levels of substrates containing specific bases at −4 to +4 flank positions by TET1 and TET2. Oxidation levels are given as observed/expected (obs/exp) values. f, g Same as d and e, but referring to hmCpG substrates.
Fig. 2
Fig. 2. Flanking sequence effects on the oxidation of mCpG and hmCpG substrates by TET1 and TET2.
a Heatmap of the average activities of TET1 and TET2 at NNmCpGNN and NNhmCpGNN sites sorted by the average activity. The enlargements show the activity and sequence of the most preferred and disfavored flanking sequences. b Pairwise Pearson correlation factors of the flank profiles shown in panel a. All data were compiled in Supplementary Data 1. c Weblogos of the enrichment of bases at the different flank positions in subsets of the most preferred and disfavored NNCGNN flanking sequences. Weblogos were prepared using WebLogo 3 (http://weblogo.threeplusone.com/).
Fig. 3
Fig. 3. Biochemical investigation of the flanking effect of TET1 and TET2 oxidation kinetics and 5hmC binding by UHRF2.
a Example of oxidation kinetics of synthetic double-stranded 30mer oligonucleotides containing one hemimethylated (5mC) or hemihydroxymethylated (5hmC) CpG site in different flanking context by TET2. Product appearance was detected by LC-MS. Enzyme concentrations of TET1 and TET2 were 1.6/2.0 µM for the favored substrates and 3.2/8 µM for the disfavored substrates. b Kinetic model used to analyze the data. c Summary of rate constants of oxidation of 5mC and 5hmC substrates by TET1 and TET2. Rates are given as relative values considering that in the reactions with the disfavored substrates more enzyme was used. Shown are averages and data points of two independent repeats. d Gel shift experiments with purified UHRF2 SRA domain and synthetic double-stranded 30mer oligonucleotides (0.5 µM) containing one hemihydroxymethylated CpG site (hmCpG), one hemimethylated (mCpG), and one unmodified CpG site in CGCGCC context. e Gel shift experiments with purified UHRF2 SRA domain and synthetic double-stranded 30mer oligonucleotides (0.5 µM) containing one hemihydroxymethylated CpG site in different flanking context.
Fig. 4
Fig. 4. Flanking sequence effects on the oxidation of mCpX substrates by TET1 and TET2.
a Relative oxidation of different CpX (X=G, A, T, or C) substrates. b Average oxidation levels of mCpX substrates containing specific bases at −4 to +4 flank positions. Oxidation levels are given as observed/expected values. c Frequency of NNCXNN substrates within defined ranges of relative activities showing the overlap of activity ranges of preferred non-CpG and disfavored CpG sites.
Fig. 5
Fig. 5. Correlation of genomic DNA modification patterns with flanking sequence preferences of TET1 and TET2.
a Preferences of TET1 and TET2 for bases at the −1 and +1 flank site compared with the enrichment or depletion of bases at these flanking positions in genomic 5hmC pattern and at sites associated with gain of genomic 5mC content after TET1 or TET2 knock-out (KO) in mouse ES cells. b Average genomic 5hmC levels were determined for all NNCGNN sites and compared with average genomic 5mC pattern at the same sites,. Shown are Weblogos of the sites with the highest and lowest ratios of 5hmC and 5mC contents. c Heatmaps of averaged genomic 5hmC levels (5hmC), genomic 5mC levels (5mC), averaged TET flanking sequence preferences (TET), and the prediction of 5hmC levels based on the combination of 5mC levels and TET flanking preferences (Pred). d Scatter plot of genomic 5hmC levels and its prediction from panel c. e The Pearson R-value was determined for the correlation of genomic 5hmC levels and average TET1 and TET2 NNCGNN preferences for regions of 18 consecutive CpG sites sliding over the genome. Frequency plot of the distribution of R-values among all regions. Positive R-values (dark blue bars) indicating a correlation of TET preferences and 5hmC patterns were observed much more frequently than negative R-values (dark red bars). f Ratio of the fractions of regions with positive and negative R-values shown in panel e in the different R-value ranges. g Example regions selected from arbitrary parts of different chromosomes showing the correlation of local 5hmC levels and average TET1 and TET2 NNCGNN preferences. 5hmC level and TET preferences were normalized to the highest and lowest values.
Fig. 6
Fig. 6. Structural details of TET enzyme-DNA complexes.
a Structure of TET2 with the −3 to +2 flanking region of the DNA colored in yellow. b Comparison of two TET2 structures revealing altered positions of the +1 flank base pair (shown in blue and orange) and changes in the hydrogen bonding network (green lines) involved in the recognition of Gua’ (shown in purple). c Comparison of three TET structures revealing different conformations of the Gua’ (shown in cyan) depending on the −1 flanking base pair (shown in green and yellow). The other residues of the CpG site are shown in purple.

References

    1. Schubeler D. Function and information content of DNA methylation. Nature. 2015;517:321–326. - PubMed
    1. Ambrosi C, Manzo M, Baubec T. Dynamics and context-dependent roles of DNA methylation. J. Mol. Biol. 2017;429:1459–1475. - PubMed
    1. Jeltsch A, Jurkowska RZ. New concepts in DNA methylation. Trends Biochem. Sci. 2014;39:310–318. - PubMed
    1. Kriaucionis S, Heintz N. The nuclear DNA base 5-hydroxymethylcytosine is present in Purkinje neurons and the brain. Science. 2009;324:929–930. - PMC - PubMed
    1. Tahiliani M, et al. Conversion of 5-methylcytosine to 5-hydroxymethylcytosine in mammalian DNA by MLL partner TET1. Science. 2009;324:930–935. - PMC - PubMed

Publication types