. 2022 Jan 24;5(1):88.
doi: 10.1038/s42003-022-03032-5.

Lamina-specific immunohistochemical signatures in the olfactory bulb of healthy, Alzheimer's and Parkinson's disease patients

Affiliations

Lamina-specific immunohistochemical signatures in the olfactory bulb of healthy, Alzheimer's and Parkinson's disease patients

Helen C Murray et al. Commun Biol. .

Abstract

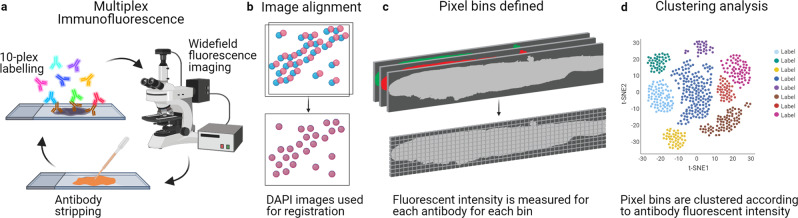
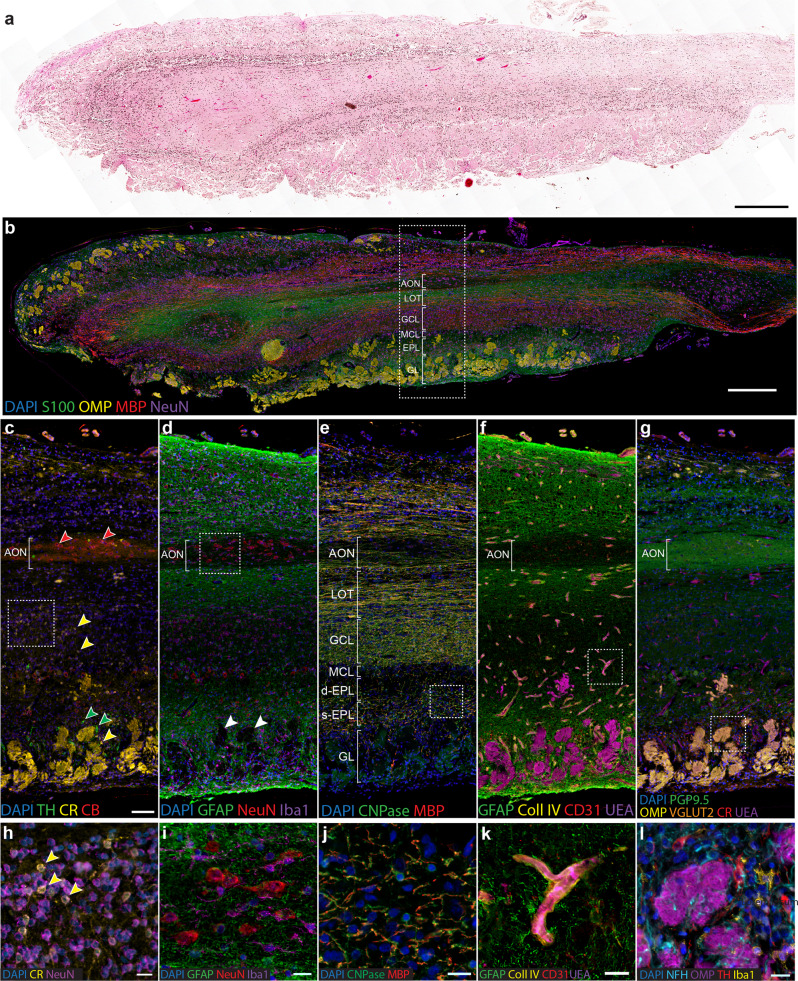
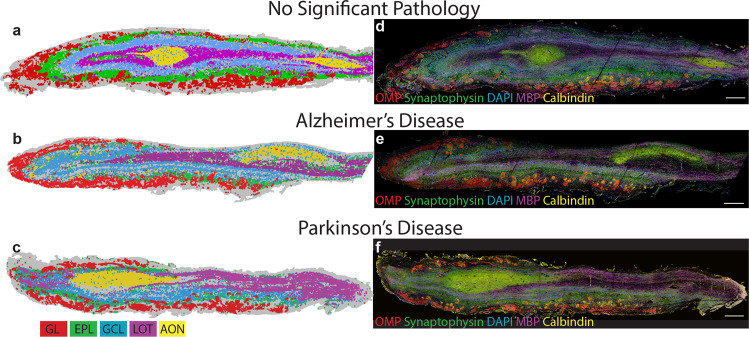
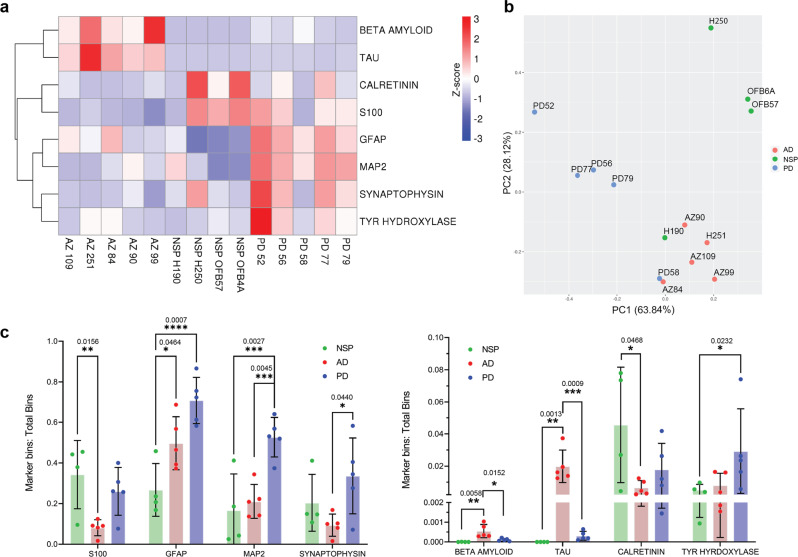
Traditional neuroanatomy immunohistology studies involve low-content analyses of a few antibodies of interest, typically applied and compared across sequential tissue sections. The efficiency, consistency, and ultimate insights of these studies can be substantially improved using high-plex immunofluorescence labelling on a single tissue section to allow direct comparison of many markers. Here we present an expanded and efficient multiplexed fluorescence-based immunohistochemistry (MP-IHC) approach that improves throughput with sequential labelling of up to 10 antibodies per cycle, with no limitation on the number of cycles, and maintains versatility and accessibility by using readily available commercial reagents and standard epifluorescence microscopy imaging. We demonstrate this approach by cumulatively screening up to 100 markers on formalin-fixed paraffin-embedded sections of human olfactory bulb sourced from neurologically normal (no significant pathology), Alzheimer's (AD), and Parkinson's disease (PD) patients. This brain region is involved early in the symptomology and pathophysiology of AD and PD. We also developed a spatial pixel bin analysis approach for unsupervised analysis of the high-content anatomical information from large tissue sections. Here, we present a comprehensive immunohistological characterisation of human olfactory bulb anatomy and a summary of differentially expressed biomarkers in AD and PD using the MP-IHC labelling and spatial protein analysis pipeline.


Conflict of interest statement

The authors declare no competing interests.

Figures

Fig. 1
Fig. 1. MP-IHC and spatial protein analysis methodology.
a Sections were labelled using iterative rounds of 10-plex fluorescent immunohistochemistry, imaging and antibody stripping. b The images from each labelling round were manually aligned in photoshop using the DAPI channel from each round as a reference. c The aligned images were imported into R, and 10 × 10 μm pixel bins were calculated with the x-y coordinates of each bin captured. The fluorescence intensity of each antibody label was measured for each pixel bin. d Spatial protein analysis was performed using R and the Seurat library to generate UMAP plots of bin clusters and identify differential markers between disease groups. Created with BioRender.com.
Fig. 2
Fig. 2. Overview of MP-IHC labelling of the human olfactory bulb.
NSP human olfactory bulb stained with H&E (a) and MP-IHC (b) illustrating that the laminar structure is easily identified using a combination of markers. Magnified region marked by the dotted box in (b) illustrating the laminar organisation of different cell populations (c, d, g), axon tracts (e) and blood vessels (f). c Tyrosine hydroxylase (TH), calretinin (CR), and calbindin (CB) labelling identify different neuronal populations within layers of the olfactory bulb. Tyrosine hydroxylase+ neurons (green arrows) are periglomerular, calretinin (yellow arrows) identifies a subpopulation of granule cells, periglomerular cells and the glomeruli, and calbindin (red arrows) labels AON neurons. d Distribution of astrocytes (GFAP), microglia (Iba1) and neurons (NeuN), illustrating the relative lack of astrocyte processes in the glomeruli (white arrows) and AON, and ubiquitous distribution of microglia. e Orientation of myelinated axons in each layer. Within the external plexiform layer (EPL) and granule cell layer (GCL), myelinated fibres are randomly orientated. The deep external plexiform (d-EPL) sublayer can be delineated based on the relative lack of myelinated axons compared to the superficial (s-EPL) sublayer. The lateral olfactory tract (LOT) surrounding the AON consists of a longitudinal axon tract travelling toward the cortex. f Blood vessels are longitudinal to the sagittal plane in the LOT and transverse in the GCL and EPL. g Glomeruli labelled using a range of antibodies including PGP9.5, OMP, VGLUT2, calretinin and UEA-I lectin. PGP9.5 also allows for delineation of the AON boundary. (h) Magnified region marked by the dotted box in (c) illustrating the calretinin+ subpopulation of granule cells. (i) Magnified region marked by the dotted box in (d) showing distribution of astrocytes (GFAP), microglia (Iba1) and neurons (NeuN) in the AON. (j) Magnified region marked by the dotted box in (e), CNPase+ oligodendrocyte processes wrapped around myelinated axons illustrating the structure of these axons. k Magnified region marked by the dotted box in (f), MP-IHC allows for simultaneous visualisation of the blood-brain barrier components, including collagen IV+ basement membrane, UEA-I lectin+ endothelium, CD31+ endothelial cells and GFAP+ astrocytes. l Magnified region marked by the dotted box in (g), the glomerular microenvironment: neurofilaments within OMP + glomeruli, surrounded by tyrosine hydroxylase+ periglomerular cells and Iba1+ microglia. Scale bars (a, b) 500 μm, (cg) 100 μm, (hl) 20 μm.
Fig. 3
Fig. 3. Individual section cluster analysis for NSP case H190.
a UMAP of pixel bin data coloured by cluster. b Heat map of z-score of labelling intensity for markers within each cluster. Clusters are organised based on a hierarchical tree. Each cluster is identified by a number and a three-letter code indicating the layer it is localised to, based on visual inspection of the slide plot for that cluster, as well as the one or two most intensely labelled or distinct markers for that cluster. c Individual slide plots of clusters 0–19 illustrating the unique spatial distribution of each cluster. AON anterior olfactory nucleus, BVs blood vessels. EPL external plexiform layer, GL glomerular layer, GCL granule cell layer, LOT lateral olfactory tract, P-GL peri-glomerular.
Fig. 4
Fig. 4. Olfactory bulb layer signatures determined by individual section cluster analysis are consistent between cases.
For each section, clusters were assigned to one of five layers (glomerular layer, GL; external plexiform layer, EPL; granule cell layer, GCL; lateral olfactory tract, LOT; or anterior olfactory nucleus, AON) based on visual inspection of the slide plot. The markers with the highest z-score of labelling intensity were noted for all clusters within a layer and the most conserved markers for each layer were determined to be the layer signature. The clusters with highest expression of signature markers for each layer are overlaid for one representative NSP (a), AD (b) and PD (c) case. The clusters have been pseudo-coloured by layer. The immunolabelling for one signature marker from each layer is also presented (df). The layer signature is consistent between cases and disease groups. Scale bars 500 μm (af).
Fig. 5
Fig. 5. Analysis of differentially expressed markers between NSP, AD and PD bulbs.
The ratio of labelled bins to total bins was determined for each marker and each case. Markers were determined to be differentially expressed based on an uncorrected ANOVA P value < 0.1. a Heat map of the ratio of labelled bins to total bins for differentially expressed markers for each case. b PCA scatterplot of cases coloured by group identity. c Graph of labelled bins to total bins ratio per case for differentially expressed markers, n = 4 NSP cases, 5 AD cases and 5 PD cases. Error bars are standard deviation of ratio for each case within the group. *P ≤ 0.05, **P ≤ 0.01, ***P ≤ 0.001, ****P ≤ 0.0001. Exact P values are stated above the comparison.
Fig. 6
Fig. 6. Tau string analysis for AD cases.
The combinations of markers that co-occur with tau were investigated by generating a binary string marker signature. To do this, a Poisson P value was determined for each marker and each bin in the ‘pseudo’ count matrix and the bins with a P value < 0.05 were coded as ‘1’ while the rest were ‘0’. For each bin, the binary values for each marker were concatenated into a string and the frequency of each string was tested for differences between bulbs using a Kruskal-Wallis test. Strings with a p value < 0.05 were determined to be differential between bulbs and plotted here. a Slide plots of differentially expressed tau+ pixel bins plotted according to their x-y coordinates for each AD case, coloured by tau string identity. These tau+ bins are in discrete areas of the bulb that correspond to the AON. b Heat map indicating the marker combinations that are present in the differentially expressed strings containing tau. Various permutations of the same eight markers are determined to be differentially expressed.

References

    1. Gerdes MJ, et al. Highly multiplexed single-cell analysis of formalin-fixed, paraffin-embedded cancer tissue. Proc. Natl. Acad. Sci. USA. 2013;110:11982–11987. - PMC - PubMed
    1. Stack EC, Wang C, Roman KA, Hoyt CC. Multiplexed immunohistochemistry, imaging, and quantitation: A review, with an assessment of Tyramide signal amplification, multispectral imaging and multiplex analysis. Methods. 2014;70:46–58. - PubMed
    1. Micheva KD, Smith SJ. Array tomography: a new tool for imaging the molecular architecture and ultrastructure of neural circuits. Neuron. 2007;55:25–36. - PMC - PubMed
    1. Lin J-R, et al. Highly multiplexed immunofluorescence imaging of human tissues and tumors using t-CyCIF and conventional optical microscopes. eLife. 2018;7:1–46. - PMC - PubMed
    1. Gut, G., Herrmann, M. D. & Pelkmans, L. Multiplexed protein maps link subcellular organization to cellular states. Science (New York, N.Y.) 361, 1–13 (2018). - PubMed

Publication types