. 2022 Jan;28(1):104-116.
doi: 10.1038/s41591-021-01615-z. Epub 2022 Jan 24.

Antisense oligonucleotide silencing of FUS expression as a therapeutic approach in amyotrophic lateral sclerosis

Affiliations

Antisense oligonucleotide silencing of FUS expression as a therapeutic approach in amyotrophic lateral sclerosis

Vladislav A Korobeynikov et al. Nat Med. 2022 Jan.

Abstract

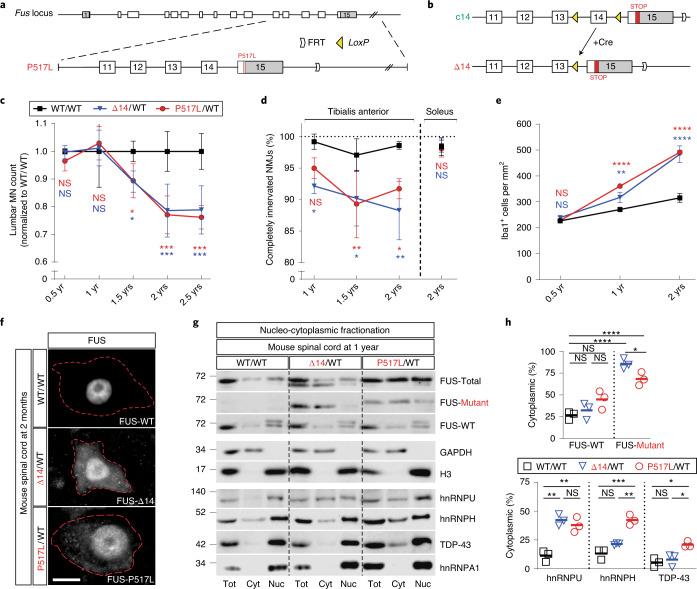
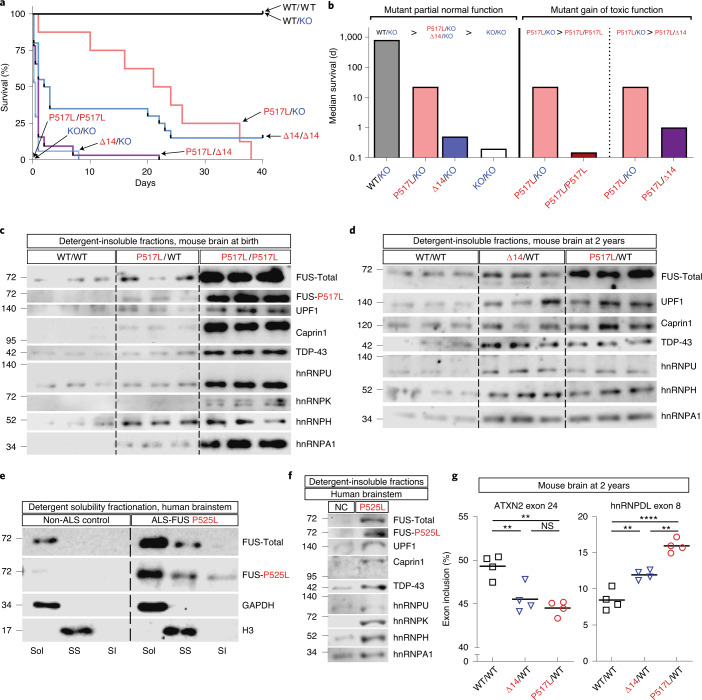
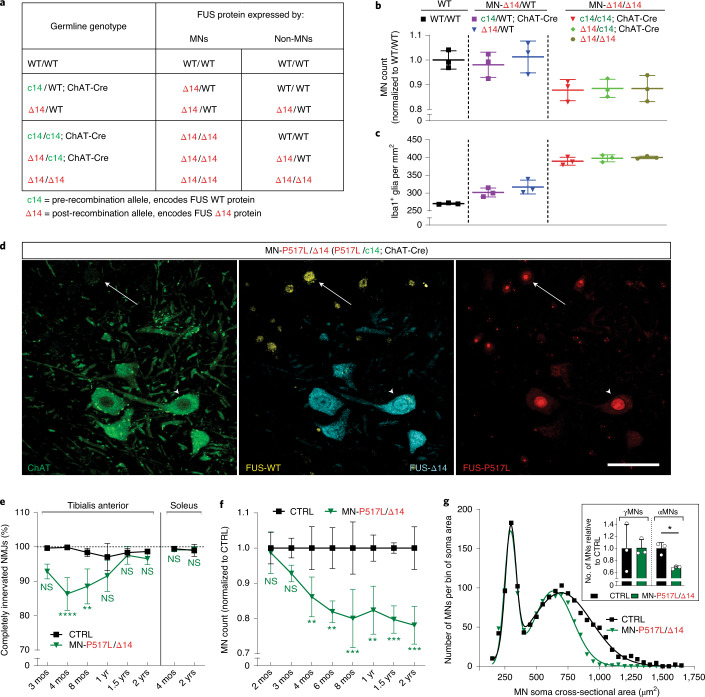
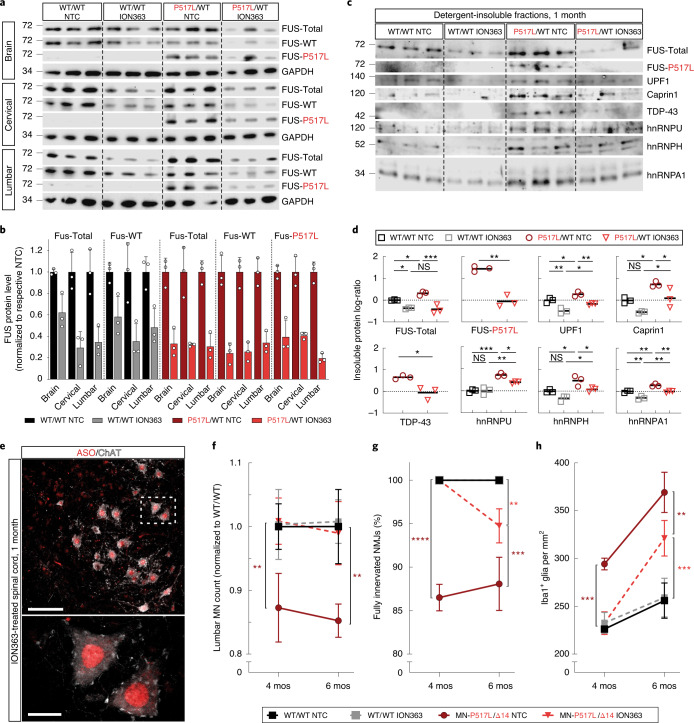
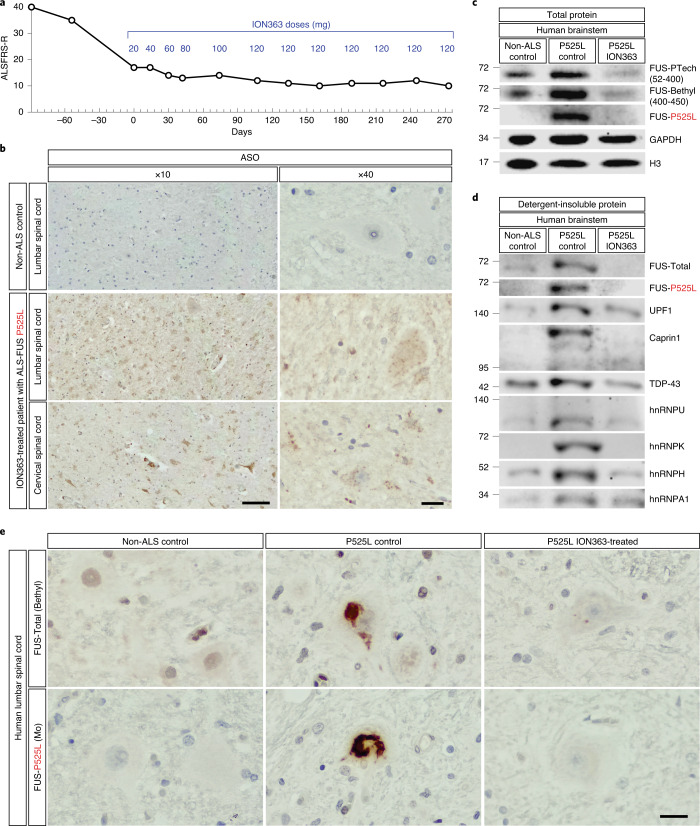
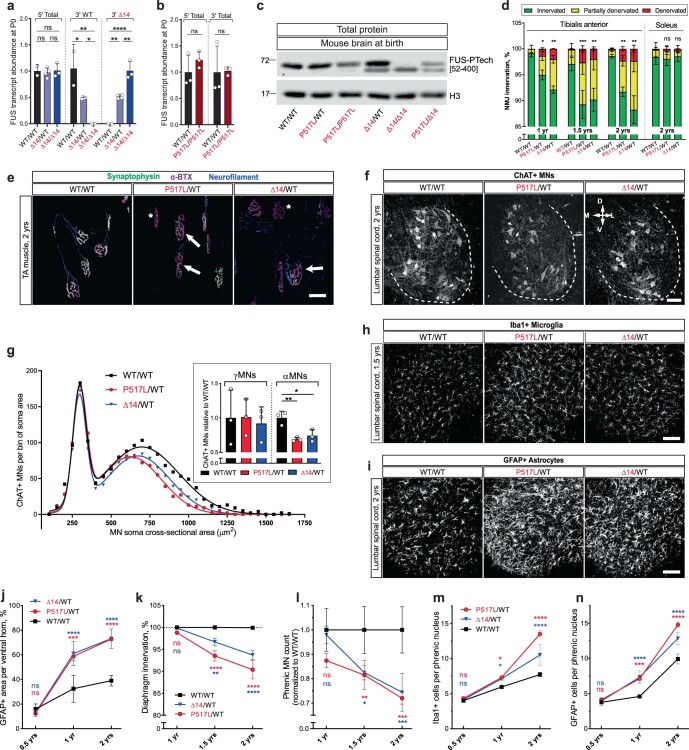
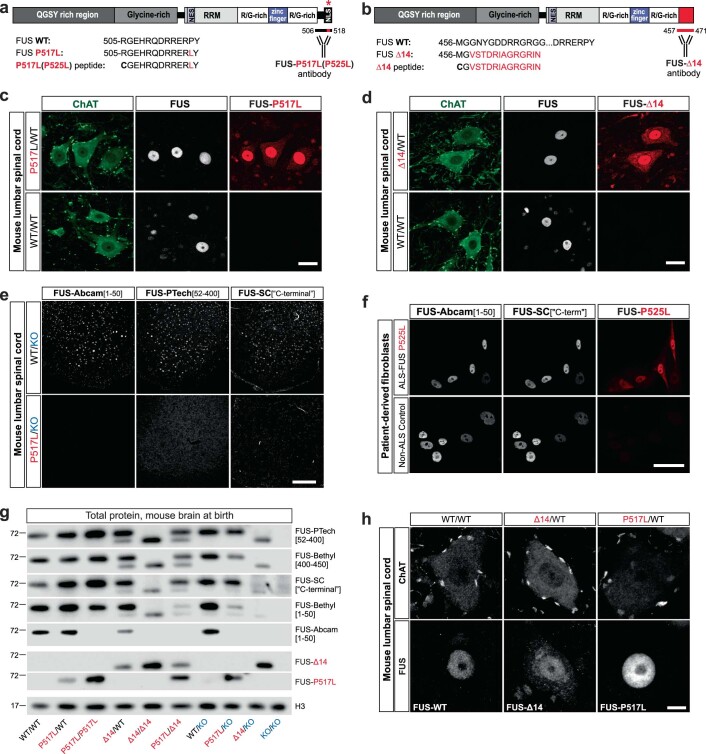
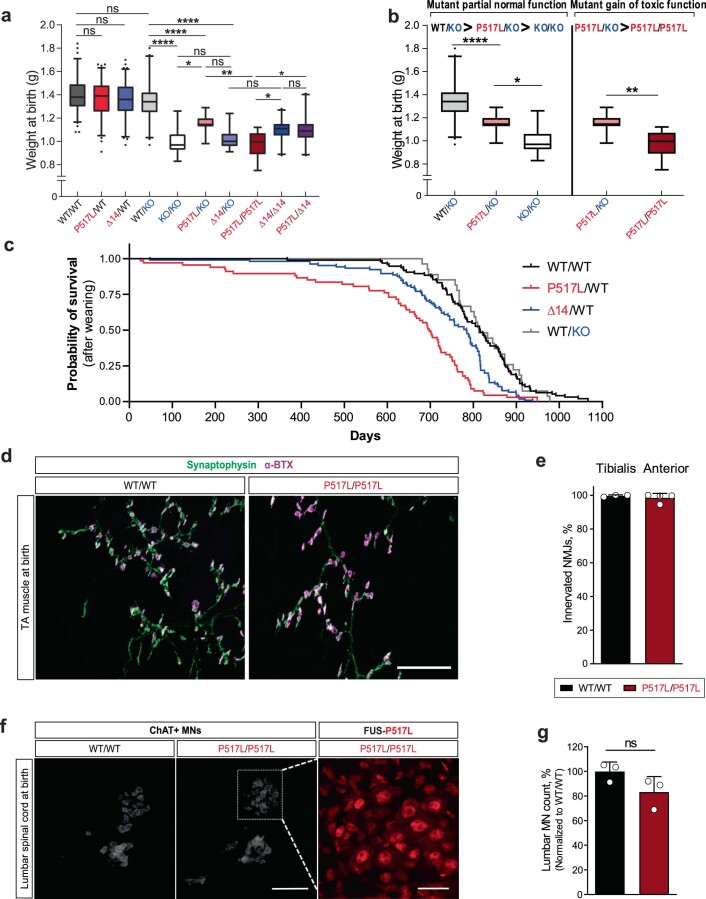
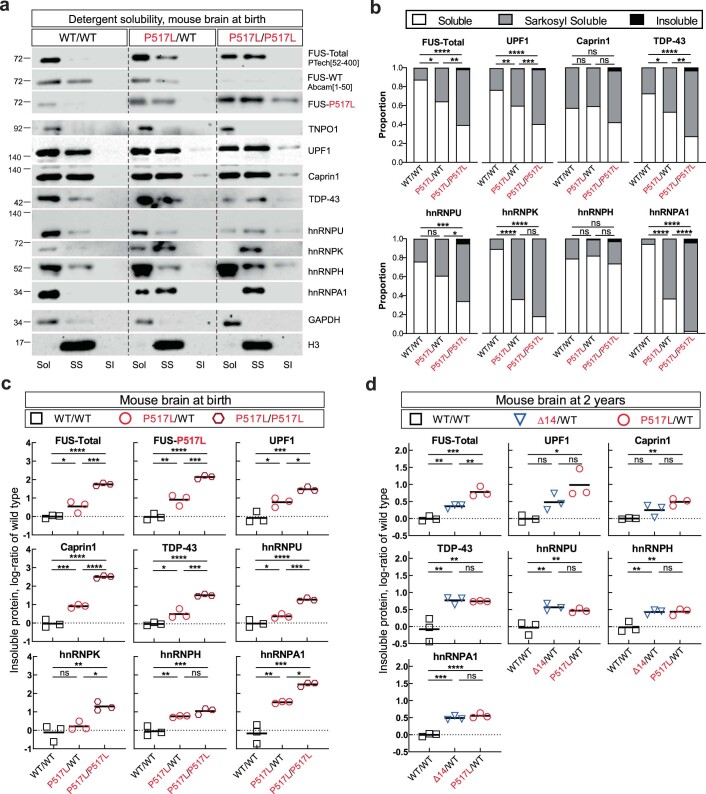
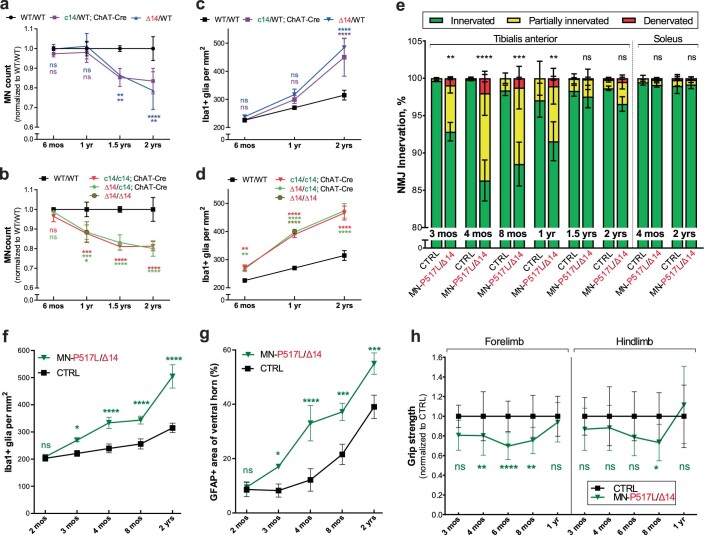
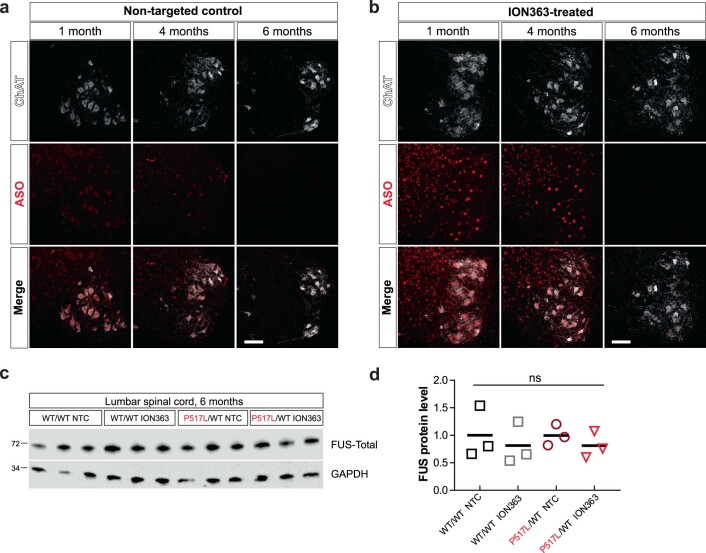
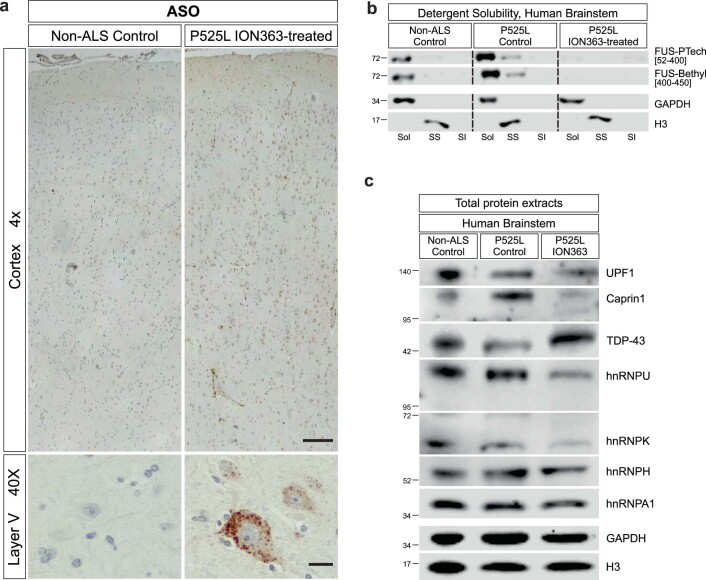
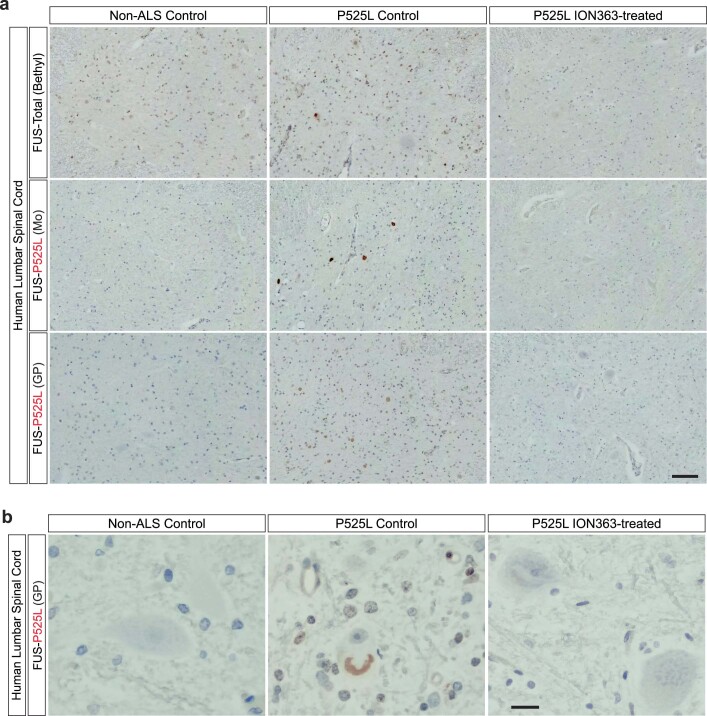
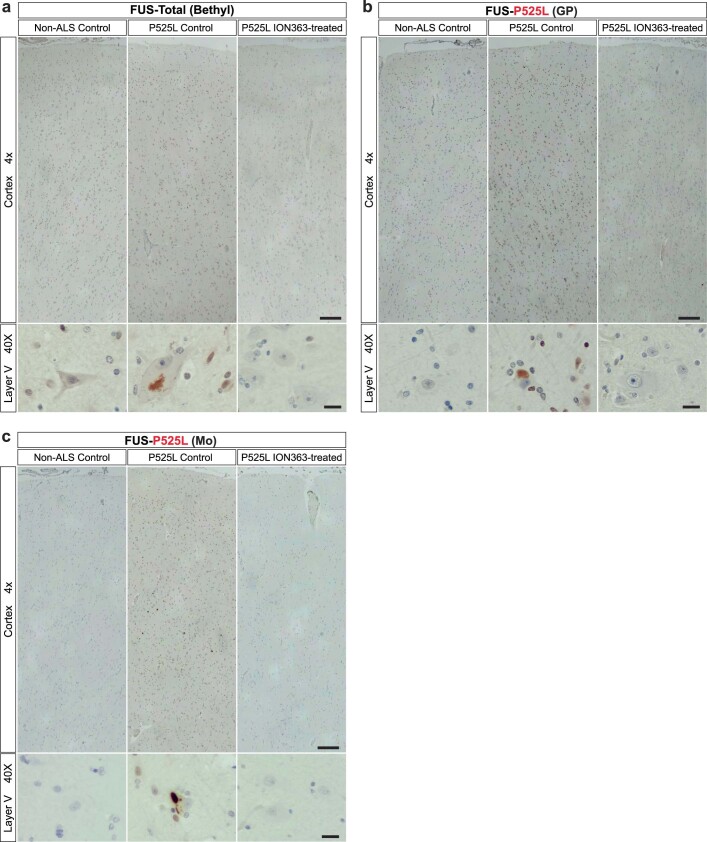
Fused in sarcoma (FUS) is an RNA-binding protein that is genetically and pathologically associated with rare and aggressive forms of amyotrophic lateral sclerosis (ALS) and frontotemporal dementia (FTD). To explore the mechanisms by which mutant FUS causes neurodegeneration in ALS-FTD, we generated a series of FUS knock-in mouse lines that express the equivalent of ALS-associated mutant FUSP525L and FUSΔEX14 protein. In FUS mutant mice, we show progressive, age-dependent motor neuron loss as a consequence of a dose-dependent gain of toxic function, associated with the insolubility of FUS and related RNA-binding proteins. In this disease-relevant mouse model of ALS-FUS, we show that ION363, a non-allele-specific FUS antisense oligonucleotide, efficiently silences Fus and reduces postnatal levels of FUS protein in the brain and spinal cord, delaying motor neuron degeneration. In a patient with ALS with a FUSP525L mutation, we provide preliminary evidence that repeated intrathecal infusions of ION363 lower wild-type and mutant FUS levels in the central nervous system, resulting in a marked reduction in the burden of FUS aggregates that are a pathological hallmark of disease. In mouse genetic and human clinical studies, we provide evidence in support of FUS silencing as a therapeutic strategy in FUS-dependent ALS and FTD.


Conflict of interest statement

P.J.-N. is employed by Ionis Pharmaceuticals, a for-profit company that develops ASO therapies. The other authors declare no competing interests.

Figures

Fig. 1
Fig. 1. Selective MN degeneration and mislocalization of FUS and other RBPs to the cytoplasm in knock-in mice expressing ALS-associated mutant FUS.
a, Schematic of the creation of mutant Fus knock-in alleles. Top: the murine Fus locus. Bottom: the P517L targeting vector used for homologous recombination. Exons are represented as gray (5′ UTR and 3′ UTR) and white (coding sequence) rectangles. FRT site downstream of the 3′ UTR is the ‘scar’ left after removal of NEO resistance cassette. b, Conditional c14 allele (top) has exon 14 flanked by LoxP sites (yellow triangles). Cre recombinase-dependent recombination at the LoxP sites in c14 excises exon 14 and converts it to the mutant Δ14 allele. In addition, part of the mouse exon 15 (red rectangle) is ‘humanized’—replaced with the corresponding human exon 15 sequence. This modification does not affect the in-frame protein sequence (c14 allele produces wild-type mouse FUS protein) but alters the Δ14 C-terminal amino acid sequence to mirror the out-of-frame reading of human G466VfsX14 mutant exon 15. c, Numbers of ChAT-positive MNs at lumbar levels 4 and 5 in WT/WT (black), P517L/WT (red) and Δ14/WT (blue) animals normalized to the wild-type controls. n = 3 animals per group at 1 and 2 years and n = 5 animals per group at 1.5 years. d, Percentage of completely innervated NMJs (that is, not partially or completely denervated) in tibialis anterior (left) and soleus (right) muscles of WT/WT (black), P517L/WT (red) and Δ14/WT (blue) animals. n = 3 animals per group at 1 and 2 years and n = 4 animals per group at 1.5 years. e, Density of Iba1-positive microglial cells at lumbar levels 4 and 5 in WT/WT (black), P517L/WT (red) and Δ14/WT (blue) animals. n = 3 animals per group. f, Representative images of MNs from spinal cord sections of 2-month-old WT/WT, Δ14/WT and P517L/WT animals stained with FUS-Abcam[1-50], FUS-Δ14 and FUS-P517L antibodies, respectively. Red dotted lines outline MN somata. Scale bar, 10 µm. g,h, Blot (g) and quantification (h) of nucleo-cytoplasmic fractionation of brain tissue of 1-year-old wild-type (WT/WT) and heterozygous mutant (P517L/WT and Δ14/WT) animals showing mislocalization of mutant FUS and other RBPs to the cytoplasm in the mutant mice. *P < 0.05, **P < 0.01 and ***P < 0.001, using one-way ANOVA with Tukey’s post hoc test. n = 3 for all genotypes. Individual values and means are shown. For c, d and e: *P < 0.05, **P < 0.01 and ***P < 0.001, using two-way ANOVA with Tukey’s post hoc test. Data are shown as mean ± s.d. NS, not significant. Source data
Fig. 2
Fig. 2. Dose-dependent toxicity and detergent insolubility of mutant FUS.
a, Kaplan–Meier survival curves for mice with the indicated combinations of Fus WT, P517L, Δ14 and null-knockout alleles. b, Median survival of selected genotypes plotted on logarithmic scale illustrates partial functionality and dose-dependent toxicity of mutant FUS. Increased survival of P517L/KO and Δ14/KO compared with KO/KO animals shows that mutant FUS protein is able to partially rescue the null phenotype and, thus, is functional. Comparison of P517L/P517L and P517L/Δ14 versus P517L/KO animals shows that further addition of mutant FUS protein decreases survival, consistent with dose-dependent toxicity of mutant FUS protein. Median survival was estimated for P517L/P517L (0.15 d) and KO/KO (0.2 d), as most newborn pups for these genotypes were found dead and, thus, could not be accurately quantified. The bar for P517L/KO is reproduced three times for comparison purposes. c, Immunoblot of sarkosyl-insoluble fractions from brains of newborn Fus WT/WT, heterozygous P517L/WT and homozygous P517L/P517L mice. Each lane corresponds to a separate animal. d, Immunoblot of sarkosyl-insoluble fractions from brains of 2-year-old Fus WT/WT and heterozygous P517L/WT and Δ14/WT mice. Each lane corresponds to a separate animal. e, Immunoblot of sarkosyl solubility fractionation of human brain stems of a non-ALS control and a patient with ALS-FUS P525L. f, Immunoblot of sarkosyl-insoluble fractions from human brain stem samples from a non-ALS control and a patient with ALS-FUS P525L. g, Relative abundance of inclusion isoforms of exons regulated by hnRNPH. The observed pattern is consistent with functional deficiency of hnRNPH, which promotes inclusion of exon 24 of ATXN2 (left) and inhibits the inclusion of exon 8 of hnRNPDL transcript (right). *P < 0.05, **P < 0.01 and ***P < 0.001, using one-way ANOVA with Tukey’s post hoc test. n = 4 animals per genotype. SI, sarkosyl insoluble; Sol, soluble (in hypotonic buffer); SS, sarkosyl soluble (in 1% sarkosyl and high salt). Source data
Fig. 3
Fig. 3. Increased dosage of mutant FUS in MNs accelerates selective MN degeneration.
a, Table relating the indicated mouse genotypes to WT and Δ14 FUS protein expression in MN and non-MN cells. b, Numbers of ChAT-positive MNs at lumbar levels 4 and 5 in 1-year-old WT/WT (left), MN-Δ14/WT (middle, c14/WT; ChAT-Cre and Δ14/WT) and MN-Δ14/Δ14 (right, c14/c14; ChAT-Cre, Δ14/c14; ChAT-Cre and Δ14/Δ14) animals normalized to the wild-type controls. Each of the MN-Δ14/Δ14 genotypes shows fewer lumbar MNs in comparison to either of MN-Δ14/WT genotypes or WT/WT group, using one-way ANOVA followed by Fisher’s least significant difference. Data are shown as mean ± s.d. n = 3 animals per genotype. c, Density of Iba1-positive microglial cells at lumbar levels 4 and 5 in 1-year-old WT/WT (left, black), MN-Δ14/WT (middle, c14/WT; ChAT-Cre and Δ14/WT) and MN-Δ14/Δ14 (right, c14/c14; ChAT-Cre, Δ14/c14; ChAT-Cre and Δ14/Δ14) animals. Each of the MN-Δ14/WT genotypes show an increase in microglial density in comparison to WT/WT animals. Each of the MN-Δ14/Δ14 genotypes has increased microglial density in comparison to either of MN-Δ14/WT genotypes or WT/WT group. Statistical significance was determined by one-way ANOVA with Tukey’s post hoc test. Data are shown as mean ± s.d. n = 3 animals per genotype. d, Immunostaining of lumbar spinal cord sections of adult MN-P517L/Δ14 (P517L/c14; ChAT-Cre) animals using anti-ChAT (green), anti-FUS-WT (Abcam[1-50], yellow), anti-FUS-Δ14 (cyan) and mouse monoclonal anti-FUS-P517L (red) antibodies. Note anti-FUS-P517L staining in all cells, anti-FUS-Δ14 staining only in ChAT-positive cells and anti-FUS-WT staining only in ChAT-negative cells. Scale bar, 100 µm. e, Percentage of completely innervated NMJs (that is, not partially or completely denervated) in TA (left) and soleus (right) muscles of CTRL (FUS WT-expressing control, black) and MN-P517L/Δ14 (P517L/c14; ChAT-Cre, green) animals. f, MN numbers at lumbar level 4 and 5 of CTRL (FUS WT-expressing control, black) and MN-P517L/Δ14 (P517L/c14; ChAT-Cre, green) animals normalized to the controls. g, Histogram of MN soma cross-sectional areas of CTRL (FUS WT-expressing control, black) and MN-P517L/Δ14 (P517L/c14; ChAT-Cre, green) animals. MNs with soma area ≥475 µm2 were classified as alpha-MNs, and MNs with soma area <475 µm2 were classified as gamma-MNs. Inset shows the numbers of ChAT-positive gamma-MNs (left) or alpha-MNs (right) at lumbar levels 4 and 5 in 2-year-old CTRL (FUS WT-expressing control, black) and MN-P517L/Δ14 (P517L/c14; ChAT-Cre, green) animals normalized to the controls. *P < 0.05, **P < 0.01 and ***P < 0.001, using Welch’s t-test. Data are shown as mean ± s.d. n = 3 animals per group. For e and f, *P < 0.05, **P < 0.01 and ***P < 0.001, using two-way ANOVA with Sidak´s post hoc test. Data are shown as mean ± s.d. n = 3 animals per group. CTRL, littermate c14/WT and/or c14/c14 animals depending on the breeding scheme.
Fig. 4
Fig. 4. Efficacy of the FUS ASO ION363 in FUS-ALS knock-in mice.
a, Immunoblot probed with anti-FUS antibodies of brain and cervical or lumbar spinal cord protein lysates of 1-month-old WT/WT and P517L/WT animals treated with NTC or anti-FUS oligonucleotide (ION363). Each band in a row represents a separate animal. b, Quantitation of total, WT and P517L FUS protein levels shown in a. Welch’s t-test was used for comparisons of NTC versus ION363 within each genotype and neuroanatomical region. Data are shown as mean ± s.d. n = 3 animals per group. c, Immunoblot of brain sarkosyl-insoluble fractions of 1-month-old WT/WT and P517L/WT animals treated with NTC or anti-FUS oligonucleotide (ION363). Each lane represents a separate animal. d, Quantitation of protein in sarkosyl-insoluble fractions shown in c, expressed as log-ratio of P517L/WT ION363 for FUS-P517L and TDP-43 and as log-ratio of WT/WT NTC for all others. *P < 0.05, **P < 0.01 and ***P < 0.001, using one-way ANOVA with Tukey´s post hoc test for comparison of four groups and Welch’s t-test for two groups. n = 3 animals per group. Individual values and means are shown. e, Immunostaining of lumbar spinal cord sections of a 1-month-old ION363-treated animal with anti-ASO (red) and anti-ChAT (white) antibodies showing broad distribution of ION363 to MNs and other cells and predominantly nuclear localization. Scale bar, 100 µm at ×20 and 20 µm at ×100. f, Numbers of ChAT-positive MNs at lumbar levels 4 and 5 in NTC-treated FUS WT-expressing CTRL (black), ION363-treated FUS WT-expressing CTRL (gray), NTC-treated MN-P517L/Δ14 (dark red) and ION363-treated MN-P517L/Δ14 (light red) animals normalized to the NTC-treated FUS WT-expressing CTRL. g, Percentage of fully innervated NMJs in the TA muscles in NTC-treated FUS WT-expressing CTRL (black), ION363-treated FUS WT-expressing CTRL (gray), NTC-treated MN-P517L/Δ14 (dark red) and ION363-treated MN-P517L/Δ14 (light red) animals. h, Density of Iba1-positive microglial cells at lumbar levels 4 and 5 in NTC-treated FUS WT-expressing CTRL (black), ION363-treated FUS WT-expressing CTRL (gray), NTC-treated MN-P517L/Δ14 (dark red) and ION363-treated MN-P517L/Δ14 (light red) animals. For fh, *P < 0.05, **P < 0.01 and ***P < 0.001, using two-way ANOVA with Tukey’s post hoc test. Data are shown as mean ± s.d. n = 3 animals per group. Source data
Fig. 5
Fig. 5. First-in-human treatment with ION363 silences FUS expression, decreases FUS pathology and reverses insolubility of RBPs in an ALS-FUSP525L patient.
a, Timeline of patient J.H.’s ALSFRS-R scores relative to ION363 infusions. Treatment started with 20 mg of ION363 on day 0 and escalated to 120 mg per dose. A total of 12 infusions was administered. Numbers above open circles indicate ION363 doses in milligrams. b, Anti-ASO immunohistochemical staining of formalin-fixed, paraffin-embedded (FFPE) sections of lumbar spinal cord from a non-ALS control (top) and lumbar (middle) and cervical (bottom) spinal cord from ION363-treated ALS-FUSP525L patient. Scale bars, 100 µm at ×10 and 20 µm at ×40. c, Immunoblot of brainstem tissue from a non-ALS control, an ALS-FUSP525L control patient and an ION363-treated patient with ALS-FUSP525L probed with antibodies against non-overlapping epitopes of FUS. d, Immunoblot of equal volumes of sarkosyl-insoluble fractions from brainstem tissue from a non-ALS control, an ALS-FUSP525L control patient and an ION363-treated patient with ALS-FUSP525L probed with antibodies against total FUS (FUS-Proteintech[52-400]), FUS-P525L and other RBPs. e, Immunohistochemical staining of FFPE sections from lumbar spinal cord of a non-ALS control, an ALS-FUSP525L control patient and an ION363-treated patient with ALS-FUSP525L with an antibody against total FUS (FUS-Bethyl[400-450]; top) and monoclonal (Mo) P525L-specific antibody reactive to FUS aggregates (bottom). Scale bar, 20 µm. Source data
Extended Data Fig. 1
Extended Data Fig. 1. ALS-like pathology in mutant FUS knock-in mice.
(a) RT-qPCR quantification of newborn (P0) brain Fus transcripts in wild type (WT/WT), Fus Δ14 heterozygous (Δ14/WT) and Fus Δ14 homozygous (Δ14/Δ14) animals using primers positioned in exons 1–3 of the Fus transcript that amplify WT and Δ14 equally (5’ Total), primers spanning exon 13–14 junction specific to the WT Fus transcript (3’ WT), or primers spanning exon 13–15 junction specific to the Δ14 Fus transcript (3’ Δ14). Transcript abundances were normalized to WT/WT for ‘5’ Total’ and ‘3’ WT” and to Δ14/ Δ14 for ‘3’ Δ14’. N = 2, 4, and 3 for WT/WT, Δ14/WT, and Δ14/ Δ14 respectively. *P < 0.05, **P < 0.01 and ***P < 0.001, using one-way ANOVA with Tukey’s post hoc test. Data shown as mean ± SD. (b) RT-qPCR quantification of newborn (P0) brain Fus transcripts in wild type (WT/WT) and Fus 517L homozygous (P517L/P517L) animals using primers positioned in exons 1–3 (5’ Total) or in exons 13–14 (3’ Total) of the Fus transcript that amplify WT and 517L equally. Transcript abundances were normalized to WT/WT. N = 3 animals of each genotype for each group. Statistical significance was assessed using Welch’s t-test. Data shown as mean ± SD. (c) Representative immunoblot of brain total protein extracts from newborn animals using FUS-PTech[52–400] antibody. (d) Percentages of NMJs classified as fully innervated (green), partially denervated (yellow), and fully denervated (red) in the tibialis anterior (left) and soleus (right) muscles in WT/WT, P517L/WT, and Δ14/WT animals. *P < 0.05, **P < 0.01 and ***P < 0.001 indicates significant differences in fully denervated NMJs between the corresponding genotype and WT controls using two-way ANOVA with Dunnett’s post hoc test. Data shown as mean ± SD. N = 3 animals per group at 1 and 2 years and 4 animals per group at 1.5 years. (e) Representative images of tibialis anterior (TA) muscle innervation in 2-year-old WT/WT (left), P517L/WT (middle), and Δ14/WT (right) animals. Muscle innervation was determined by co-localization of markers for motor axon terminals (anti-synaptophysin antibody, green) and post-synaptic NMJ acetylcholine receptors (fluorophore-conjugated α-bungarotoxin, or α-BTX, magenta). In addition, motor axons were labeled with anti-neurofilament antibody (blue). White asterisks indicate fully denervated motor endplates (prominent α-BTX with no overlapping synaptophysin, absent neurofilament) and white arrows indicate partially denervated NMJs (partial overlap of synaptophysin and α-BTX, presence of neurofilament). Scale bar=50 µm. (f) Representative images of lumbar level 5 (L5) spinal cord ventral horns of 2-year-old WT/WT (left), P517L/WT (middle), and Δ14/WT (right) animals stained with anti-ChAT antibody (white). Compass mark indicates dorsal (D), ventral (V), medial (M) or lateral (L) orientation. Scale bar=100 µm. (g) Histogram of MN soma cross-sectional areas of WT/WT (black), P517L/WT (red), and Δ14/WT (blue) animals. MNs with soma area ≥475 µm2 were classified as α and < 475 µm2 as γMNs. Inset shows the numbers of ChAT-positive γMNs (left) or αMNs (right) at lumbar levels 4 and 5 in 2-year-old WT/WT (black), P517L/WT (red), and Δ14/WT (blue) animals normalized to the wild type controls. *P < 0.05, **P < 0.01 and ***P < 0.001 using one-way ANOVA with Tukey’s post hoc test. Data shown as mean ± SD. N = 3 animals per group. (h) Representative images of lumbar level 5 (L5) spinal cord ventral horns of 1.5-year-old WT/WT (left), P517L/WT (middle), and Δ14/WT (right) animals stained with anti-Iba1 antibody (white). Scale bar=100 µm. (i) Representative images of lumbar level 5 (L5) spinal cord ventral horns of 2-year-old WT/WT (left), P517L/WT (middle), and Δ14/WT (right) animals stained with anti-GFAP antibody (white). Scale bar=100 µm. (j) Percentage of cross-sectional area that is GFAP-positive at lumbar levels 4 and 5 in WT/WT (black), P517L/WT (red), and Δ14/WT (blue) animals. (k) Percentage of completely innervated NMJs (that is, not partially or completely denervated) in the diaphragm muscles WT/WT (black), P517L/WT (red), and Δ14/WT (blue) animals. (l) Numbers of ChAT positive motor neurons in phrenic nucleus at cervical levels 3 through 5 in WT/WT (black), P517L/WT (red), and Δ14/WT (blue) animals normalized to the wild type controls. (m) Numbers of Iba1-positive microglial cells within phrenic nucleus at cervical levels 3 through 5 in WT/WT (black), P517L/WT (red), and Δ14/WT (blue) animals. (n) Numbers of GFAP-positive astroglial cells within phrenic nucleus at cervical levels 3 through 5 in WT/WT (black), P517L/WT (red), and Δ14/WT (blue) animals. For j-n: *P < 0.05, **P < 0.01 and ***P < 0.001, using two-way ANOVA with Tukey’s post hoc test. Data shown as mean ± SD. N = 3 animals of each genotype for each group. Source data
Extended Data Fig. 2
Extended Data Fig. 2. Variable reactivity of commercial antibodies with mutant FUS: characterization of mutant FUS expression and localization using novel mutant FUS-specific antibodies.
(a, b) Schematics of P517L and Δ14 mutant FUS proteins (top). Mutations are indicated by red asterisk for P517L and red C-terminal rectangle for Δ14. Bottom shows C-terminal amino acid sequences of FUS WT protein, FUS P517L and FUS Δ14 proteins, and the P517L and Δ14 synthetic peptides used for the generation of FUS-P517L and FUS-Δ14 antibodies (bottom). Red letters in the amino acid sequences indicate the residues specific to the FUS mutants. The locations of the epitopes for FUS-P517L and FUS-Δ14 antibodies are marked by horizontal bars below the C-termini of the corresponding schematized mutant proteins (bottom right). The murine and human C-terminal FUS amino acid sequences are conserved, and the illustrated mouse sequences also correspond to the human FUS P525L and Δ14 proteins. (c, d) Immunostaining of adult spinal cord sections of 1-year-old heterozygous mutant (P517L/WT and Δ14/WT) and WT/WT mice using FUS-Abcam[1–50] (FUS, white) and FUS-P517L or FUS-Δ14 (red) antibodies. Note the cytoplasmic staining with FUS-P517L andFUS-Δ14 antibodies in the animals that express the corresponding mutant FUS protein (upper panels) and the absence of staining of wild type FUS protein in WT/WT animals using either the P517L or the Δ14 antibodies (bottom panels). Scale bar: 20 µm. (e) Representative images of spinal cord sections from WT/KO and P517L/KO animals show lack of immunoreactivity of three commercial antibodies with P517L mutant FUS protein. Scale bar=100 µm. (f) Immunostaining of human cultured fibroblasts from an ALS-FUSP525L patient (top) and a non-ALS control (bottom) using two distinct FUSWT antibodies (white) and the FUS-P517L(P525L) antibody (red). Identical confocal microscopy settings (laser power and gain) were used for imaging the top and the bottom panels. Scale bar: 50 µm. (g) Denaturing immunoblot of brains of newborn mice of the indicated genotypes demonstrates variable affinities of five commercially available anti-FUS antibodies for mutant relative to wild type FUS. Note, for example, absence of visible bands for either P517L or Δ14 mutant FUS protein with the FUS-Abcam[1–50] antibody. In addition, absence of visible bands for WT protein confirms the specificity of FUS-P517L and FUS-Δ14 antibodies for mutant FUS. (h) Representative images of MNs from spinal cord sections of 2-year-old WT/WT (left), Δ14/WT (middle), and P517L/WT (right) animals stained with FUS-Abcam[1–50], FUS-Δ14, and FUS-P517L antibodies, respectively, show lack of obvious inclusions. Scale bar=5 µm. Source data
Extended Data Fig. 3
Extended Data Fig. 3. Decreased lifespan of mutant FUS heterozygous animals and absence of NMJ denervation and MN loss in newborn P517L/P517L mice.
(a) Box (median, 25th and 75th percentiles) and whiskers (2.5th and 97.5th percentiles) plot of birth weights of mice with the indicated combinations of Fus WT, P517L, Δ14, and null-knockout (KO) alleles. *P < 0.05, **P < 0.01 and ***P < 0.001, using one-way ANOVA with Tukey’s post hoc test. N = 13–183 animals per genotype as indicated in Table 1. (b) Selected data reproduced from (a) to illustrate partial functionality and dose-dependent toxicity of mutant FUS. Increased birth weight of P517L/KO compared to KO/KO animals demonstrates that mutant FUS protein is able to partially rescue the null phenotype and thus is functional. Comparison of P517L/P517L versus P517L/KO animals demonstrates that further addition of mutant FUS protein decreases birth weight, consistent with dose-dependent toxicity of mutant FUS protein. Statistical significance was assessed in (a) as a part of a full analysis of all genotype groups. (c) Kaplan-Meier survival curves for successfully weaned WT/WT, P517L/WT, Δ14/WT, and WT/KO mice. Both heterozygous mutants but not WT/KO have significantly decreased median survival age compared to wild type controls. All possible pairwise comparisons were performed using Log-rank (Mantel-Cox) test and the resulting p-values were adjusted for multiple comparison using the Bonferroni correction. (d) NMJ staining of tibialis anterior (TA) muscle of newborn WT/WT (left) and homozygous P517L/P517L(right) animals using antibodies to pre-synaptic synaptophysin (green) and alpha-bungarotoxin (magenta, post-synaptic). Scale bar= 100 µm. (e) Quantification of innervated NMJs in the WT/WT (black) and homozygous P517L (dark red) animals. N = 3 for WT/WT and 4 for P517L/P517L groups respectively. (f) Immunofluorescence staining of lumbar level 4–5 (L4-L5) MNs in WT/WT (left) and homozygous P517L/ P517L (right) animals using anti-ChAT and anti-P517L antibodies (right inset panel). Scale bar=25 µm for the left and middle panels, 100 µm for the right panel. (g) Quantification of ChAT-positive neurons in lumbar levels 4–5 (L4-L5) in newborn WT/WT (black) and homozygous P517L/ P517L (dark red) animals. N = 3 animals per genotype. For e and g, statistical significance was assessed using Welch’s t-test. Error bars represent SD.
Extended Data Fig. 4
Extended Data Fig. 4. Detergent insolubility of mutant FUS and related RNA-binding proteins.
(a) Immunoblot of sarkosyl solubility fractionation of brain from newborn FUS WT/WT, P517L/WT, and P517L/P517L mice. Sol = soluble (in hypotonic buffer), SS = sarkosyl soluble (in 1% sarkosyl and high salt), and SI = sarkosyl insoluble fractions. (b) Quantitation of protein in Sol (Soluble), SS (Sarkosyl Soluble), and SI (Insoluble) fractions. *P < 0.05, **P < 0.01 and ***P < 0.001 comparing Soluble versus the sum of Sarkosyl Soluble and Insoluble fractions using one-way ANOVA with Tukey’s post hoc test. N = 3 animals per group. (c) Quantitation of protein in sarkosyl insoluble fractions from newborn animals shown in Fig. 3c, expressed as log-ratio of wild type. (d) Quantitation of protein in sarkosyl insoluble fractions from 2-year-old animals shown in Fig. 3d, expressed as log-ratio of wild type. For c and d, *P < 0.05, **P < 0.01 and ***P < 0.001 using one-way ANOVA with Tukey´s post hoc test. N = 3 animals per genotype. Source data
Extended Data Fig. 5
Extended Data Fig. 5. Conditional c14 expression: NMJ denervation, selective motor neuron loss, gliosis and grip strength.
(a) Numbers of ChAT positive motor neurons at lumbar levels 4 and 5 in WT/WT (black) and MN-Δ14/WT (c14/WT; ChAT-Cre and Δ14/WT, purple and blue respectively) animals normalized to the wild type controls. (b) Numbers of ChAT positive motor neurons at lumbar levels 4 and 5 in WT/WT (black) and MN-Δ14/Δ14 (c14/c14; ChAT-Cre, Δ14/c14; ChAT-Cre, and Δ14/Δ14, red, green, and brown respectively) animals normalized to the controls. (c) Density of Iba1-positive microglial cells at lumbar levels 4 and 5 in WT/WT (black) and MN-Δ14/WT (c14/WT; ChAT-Cre and Δ14/WT, purple and blue respectively) animals. (d) Density of Iba1-positive microglial cells at lumbar levels 4 and 5 in WT/WT (black) and MN-Δ14/Δ14 (c14/c14; ChAT-Cre, Δ14/c14; ChAT-Cre, and Δ14/Δ14, red, green, and brown respectively) animals. (e) Percentages of NMJs classified as fully innervated (green), partially denervated (yellow), and fully denervated (red) in the tibialis anterior (left) and soleus (right) muscles in CTRL (FUS WT-expressing control) and MN-P517L/Δ14 (FUS P517L/c14; ChAT-Cre) animals. *P < 0.05, **P < 0.01 and ***P < 0.001 indicates significant differences in fully denervated NMJs using two-way ANOVA with Sidak´s post hoc test. Data shown as mean ± SD. N = 3 animals per group. (f) Density of Iba1-positive microglial cells at lumbar levels 4 and 5 in CTRL (FUS WT-expressing control, black) and MN-P517L/Δ14 (FUS P517L/c14; ChAT-Cre, green) animals. (g) Percentage of cross-sectional area that is GFAP-positive at lumbar levels 4 and 5 in CTRL (FUS WT-expressing control, black) and MN-P517L/Δ14 (FUS P517L/c14; ChAT-Cre, green) animals. (h) Normalized grip strength of forelimbs (left) and hindlimbs (right) in CTRL (FUS WT-expressing control, black) and MN-P517L/Δ14 (P517L/c14; ChAT-Cre, green) animals normalized to the controls. *P < 0.05, **P < 0.01 and ***P < 0.001 using two-way ANOVA with Sidak´s post hoc test. Data shown as mean ± SD. N = 5–28 per group at different time points. For a-d, *P < 0.05, **P < 0.01 and ***P < 0.001 using two-way ANOVA with Tukey´s post hoc test. Data shown as mean ± SD. N = 3 animals per genotype. For f and g, *P < 0.05, **P < 0.01 and ***P < 0.001 using two-way ANOVA with Sidak´s post hoc test. Data shown as mean ± SD. N = 3 animals per group. CTRL=littermate c14/WT and/or c14/c14 animals depending on the breeding scheme.
Extended Data Fig. 6
Extended Data Fig. 6. FUS silencing by ION363 in FUS-ALS mice.
(a) Representative immunostaining of lumbar spinal cord sections from NTC-treated animals with an anti-ASO antibody. The staining shows widespread nuclear and cytoplasmic distribution at 1 and 4 months of age that disappears at 6 months. Scale bar=100 µm. (b) Representative immunostaining of lumbar spinal cord sections from FUS ASO-treated animals with an anti-ASO antibody. The staining shows widespread nuclear distribution at 1 and 4 months of age that disappears at 6 months. Scale bar=100 µm. (c) Immunoblot of lumbar spinal cord protein from 6-month-old WT/WT and P517L/WT animals treated with non-targeted control (NTC) or anti-FUS oligonucleotide (ION363). Each lane represents a separate animal. (d) Quantitation of FUS protein levels in lumbar spinal cord lysates from 6-month-old animals shown in (c). One-way ANOVA was performed to assess the differences in FUS levels. N = 3 animals per group. Source data
Extended Data Fig. 7
Extended Data Fig. 7. Cortical distribution of ION363 and its effect on total protein levels of RBPs.
(a) Anti-ASO immunohistochemical staining of FFPE sections of motor cortex (BA4) from a non-ALS control (left) and ION363-treated ALS-FUSP525L patient (right). Scale bar=200 µm at 4x and 20 µm at 40x. (b) Immunoblot of sarkosyl solubility fractionation of brain stem samples from a non-ALS control, ALS-FUSP525L control patient, and ION363-treated ALS-FUSP525L patient. Sol = soluble (in hypotonic buffer), SS = sarkosyl soluble (in 1% sarkosyl and high salt), and SI = sarkosyl insoluble fractions. (c) Representative immunoblot of brainstem tissue from a non-ALS control, ALS-FUSP525L control patient, and ION363-treated ALS-FUSP525L patient probed with antibodies against RBPs. Source data
Extended Data Fig. 8
Extended Data Fig. 8. The effect of ION363 on FUS expression and pathology in human lumbar spinal cord.
(a) Low-power immunohistochemical images of FFPE sections of lumbar spinal cord from a non-ALS control (left), ALS-FUSP525L control patient (middle), and ION363-treated ALS-FUSP525L patient (right) stained with an antibody against total FUS (FUS-Bethyl[400–450], top row), P525L-specific mouse monoclonal antibody reactive to FUS aggregates (middle row), and P525L-specific guinea pig antiserum (bottom row). Scale bar=100 µm. (b) Immunohistochemical staining of FFPE sections from lumbar spinal cord of a non-ALS control, ALS-FUSP525L control patient, and ION363-treated ALS-FUSP525L patient with P525L-specific guinea pig antiserum. Scale bar=20 µm.
Extended Data Fig. 9
Extended Data Fig. 9. The effect of ION363 on FUS expression and pathology in human motor cortex.
(a) Immunohistochemical staining of FFPE sections of motor cortex (BA4) from a non-ALS control (left), ALS-FUSP525L control patient (middle), and ION363-treated ALS-FUSP525L patient (right) with an antibody against total FUS (FUS-Bethyl[400–450]). Scale bar=200 µm at 4x and 20 µm at 40x. (b) Immunohistochemical staining of FFPE sections of motor cortex (BA4) from a non-ALS control (left), ALS-FUSP525L control patient (middle), and ION363-treated ALS-FUSP525L patient (right) with P525L-specific guinea pig antiserum. Scale bar=200 µm at 4x and 20 µm at 40x. (c) Immunohistochemical staining of FFPE sections of motor cortex (BA4) from a non-ALS control (left), ALS-FUSP525L control patient (middle), and ION363-treated ALS-FUSP525L patient (right) with P525L-specific mouse monoclonal antibody. Scale bar=200 µm at 4x and 20 µm at 40x.

Comment in

References

    1. Rowland LP, Shneider NA. Amyotrophic lateral sclerosis. N. Engl. J. Med. 2001;344:1688–1700. doi: 10.1056/NEJM200105313442207. - DOI - PubMed
    1. Ghasemi M, Brown RHJr. Genetics of amyotrophic lateral sclerosis. Cold Spring Harb. Perspect. Med. 2018;8:a024125. doi: 10.1101/cshperspect.a024125. - DOI - PMC - PubMed
    1. Taylor JP, Brown RHJr, Cleveland DW. Decoding ALS: from genes to mechanism. Nature. 2016;539:197–206. doi: 10.1038/nature20413. - DOI - PMC - PubMed
    1. Shatunov A, Al-Chalabi A. The genetic architecture of ALS. Neurobiol. Dis. 2021;147:105156. doi: 10.1016/j.nbd.2020.105156. - DOI - PubMed
    1. Kwiatkowski TJJr, et al. Mutations in the FUS/TLS gene on chromosome 16 cause familial amyotrophic lateral sclerosis. Science. 2009;323:1205–1208. doi: 10.1126/science.1166066. - DOI - PubMed

Publication types

Substances