. 2022 Apr 30;41(9):1644-1657.
doi: 10.1002/sim.9319. Epub 2022 Jan 24.

Two-step hypothesis testing to detect gene-environment interactions in a genome-wide scan with a survival endpoint

Affiliations

Two-step hypothesis testing to detect gene-environment interactions in a genome-wide scan with a survival endpoint

Eric S Kawaguchi et al. Stat Med. .

Abstract

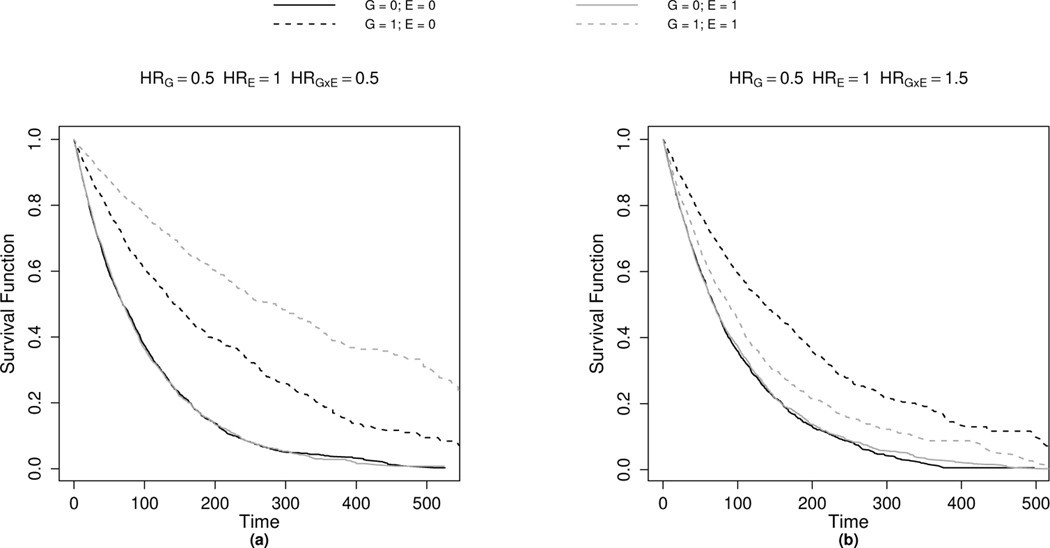
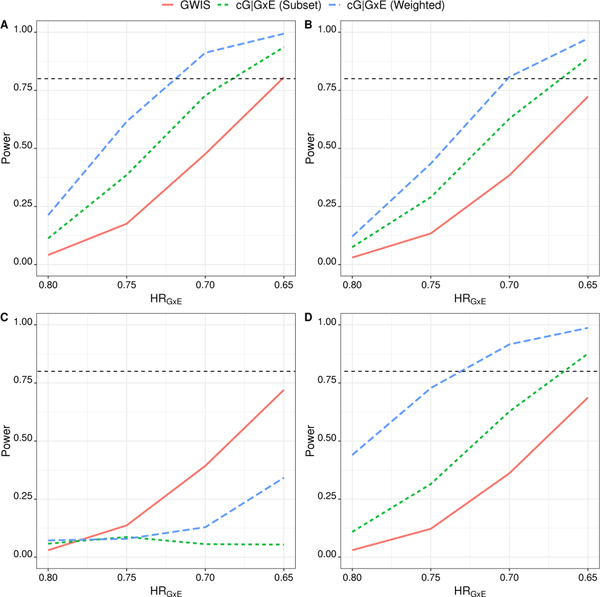
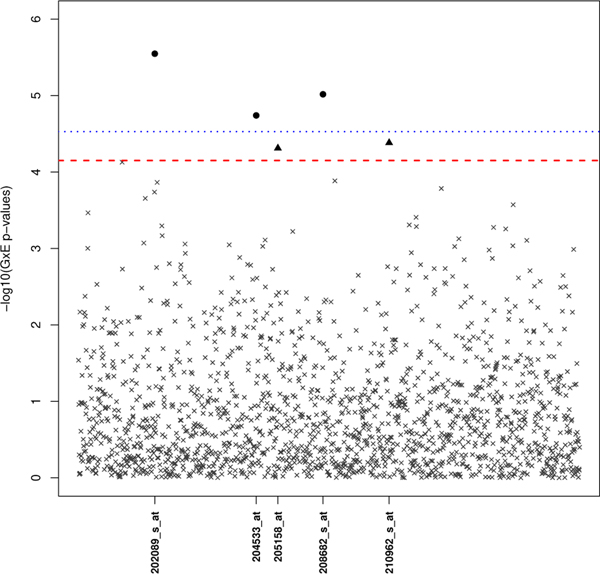
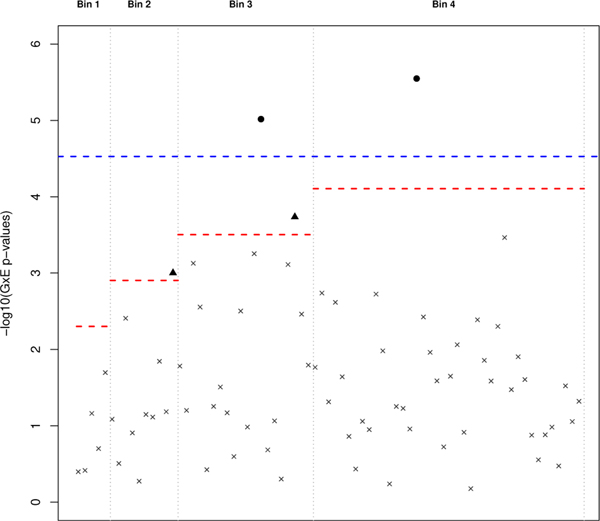
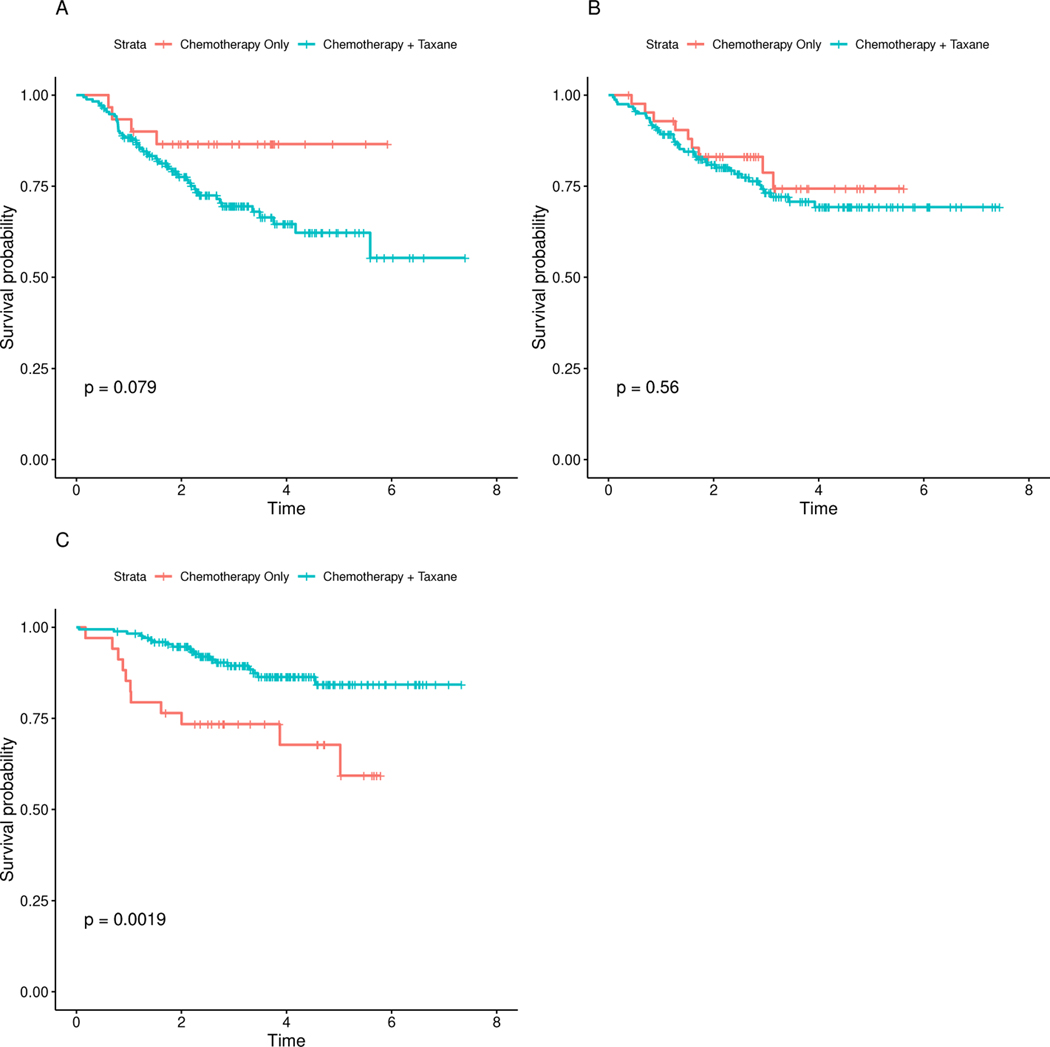
Defined by their genetic profile, individuals may exhibit differential clinical outcomes due to an environmental exposure. Identifying subgroups based on specific exposure-modifying genes can lead to targeted interventions and focused studies. Genome-wide interaction scans (GWIS) can be performed to identify such genes, but these scans typically suffer from low power due to the large multiple testing burden. We provide a novel framework for powerful two-step hypothesis tests for GWIS with a time-to-event endpoint under the Cox proportional hazards model. In the Cox regression setting, we develop an approach that prioritizes genes for Step-2 G×E testing based on a carefully constructed Step-1 screening procedure. Simulation results demonstrate this two-step approach can lead to substantially higher power for identifying gene-environment ( G×E ) interactions compared to the standard GWIS while preserving the family wise error rate over a range of scenarios. In a taxane-anthracycline chemotherapy study for breast cancer patients, the two-step approach identifies several gene expression by treatment interactions that would not be detected using the standard GWIS.

Keywords: Cox proportional hazards model; censoring; personalized medicine; survival analysis.


Figures

FIGURE 1
FIGURE 1
Kaplan-Meier curves for G × E combinations on a simulated data set of N = 10,000. Data were generated using an exponential model with binary G and E values under the model: h(tG,E)=0.01exp(γGG+γEE+γG×E(G×E). Independent censoring times were generated using an exponential model with rate 0.005. The exposure (E) is assumed to have a null main effect (HRE = 1) but affects survival through its interaction (G×E) with G. Panel 1a: Synergistic interaction effect (HRG×E = 0.5). Panel 1b: Antagonistic interaction effect (HRG×E = 1.5).
FIGURE 2
FIGURE 2
Power comparison between the standard GWIS approach and the cG|G×E two-step GWIS across different values of HRG×E = exp(γG×E). Panel A) γ = (0,0G×E); Panel B) γ = (0,log(0.6), γG×E); Panel C) γ = (log(1.2),log(0.6), γG×E); Panel D) γ = (log(0.8),log(0.6), γG×E). See Section 3.2 for details of the simulation setup (Standard GWIS - Solid Red Line; cG|G × E with weighted screening - Dashed Green Line; mG|G × E with weighted screening - Dashed Blue Line).
FIGURE 3
FIGURE 3
Manhattan Plot of G × E p-values (on the -log10 scale) from the taxane-anthracycline chemotherapy study in Section 4 using subset testing. Loci marked by a black dot or triangle represent G × E p-values that passed the subset-adjusted significance threshold (red dotted line). As a comparison, the standard GWIS significance threshold is also included (blue dotted line) with the black dot indicating a significant finding.
FIGURE 4
FIGURE 4
Manhattan Plot of G × E p-values (on the -log10 scale) from the taxane-anthracycline chemotherapy study in Section 4 using weighted Bonferroni testing. G × E p-values for each loci are arranged left to right in ascending order of their respective conditional p-values. Loci marked by a black dot or triangle represent G×E p-values that passed the subset-adjusted significance threshold (red dotted line). As a comparison, the standard GWIS significance threshold is also included (blue dotted line) with the black dot indicating a significant finding.
FIGURE 5
FIGURE 5
Kaplan-Meier curves comparing AKAP9-treatment effects on distant relapse-free survival.AKAP9 gene expression levels were divided into tertiles; A) Low AKAP9 levels ≤ −0.516); B) Medium AKAP9 levels (−0.516,0.268); C) High AKAP9 levels ≥ 0.268. P-values are calculated using an unweighted log-rank test.

References

    1. Fu P, A Pennell N, Sharma N, Yi Q, Dowlati A. Interaction of Treatment and Biomarker in Advanced Non-small Cell Lung Cancer. Reviews on recent clinical trials 2017; 12(1): 51–58. - PubMed
    1. Nguyen PA, Born DA, Deaton AM, Nioi P, Ward LD. Phenotypes associated with genes encoding drug targets are predictive of clinical trial side effects. Nature communications 2019; 10(1): 1–11. - PMC - PubMed
    1. Hughey JJ, Rhoades SD, Fu DY, Bastarache L, Denny JC, Chen Q. Cox regression increases power to detect genotypephenotype associations in genomic studies using the electronic health record. BMC genomics 2019; 20(1): 1–7. - PMC - PubMed
    1. Kaplan EL, Meier P. Nonparametric estimation from incomplete observations. Journal of the American statistical association 1958; 53(282): 457–481.
    1. Dunn OJ. Multiple comparisons among means. Journal of the American Statistical Association 1961; 56(293): 52–64.

Publication types

LinkOut - more resources