Review
. 2022 Sep;69(5):e12890.
doi: 10.1111/jeu.12890. Epub 2022 Feb 5.

Anterior-posterior pattern formation in ciliates

Affiliations
Review

Anterior-posterior pattern formation in ciliates

Eric Cole et al. J Eukaryot Microbiol. 2022 Sep.

Abstract

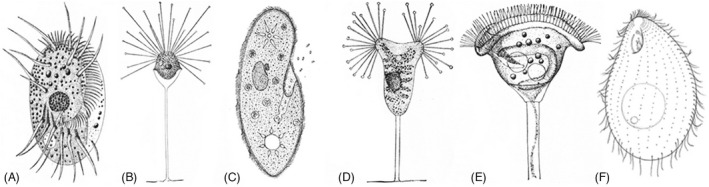
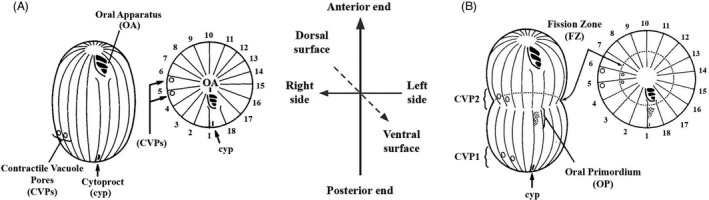
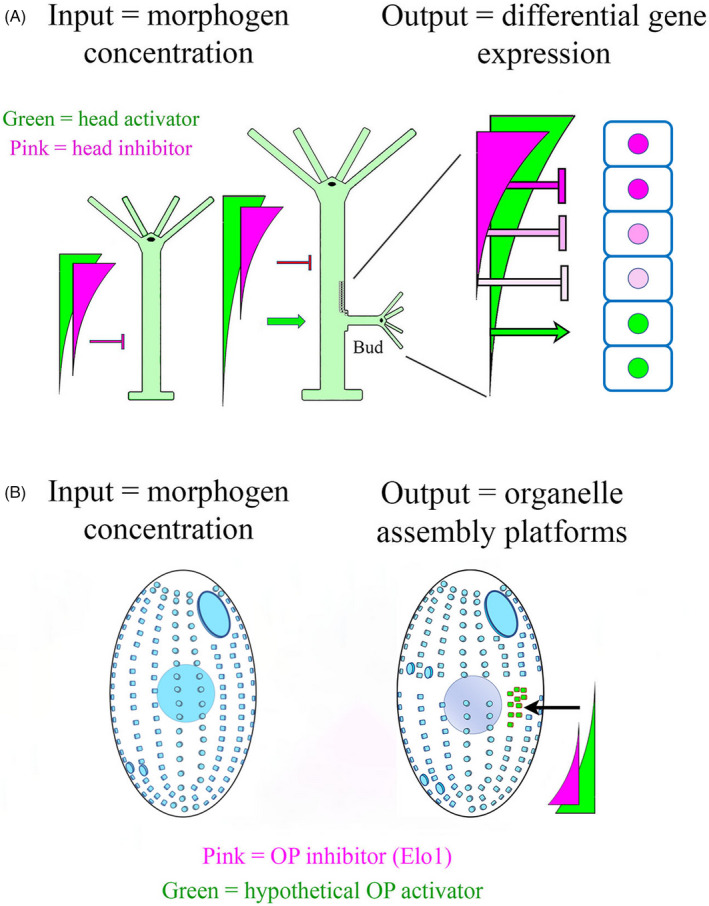
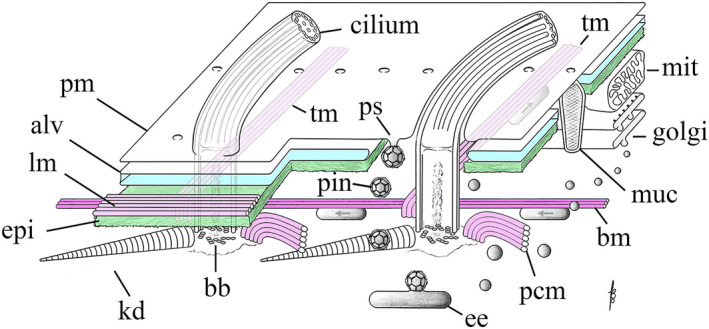
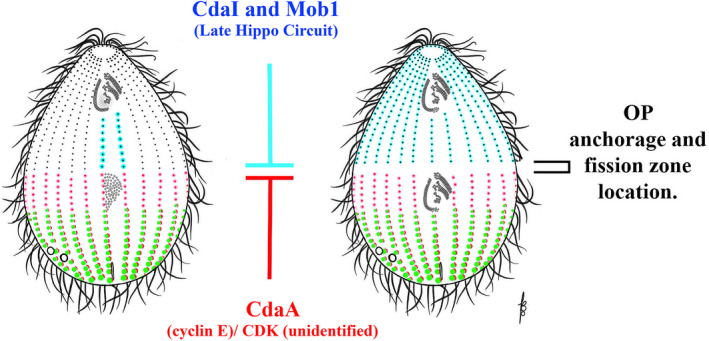
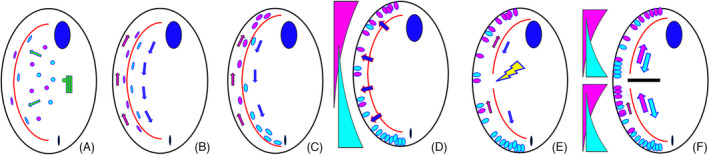
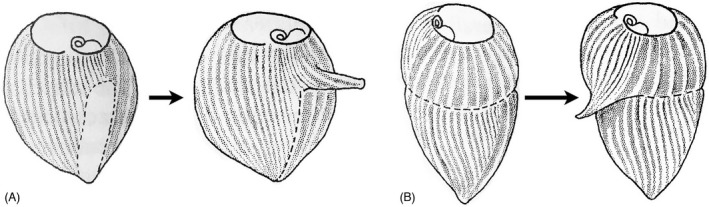
As single cells, ciliates build, duplicate, and even regenerate complex cortical patterns by largely unknown mechanisms that precisely position organelles along two cell-wide axes: anterior-posterior and circumferential (left-right). We review our current understanding of intracellular patterning along the anterior-posterior axis in ciliates, with emphasis on how the new pattern emerges during cell division. We focus on the recent progress at the molecular level that has been driven by the discovery of genes whose mutations cause organelle positioning defects in the model ciliate Tetrahymena thermophila. These investigations have revealed a network of highly conserved kinases that are confined to either anterior or posterior domains in the cell cortex. These pattern-regulating kinases create zones of cortical inhibition that by exclusion determine the precise placement of organelles. We discuss observations and models derived from classical microsurgical experiments in large ciliates (including Stentor) and interpret them in light of recent molecular findings in Tetrahymena. In particular, we address the involvement of intracellular gradients as vehicles for positioning organelles along the anterior-posterior axis.

Keywords: cell division; ciliates; cortical; gradients; kinase; morphogens; patterning; tetrahymena.


Figures

FIGURE 1
FIGURE 1
Ciliate diversity. (A) Diophrys. (B) Acineta divisa. (C) Paramecium spp. (D) Acineta tuberosa. (E) Vorticella patelline. (F) Tetrahymena thermophila. Images (A), (B), (D), (E) are from “The Project Gutenberg eBook,” Marine Protozoa from Woods Hole, by Gary N. Calkins. Image C is from D.G. McKean, (http://www.biology‐resources.com/drawing‐paramecium.html), and image F is from (Lynn, 2008)
FIGURE 2
FIGURE 2
Tetrahymena cytogeometry and organelle nomenclature (Cole et al., 1987). (A) A ventral view and a polar projection of a nondividing cell. Ciliary rows are depicted as lines. The OA is positioned at the anterior and the cytoproct and contractile vacuole pores at the posterior. Two ciliary rows terminate just posterior to the OA. The left‐postoral row is often used as a spatial reference (row number 1), and serves as the “stomatogenic kinety” near which the new OA forms during cell division. (B) A ventral view and a polar projection of a dividing cell. A new oral primordium (OP) forms at mid‐body, just posterior to the fission zone (FZ), and a new pair of CVPs develops just anterior to the fission zone. Ciliary rows are numbered in the polar projection. The OP, CVPs, and FZ are our principle cortical landmarks
FIGURE 3
FIGURE 3
Morphogen gradients and their role in positional information in animals and ciliates. (A) In a simplified model of the freshwater Hydra, a gradient of “head activator” is established, with its high value at the head and low value at the base (green gradient). High levels of this rapidly‐diffusing morphogen lead to differentiation of tentacles, stinging cells and a mouth. Low levels are correlated with the expression of an adhesive disk at the base of the animal. An equally important morphogen gradient involves the head inhibitor (pink) that also emanates from the head region, but has a more limited ability to diffuse. The head inhibitor suppresses secondary head formation along the body axis. As the hydra grows in length, the head inhibitor gradient still covers the same limited physical range, so that at some point, tissues in the proximity of the base become exposed to supra‐threshold levels of activator, and sub‐threshold levels of inhibitor, and a new head forms (budding occurs) [after (Vogg et al., ; Webster & Wolpert, 1966); see Mercker et al. (2021) for recent review]. A more complete model would include the description of a “foot activator” and “foot inhibitor” emanating from the basal disk. (B) A simplified model of gradients involved in cortical patterning of Tetrahymena. A posterior‐high gradient of the oral inhibitor (pink = elo1) prevents initiation of oral assembly too close to the posterior. A purely hypothetical posterior‐high gradient of oral activator (green) stimulates oral development near mid‐body (arrow) as the cell launches predivision development
FIGURE 4
FIGURE 4
Organization of the cell cortex in Tetrahymena. A patch of cell cortex is depicted with anterior to the left, and posterior to the right. pm = plasma membrane; alv = Ca++ reservoirs known as alveolar sacs; lm = longitudinal band of microtubules lying just under the alveolar sacs and above the epiplasm; epi = a proteinaceous layer of nonmicrotubule based cytoskeleton resembling the spectrin layer in red blood cells; tm = transverse microtubules exposed to cytoplasm; kd = the kinetodesma (or striated fiber); bb = BB; pin = pinosomes; ps = parasomal sac, site of clathrin‐mediated pinocytosis; ee = early endosomes; pcm = postciliary microtubules (also exposed to cytoplasm) and the bm = basal microtubule: the one microtubule track that runs the length of the cell (anterior to posterior) that is exposed to the cytoplasm and hence available for A/P vesicle traffic; muc = mucocyst (dense‐core secretory granule); golgi = dictyosome; mit = mitochondrion
FIGURE 5
FIGURE 5
Oral assembly. Stages assigned to development of the oral primordium (lower Fig. from Lansing et al. [1985]). The asterisk (*) denotes the “physiological transition point” between stages 4B and 5A. In the lower panel the triangle indicates a stage at which the undulating membrane of the mature OA is remodeled, completing its reassembly in synchrony with that of the oral primordium. Also in the lower panel, ciliated and unciliated basal bodies are shown in black and grey respectively
FIGURE 6
FIGURE 6
Localization of Tetrahymena proteins in the cell cortex. (A) GFP‐tagged Epc1 localization in a dividing cell, dorsal view (courtesy of Douglas Chalker). Note clearance around each BB and within the FZ. (B) GFP‐tagged fenestrin Fen1 localization in a dividing cell. Fenestrin appears everywhere the epiplasm is excluded including the developing FZ, a cage around each BB, the OA and the developing OP. (C) Cda12:GFP tagged vesicles (likely recycling endosomes) in a recently divided cell (After Zweifel et al., 2009). This is a posterior daughter cell and the putative endosomes appear more richly concentrated at the anterior (arrow), which recently was the fission zone at midbody prior to division
FIGURE 7
FIGURE 7
Sequence of cortical organelle dynamics leading to cell division. Development proceeds from left to right. In the first sign of prefission development, epiplasm proteins (green) disappear from the site of oral assembly (the OP). BBs proliferate within this clearing from the stomatogenic kinety. Note: it is not certain whether epiplasm clearance precedes or is concurrent with BB proliferation. BBs become organized into three transverse membranelles and the undulating membrane. The epiplasm clears from the future fission zone, and becomes free of BBs (there is now a midbody discontinuity in the ciliary rows known as the cortical subdivision). Cytokinesis is initiated, and the second cytoproct and CVP sets develop in the anterior daughter cell
FIGURE 8
FIGURE 8
Anterior‐posterior morphogenetic gradients deduced from microsurgical experiments in Stentor [A–D, based on (Tartar, 1961)] and Blepharisma [E, modified from (Suzuki, 1957)]. Fig. A) diagrams a Stentor cell with a developing OP that assembles at the zone of stripe contrast (CZ = contrast zone). This region exhibits a visible “seam” between broad longitudinal stripes of pigment granules, and narrow stripes. (B) A dividing Stentor cell whose OP has begun to differentiate a “cytostome” at its posterior end (arrow). (C) A surgically manipulated Stentor in which the OP has been excised and rotated 180°. Its original cytostome is now positioned at the anterior end and a new, 2° cytostome has been induced at its new posterior. (D) A Stentor regenerating its OP, with a second posterior surgically grafted nearby. This has, apparently, induced formation of a 2° cytostome in the middle of the developing OP. (E) A classic surgical result from Blepharisma [modified from (Suzuki, 1957)]. In the first panel, the anterior hemicell of a nondividing cell is severed, rotated, and grafted back to the posterior hemicell. The right‐most panels depict development of two oral primordia, the first assembling just posterior to the mature OA (in a postequatorial region that would not normally form an OP). The second OP forms where it would normally have formed had there been no surgery. This highlights the ability of a mature OA to “induce” or at least specify where a novel OP will form
FIGURE 9
FIGURE 9
Role of protein phosphorylation in specification of the division plane position in Tetrahymena. (A) Control cell, BBs labeled with anticentrin (Kaczanowska et al., 2012). Arrows indicate FZ. (B) A 6‐DMAP‐treated cells showing anterior displacement of FZ and OP (note unequal size of daughter cells; Kaczanowska et al., 1999). (C) A roscovitine‐treated cells showing posterior displacement of FZ (but not the OP; Kaczanowska et al., 2012). (D) A double mutant (cdaA1/ cdaI1) grown at restrictive temperature (Jiang et al., 2020). OP is displaced anterior to the FZ. (E) MPM‐2 immunostaining of triton‐extracted Tpyriformis, a gradient of phosphorylated protein epitopes posterior to the FZ [from Kaczanowska et al. (1999)].
FIGURE 10
FIGURE 10
Diagram illustrating major features of cortical mutant phenotypes of Tetrahymena discussed. Red triangles and diamonds: developing OPs. Red cross‐bars: developing FZ. Small red circles: developing CVPs. Blue arrows indicate anterior cortical slippage of OP to more anterior location. Anterior hemi‐cells partially divided from posterior hemi‐cells indicate “hammerhead” phenotypes with incomplete fission.
FIGURE 11
FIGURE 11
Localizations of proteins involved in A/P patterning in Tetrahymena. (A) interphase; (B) early oral development; (C) early cortical subdivision; (D) early cytokinesis/cell end emergence; (E) late cytokinesis. Green = Elol (Lats/Ndr Kinase) andMob1 (Lats/Ndr kinase adapter). Blue = CdaI (Hippo/Mst kinase). Red = CdaA (cyclin E). Elo1 forms a posterior‐high gradient present during the entire cell cycle including interphase (stage A). The OP forms anteriorly to the low end of the Elo1/Mob1 posterior gradient (B). Before the FZ induction, CdaA appears as streaks in the posterior hemi‐cell. With a slight delay, CdaI covers the anterior semi‐cell (B–C) The FZ first manifested as an equatorial cortical gap forms between the margins of CdaA and CdaI cortical zones (C). When the FZ is fully developed, CdaA also appears in the anterior hemi‐cell (D). After the FZ emergence, Elo1, Mob1 and CdaI accumulate at the new posterior cell end anteriorly to the FZ (D, E). Inserts highlight that, just anterior to the newly formed FZ, there is triple‐labeling around BBs including Elo1, CdaI, and CdaA. Later, as fission progresses, Elo1 and CdaI remain associated with the new posterior end. The CdaI signal disappears around the time of completion of cytokinesis (not shown). Thus, only Elo1 and Mob1 remain when the postdivider enter interphase
FIGURE 12
FIGURE 12
Early acting specification of the A/P position of OP assembly. The posterior early Hippo circuit (Elo1/ Mob1 driven), inhibits OP initiation within the most posterior cell region. On the left a hypothetical gradient of activity is depicted that originates from the posterior cell end and induces the formation of portions of the OA (based on the observations in Stentor). The molecular nature of this gradient is unknown
FIGURE 13
FIGURE 13
Late‐acting specification of the fission zone. This model is informed by mutant (loss‐of‐function) and GFP‐localization data. Prior to FZ induction (left panel) the posterior CdaA‐Cyclin E/CDK circuit (CDK not yet identified), represses fission zone formation (red). Later, the anterior late Hippo‐circuit (CdaI‐driven) is expressed, and it inhibits FZ assembly within the anterior hemi‐cell (blue). The CdaA and CdaI zones exclude each other. The FZ assembles at the boundary between the CdaI and the CdaA‐domains. Later, the CdaA/CdaI boundary may also contribute to assembly of the early Hippo circuit components just anterior to the fission zone which may in turn promote establishment of CdaA in the anterior hemicell during the next generation
FIGURE 14
FIGURE 14
A hypothetical model depicting establishment and tandem duplication of anterior–posterior gradients of positional information in the ciliate cell cortex. (A) Hypothetical packages of “cortical morphogen” (CMPs) are synthesized and diffuse out to the cell cortex. (B) CMPs are loaded onto the exposed basal microtubule tracks, where plus‐end or minus‐end directed motors transport them towards the cell's anterior or posterior poles respectively. (C) CMPs become more concentrated in the anterior and posterior poles of the cell depending on their motor‐protein orientations. (D) If such vesicles up‐load and off‐load stochastically, and dock to deliver their contents at the cell surface (where lateral diffusion is limited), one would expect monotonic gradients of anterior morphogen (pink), highest at the cell anterior, and posterior‐morphogen (turquoise) highest at the cell posterior. (E, F) Disrupting morphogen transport at midbody would create two “high‐point” destinations for each class of CMP, one at the cell's original pole, and a second at midbody
FIGURE 15
FIGURE 15
Surgical experiments by Weisz (1951) depicted by Tartar (1961). (A) Weisz removed a strip of cortex along the stomatogenic “seam” resulting in transient expression of a tail and holdfast anterior to the cut. (B) Weisz severed and rotated the anterior hemi‐cell with respect to its posterior half, provoking, again, a temporary tail and holdfast anterior to the cut. In both cases, (and especially the latter), a discontinuity is created in the cell cortex, provoking tail formation anterior to the discontinuity. This is consistent with a model in which the posterior transport of cortical determinants is interrupted, causing accumulation of posterior determinants in the more anterior location and provoking ectopic tail formation

References

    1. Adams, A.E. , Johnson, D.I. , Longnecker, R.M. , Sloat, B.F. & Pringle, J.R. (1990) CDC42 and CDC43, two additional genes involved in budding and the establishment of cell polarity in the yeast Saccharomyces cerevisiae . Journal of Cell Biology, 111, 131–142. - PMC - PubMed
    1. Ajduk, A. & Zernicka‐Goetz, M. (2016) Polarity and cell division orientation in the cleavage embryo: from worm to human. Molecular Human Reproduction, 22, 691–703. - PMC - PubMed
    1. Albrecht‐Buehler, G. (1977) Phagokinetic tracks of 3T3 cells: parallels between the orientation of track segments and of cellular structures which contain actin or tubulin. Cell, 12, 333–339. - PubMed
    1. Allen, R.D. (1967) Fine structure, reconstruction and possible functions of components of the cortex of Tetrahymena pyriformis. The Journal of Protozoology, 14, 553–565. - PubMed
    1. Allen, R.D. (1969) The morphogenesis of basal bodies and accessory structures of the cortex of the ciliated protozoan Tetrahymena pyriformis. Journal of Cell Biology, 40, 716–733. - PMC - PubMed

Publication types

MeSH terms