

Re-assessing global municipal solid waste generation
- PMID: 35075952
- PMCID: PMC10114251
- DOI: 10.1177/0734242X221074116
Re-assessing global municipal solid waste generation
Abstract
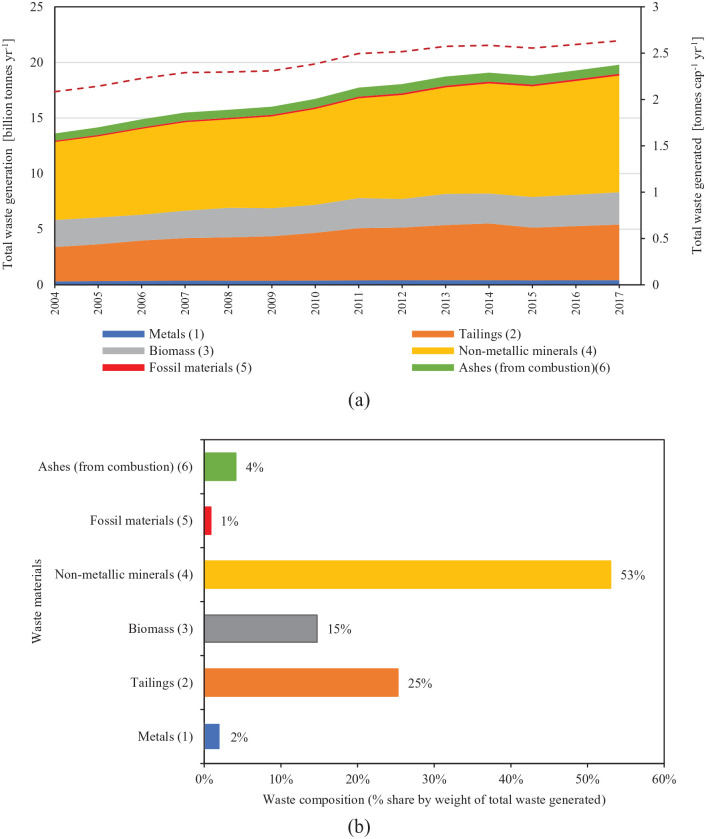
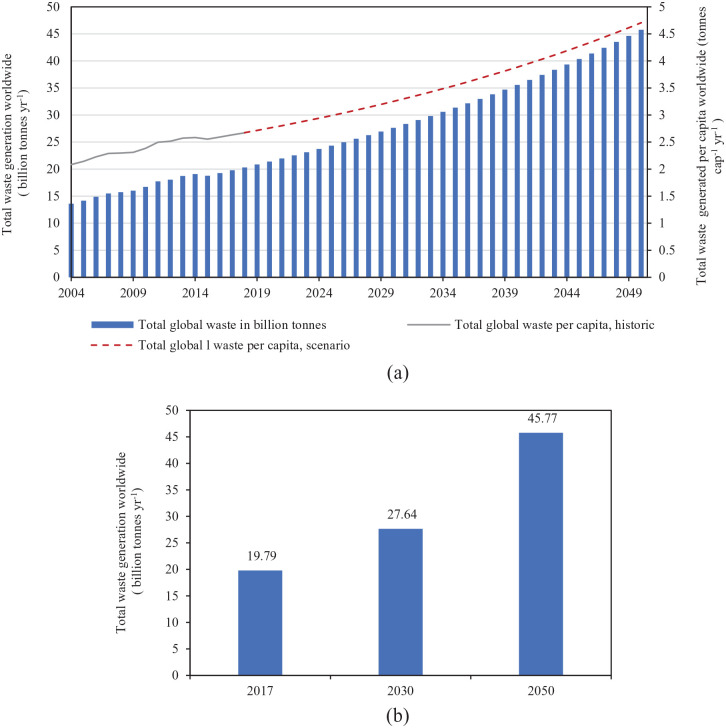
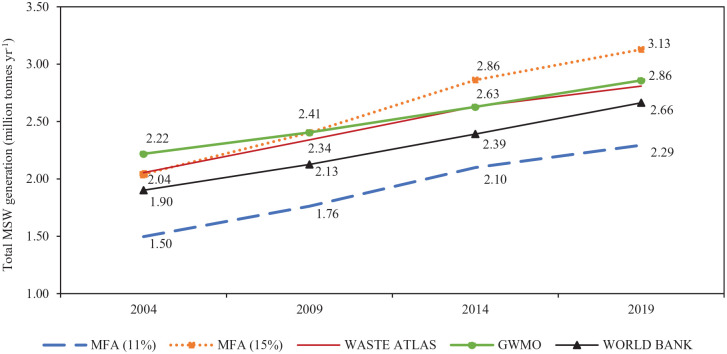
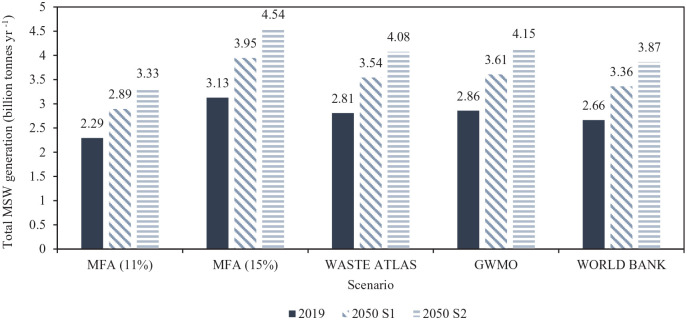
This study contributes to estimate the total waste generated at global level. A few studies have provided an efficient and comprehensive global estimate. However, data reporting is globally inconsistent due to varying interpretation of terminology, lacking standardised categories and varying methodologies used to observe and measure waste amounts. This study employs regression analysis and material flow analysis approaches to ensure a cross-comparability of waste generation data. The result implies that total global waste arisings are around 20 billion tonnes in 2017. This corresponds to 2.63 tonnes of total waste per capita (cap) per year. The total global waste generated is expected to grow to 46 billion tonnes by 2050 under a business-as-usual scenario. Municipal solid waste (MSW) is a much smaller amount, ranging from 2.3 to 3.1 billion tonnes (average of 2.7 billion tonnes) in 2019. This figure reflects an increase of between 30% and 50% in MSW generated during the last 15 years (2004-2019). MSW generated is expected to grow to 2.89-4.54 billion tonnes by 2050, depending on which assumptions are used. This represents a 26%-45% increase compared to 2019. The overall assessment in this study reveals that almost one-third of the total MSW generated is not collected, and most of what is collected is not treated accordingly to current ideas of sound management. Moreover, almost 42% of MSW goes to open dumping or uncontrolled burning. The finding provides valuable insight for policymakers to design and assess circular economy policy instruments towards achieving sustainable development goals.
Keywords: Waste generation; circular economy; forecasting; global waste; material flow analysis-based accounting; municipal solid waste; regression analysis-based accounting; waste disposal; waste estimation.
Conflict of interest statement
The author(s) declared no potential conflicts of interest with respect to the research, authorship and/or publication of this article.
Figures

References
-
- Allesch A, Brunner PH. (2017) Material flow analysis as a tool to improve waste management systems: The case of Austria. Environmental Science & Technology 51: 540–551. - PubMed
-
- Anupam (2012) Decoupling and environmental Kuznets curve for municipal solid waste generation: Evidence from India. International Journal of Environmental Sciences 2: 30051.
-
- Beigl P, Lebersorger S, Salhofer S. (2008) Modelling municipal solid waste generation: A review. Waste Management 28: 200–214. - PubMed
-
- Christian TJ, Yokelson RJ, Cardenas B, et al.. (2010) Trace gas and particle emissions from domestic and industrial biofuel use and garbage burning in central Mexico. Atmospheric Chemistry and Physics 10: 565–584.
MeSH terms
Substances
LinkOut - more resources
Full Text Sources
Miscellaneous
