. 2022 Jan 25;7(2):e153559.
doi: 10.1172/jci.insight.153559.

Liquid biopsy reveals collateral tissue damage in cancer

Affiliations

Liquid biopsy reveals collateral tissue damage in cancer

Asael Lubotzky et al. JCI Insight. .

Abstract

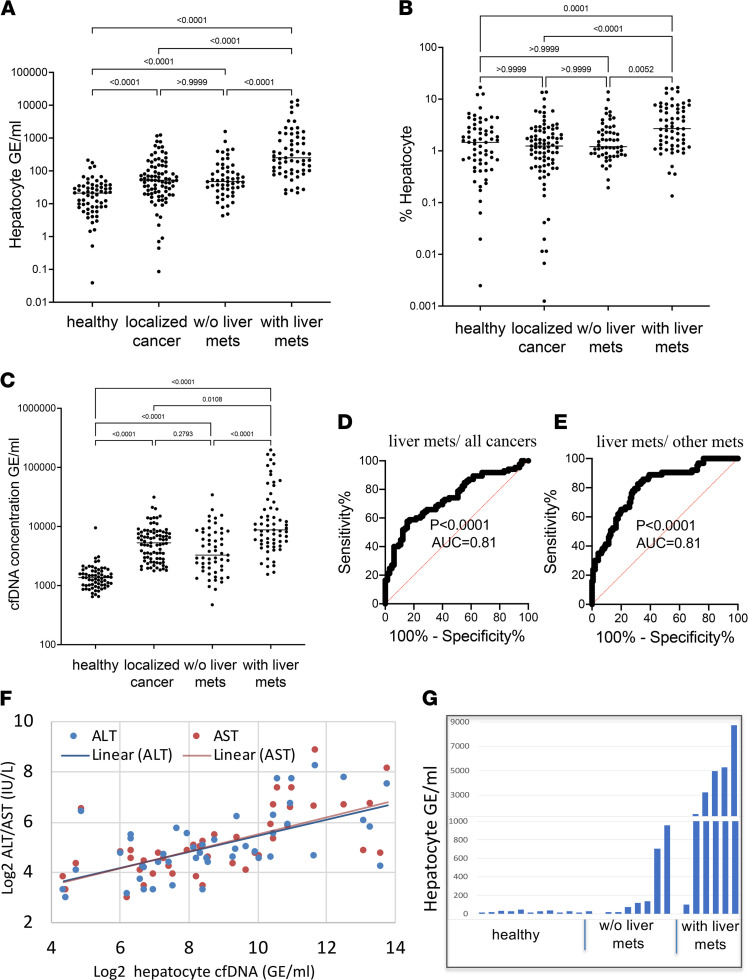
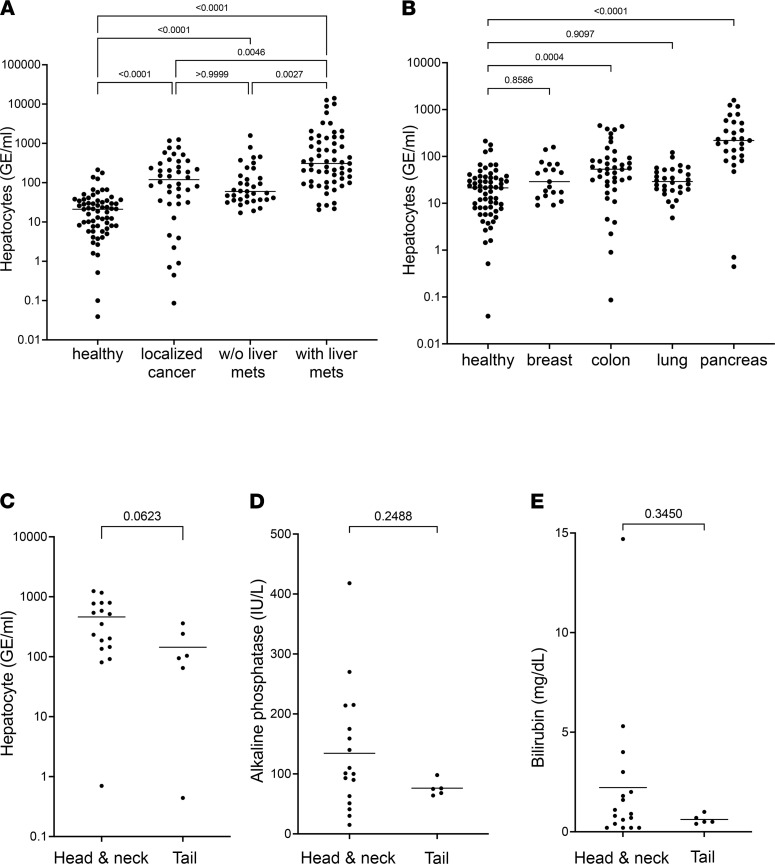
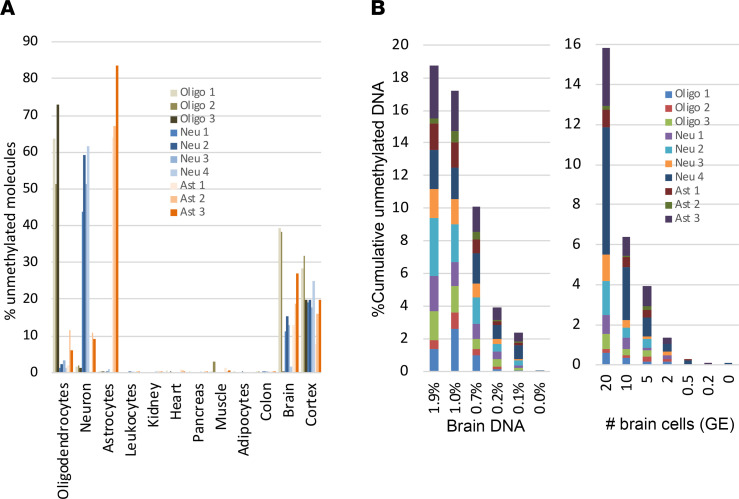
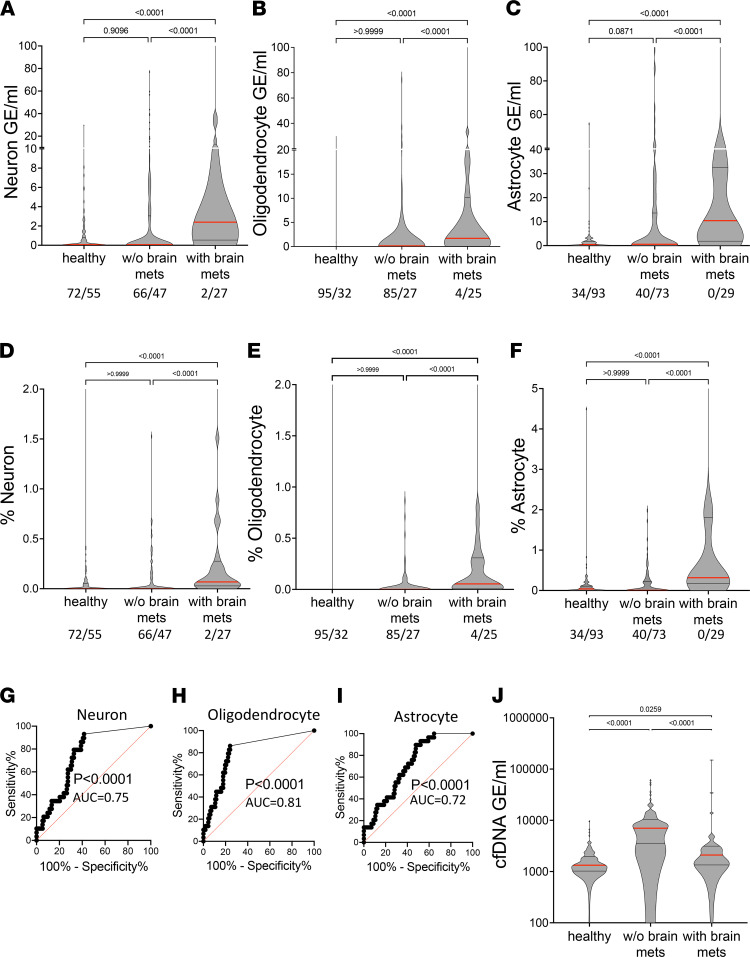
Cancer inflicts damage to surrounding normal tissues, which can culminate in fatal organ failure. Here, we demonstrate that cell death in organs affected by cancer can be detected by tissue-specific methylation patterns of circulating cell-free DNA (cfDNA). We detected elevated levels of hepatocyte-derived cfDNA in the plasma of patients with liver metastases originating from different primary tumors, compared with cancer patients without liver metastases. In addition, patients with localized pancreatic or colon cancer showed elevated hepatocyte cfDNA, suggesting liver damage inflicted by micrometastatic disease, by primary pancreatic tumor pressing the bile duct, or by a systemic response to the primary tumor. We also identified elevated neuron-, oligodendrocyte-, and astrocyte-derived cfDNA in a subpopulation of patients with brain metastases compared with cancer patients without brain metastasis. Cell type-specific cfDNA methylation markers enabled the identification of collateral tissue damage in cancer, revealing the presence of metastases in specific locations and potentially assisting in early cancer detection.

Keywords: Cell Biology; Epigenetics; Molecular diagnosis; Oncology.


Conflict of interest statement

Conflict of interest: TK, RS, BG, and YD filed a patent (year 2019, application number 62/828,587) on cell-free DNA analysis technology.

Figures

Figure 1
Figure 1. Hepatocyte cfDNA in patients with liver metastasis.
(A) Hepatocyte cfDNA (average signal of 3 hepatocyte markers) in healthy controls (n = 65), localized cancer patients (n = 85), metastatic cancer patients with no liver metastasis (n = 55), and cancer patients with liver metastasis (n = 63). Each dot represents 1 plasma sample processed to extract cfDNA, treated with bisulfite, and PCR amplified and sequenced. The fraction of hepatocyte-derived cfDNA was multiplied by the total concentration of cfDNA per sample. Kruskal-Wallis test with Dunn’s post hoc correction for multiple comparisons. (B) Percentage of hepatocyte-derived cfDNA in the same plasma samples as in A. Kruskal-Wallis test with Dunn’s post hoc correction for multiple comparisons. (C) Total cfDNA levels in the same patients as in A. Kruskal-Wallis test with Dunn’s post hoc correction for multiple comparisons. (D) ROC curve for distinguishing cancer patients with liver metastases from other cancer patients (having localized or metastatic disease without liver involvement), based on the 3 hepatocyte cfDNA markers. AUC 0.81 (95% CI = 0.74 to 0.87), P < 0.0001. (E) ROC curve for distinguishing stage 4 cancer patients with or without liver metastases, using hepatocyte markers. AUC 0.81 (95% CI = 0.73 to 0.89), P < 0.0001. (F) Correlation between hepatocyte cfDNA levels and alanine transaminase (ALT, blue) or aspartate transaminase (AST, red) in cancer patients with liver metastases. Spearman’s correlation, ALT r = 0.6, P < 0.0001; AST r = 0.68, P < 0.0001. (G) Assessment of hepatocyte-derived cfDNA using data from Illumina 450K arrays, on an independent group (n = 12 healthy controls, 7 patients with metastatic cancer not involving the liver, and 6 patients with liver metastasis). Plasma samples were subjected to whole-methylome analysis using 450K arrays, and analyzed using an atlas of cell type–specific methylomes (13) (Methods). Hepatocyte cfDNA levels in cancer patients with liver metastasis compared with metastatic cancer patients with no liver metastasis; Wilcoxon’s P < 0.014.
Figure 2
Figure 2. Hepatocyte cfDNA in treatment-naive patients and in patients with different primary and metastatic cancers.
(A) Hepatocyte cfDNA in treatment-naive patients. Statistical significance was measured by Kruskal-Wallis test with Dunn’s post hoc correction for multiple comparisons. (B) Hepatocyte cfDNA in patients with cancer after breakdown by tissue of origin. Healthy controls (n = 65), breast (n = 19), colon (n = 42), lung (n = 33), pancreas (n = 33). Statistical significance was measured by Kruskal-Wallis test with Dunn’s post hoc correction for multiple comparisons. (C) Hepatocyte cfDNA in patients with pancreatic cancer after breakdown by tumor anatomic location. Pancreas head (n = 16) or neck (n = 1), versus pancreas tail (n = 6), Mann-Whitney U test. (D and E) Alkaline phosphatase (D) and bilirubin (E) in pancreatic cancer patients after breakdown to tumor anatomic location. Pancreas head (n = 16) or neck (n = 1), versus pancreas tail (n = 5), Mann-Whitney U test.
Figure 3
Figure 3. Specificity and sensitivity of brain methylation markers.
(A) Methylation status of 10 brain-derived markers in genomic DNA from multiple human tissues. Each color represents a different locus that is differentially hypomethylated in a specific brain cell type. Shown is the methylation score of multiple CpG sites in each block (i.e., the fraction of molecules that are fully unmethylated in a given sample). (B) Sensitivity of brain-derived methylation markers. Brain DNA was spiked into leukocyte DNA as indicated, and the fraction of brain DNA was assessed using bisulfite conversion, multiplex PCR amplification of brain markers, and sequencing. Left, 20 brain cell GE (120 pg brain DNA) were mixed with blood DNA (0 to 10 ng). Right, brain cell DNA (20 to 0.2 GE) was diluted into 10 ng of blood DNA.
Figure 4
Figure 4. Plasma concentrations of brain-derived cfDNA.
(AC) Brain cfDNA levels in healthy controls (n = 127), cancer patients (localized and non-brain-metastatic, n = 113), and cancer patients with metastases to the brain (n = 29). Shown are the average levels in plasma of 4 neuronal markers (A), 3 oligodendrocyte markers (B), and 3 astrocyte markers (C). Each dot represents 1 plasma sample. Numbers in the figure indicate samples with 0/above 0 cfDNA molecules with a brain-derived signature. Statistical significance was measured by Kruskal-Wallis test with Dunn’s post hoc correction for multiple comparisons. (DF) Brain cfDNA levels as in AC, expressed as percentage of cfDNA derived from the indicated brain cell type. Statistical significance was measured by Kruskal-Wallis test with Dunn’s post hoc correction for multiple comparisons. (GI) ROC curve for the diagnosis of brain collateral damage in plasma of cancer patients with brain metastasis compared to cancer patients without brain metastases. (G) Neuronal markers; AUC 0.75, 95% CI = 0.66 to 0.84; P < 0.0001. (H) Oligodendrocyte markers; AUC 0.81; 95% CI = 0.72 to 0.89; P < 0.0001. (I) Astrocyte markers; AUC 0.72, 95% CI = 0.63 to 0.81; P < 0.0001. (J) Plasma concentrations of total cfDNA in the same donors as in AC. Statistical significance was measured by Kruskal-Wallis test with Dunn’s post hoc correction for multiple comparisons.

References

    1. Mantovani A, et al. Cancer-related inflammation. Nature. 2008;454(7203):436–444. doi: 10.1038/nature07205. - DOI - PubMed
    1. De Palma M, et al. Microenvironmental regulation of tumour angiogenesis. Nat Rev Cancer. 2017;17(8):457–474. doi: 10.1038/nrc.2017.51. - DOI - PubMed
    1. Egeblad M, et al. Tumors as organs: complex tissues that interface with the entire organism. Dev Cell. 2010;18(6):884–901. doi: 10.1016/j.devcel.2010.05.012. - DOI - PMC - PubMed
    1. Wirtz D, et al. The physics of cancer: the role of physical interactions and mechanical forces in metastasis. Nat Rev Cancer. 2011;11(7):512–522. doi: 10.1038/nrc3080. - DOI - PMC - PubMed
    1. Lehmann-Werman R, et al. Identification of tissue-specific cell death using methylation patterns of circulating DNA. Proc Natl Acad Sci U S A. 2016;113(13):E1826–E1834. doi: 10.1073/pnas.1519286113. - DOI - PMC - PubMed

Publication types

MeSH terms