. 2022 Jan 25;7(2):e152638.
doi: 10.1172/jci.insight.152638.

The interaction of secreted phospholipase A2-IIA with the microbiota alters its lipidome and promotes inflammation

Affiliations

The interaction of secreted phospholipase A2-IIA with the microbiota alters its lipidome and promotes inflammation

Etienne Doré et al. JCI Insight. .

Abstract

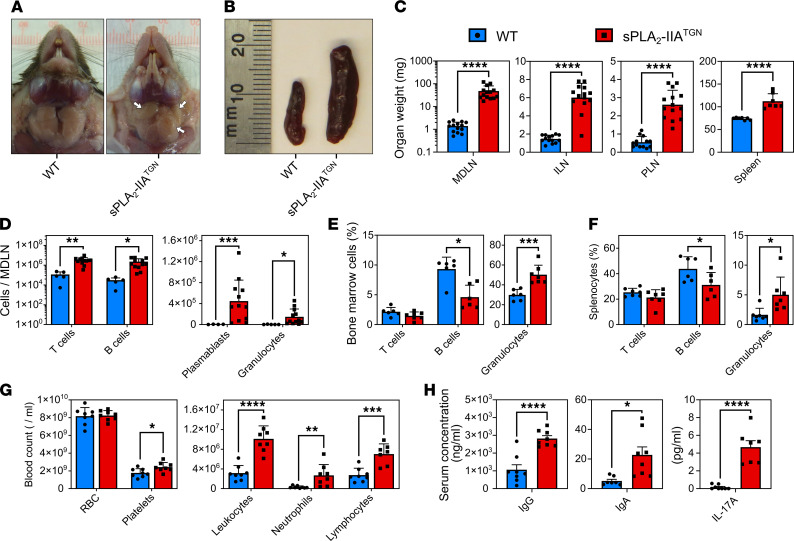
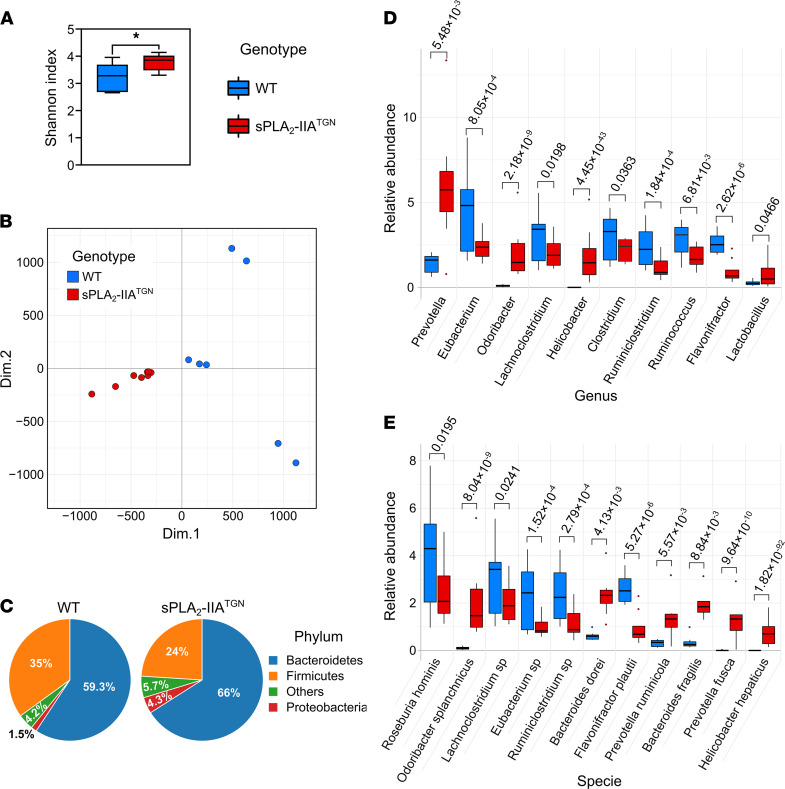
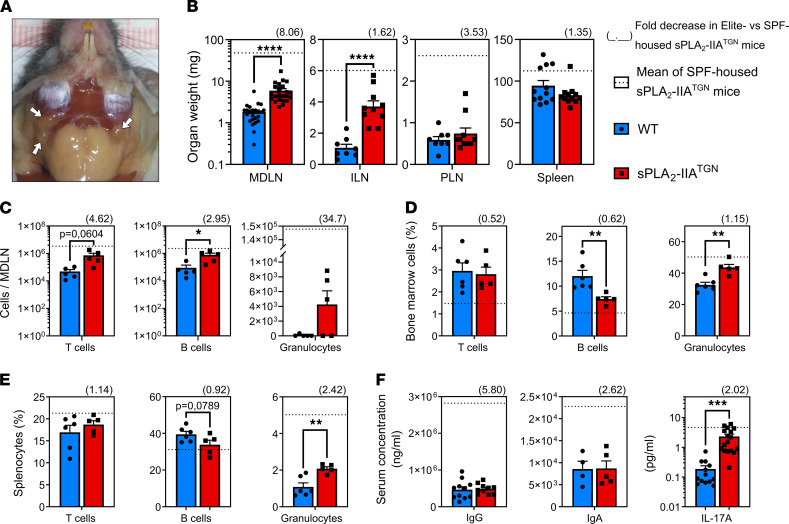
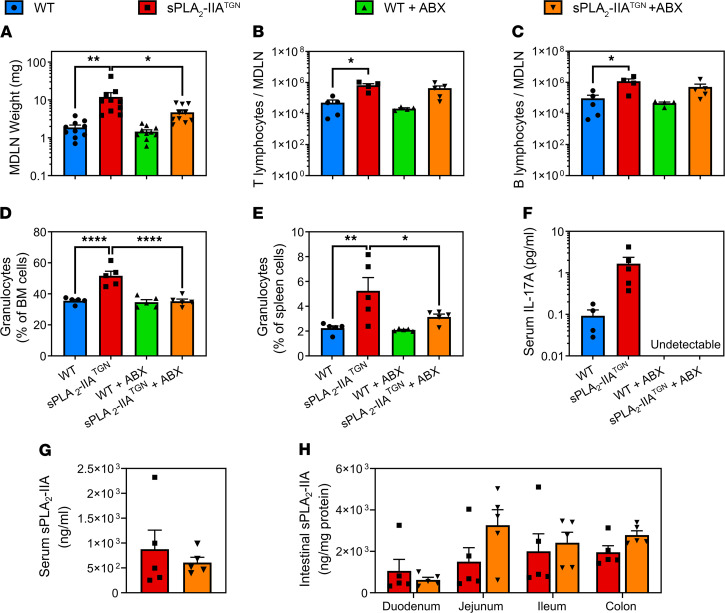
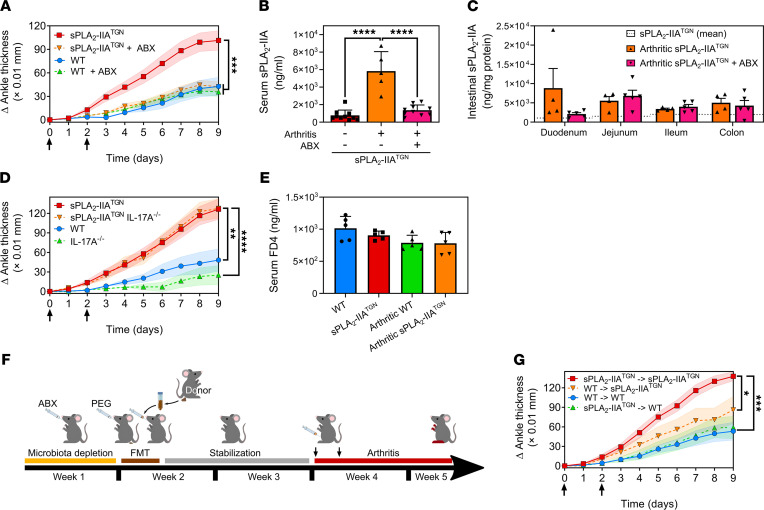
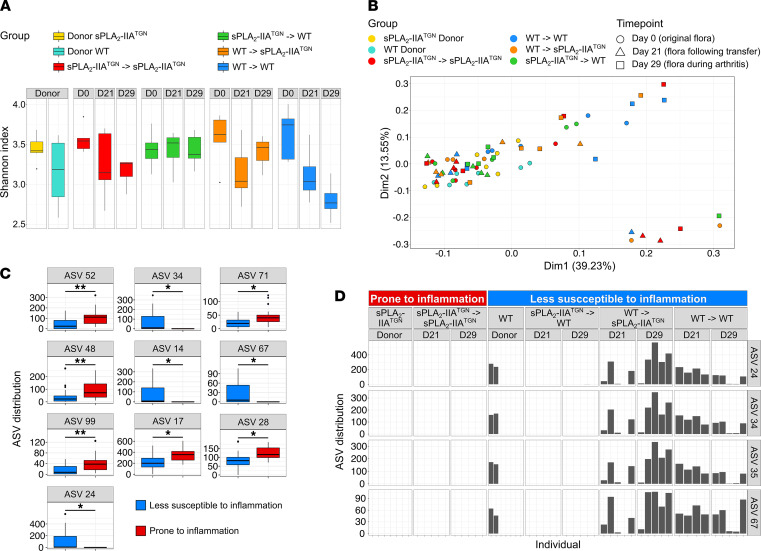
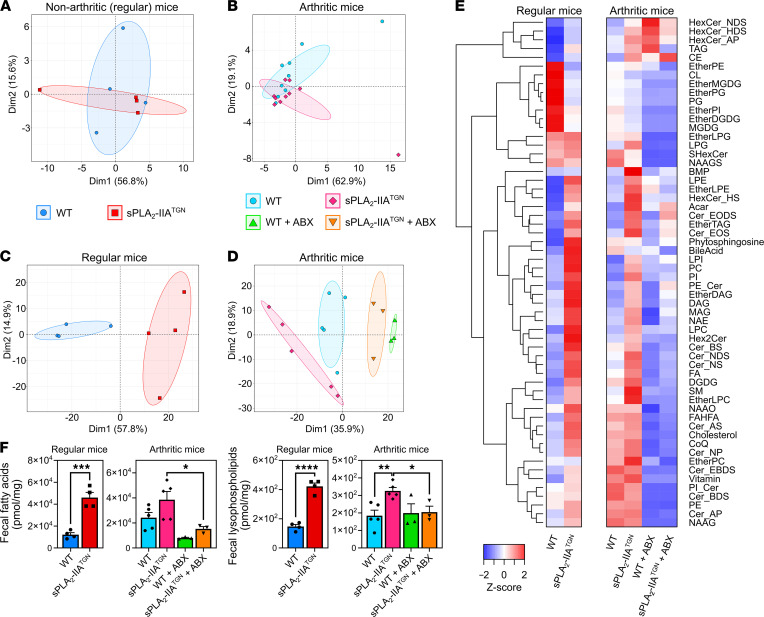
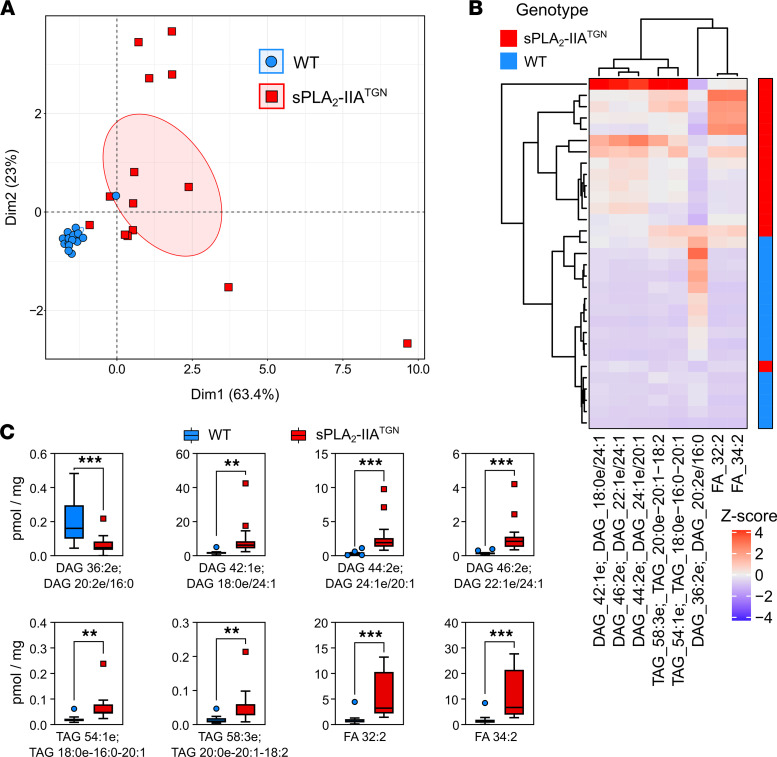
Secreted phospholipase A2-IIA (sPLA2-IIA) hydrolyzes phospholipids to liberate lysophospholipids and fatty acids. Given its poor activity toward eukaryotic cell membranes, its role in the generation of proinflammatory lipid mediators is unclear. Conversely, sPLA2-IIA efficiently hydrolyzes bacterial membranes. Here, we show that sPLA2-IIA affects the immune system by acting on the intestinal microbial flora. Using mice overexpressing transgene-driven human sPLA2-IIA, we found that the intestinal microbiota was critical for both induction of an immune phenotype and promotion of inflammatory arthritis. The expression of sPLA2-IIA led to alterations of the intestinal microbiota composition, but housing in a more stringent pathogen-free facility revealed that its expression could affect the immune system in the absence of changes to the composition of this flora. In contrast, untargeted lipidomic analysis focusing on bacteria-derived lipid mediators revealed that sPLA2-IIA could profoundly alter the fecal lipidome. The data suggest that a singular protein, sPLA2-IIA, produces systemic effects on the immune system through its activity on the microbiota and its lipidome.

Keywords: Arthritis; Inflammation; Microbiology; Molecular pathology; Mouse models.


Conflict of interest statement

Conflict of interest: The authors have declared that no conflict of interest exists.

Figures

Figure 1
Figure 1. Spontaneous induction of immune disturbances in sPLA2-IIATGN mice.
(A and B) Representative mandibular lymph nodes (MDLN, white arrows) and spleen of 8-month-old WT and sPLA2-IIATGN mice housed in a SPF animal facility (n = 8). (C) Weight of MDLNs (n = 14), inguinal lymph nodes (ILN, n = 14), popliteal lymph nodes (PLN, n = 13–14), and the spleen (n = 7) from both mouse groups. (DF) Flow cytometric analysis with markers targeting T cells (CD3+B220), B cells (B220+CD3), plasmablasts (CD19+CD138+), and granulocytes (Gr1+). (DF) Cell counts are represented for MDLNs (n = 5 WT and 12 sPLA2-IIATGN), and cell proportions are represented for the BM (n = 6–7) and spleen (n = 6–7) of 8-month-old WT and sPLA2-IIATGN mice. (G) Blood composition of both mouse groups determined by complete blood count (n = 8). (H) Quantification of type G (IgG) and type A (IgA) immunoglobulin by ELISA (n = 8) and IL-17A by cytometric bead array (n = 7–8) in the serum of WT and sPLA2-IIATGN mice. Data from 7 separate experiments are presented as mean ± SEM. Statistical analysis involved unpaired t test. *P < 0.05, **P < 0.01, ***P < 0.001, ****P < 0.0001.
Figure 2
Figure 2. sPLA2-IIATGN mice housed in a SPF facility present an altered intestinal flora.
A whole-genome shotgun sequencing approach was used to identify the bacterial composition of fecal samples from 8-month-old WT and sPLA2-IIATGN mice housed in a SPF animal facility. (A) α-Diversity (Shannon index) of the fecal microbiomes in each group (n = 7–8). (B) Principal component analysis comparing the composition of these microbiomes. (C) Representation of the relative abundance of the most abundant phyla in each group. (D and E) Most abundant and differentially enriched genera and species in WT and sPLA2-IIATGN mice based on a differential enrichment analysis. (A, D, and E) Data are presented as boxes representing the median and quartiles, with whiskers extending up to 1.5 interquartile range. Statistical analysis included the following: (A) unpaired t test and (D and E) Wald test with P value corrected by Benjamini-Hochberg FDR procedure. In E, when analysis could not identify the species, “sp” was added to the identified genus. *P < 0.05.
Figure 3
Figure 3. Impact of the housing environment on the immune phenotype.
WT and sPLA2-IIATGN mice were housed in an Elite SPF+ animal facility for 14 months before the severity of the immune phenotype was assessed. (A) Representative mandibular lymph nodes (MDLN, white arrows) of sPLA2-IIATGN mice (n = 12). (B) Weight of MDLNs (n = 24), ILNs (n = 8–10), PLNs (n = 8–10), and spleen (n = 12) of both mouse groups. (CE) Flow cytometric analysis with markers targeting T cells (CD3+CD19), B cells (CD19+CD3), and granulocytes (Gr1+). (CE) Counts are displayed for MDLNs (n = 5), and the proportion of each cell type is displayed for the BM (n = 5–6) and spleen (n = 5–6) of WT and sPLA2-IIATGN mice. (F) Quantification of IgG (n = 10–11) and IgA (n = 5) by ELISA and IL-17A (n = 13–17) by cytometric bead array in the serum of WT and sPLA2-IIATGN mice. (BE) Fold decrease of sPLA2-IIATGN mice housed in the Elite environment compared with sPLA2-IIATGN mice housed in the SPF animal facility is represented as a number in parentheses over each graph. Dotted line represents mean of sPLA2-IIATGN mice housed in the SPF animal facility (see Figure 1). Data from 3–4 separate experiments are presented as mean ± SEM. Statistical analysis included unpaired t test. *P < 0.05, **P < 0.01, ***P < 0.001, ****P < 0.0001.
Figure 4
Figure 4. The depletion of the intestinal flora reduces the severity of the immune phenotype.
The microbiota of 1-year-old WT and sPLA2-IIATGN mice housed in an Elite SPF+ animal facility was depleted using broad-spectrum antibiotics for 6 weeks prior to assessment of the immune phenotype. (A) Weight of MDLNs following antibiotic treatment (n = 10). (BE) Flow cytometric analysis with markers targeting T cells (CD3+CD19), B cells (CD19+CD3), and granulocytes (Gr1+) (n = 5). T lymphocyte and B lymphocyte counts in MDLNs are shown, and the proportion of granulocytes in the BM and spleen of WT and sPLA2-IIATGN mice treated or not with antibiotics is displayed. (F) Dosage of IL-17A by cytometric bead array in the serum of all mouse groups (n = 5). (G and H) Concentration of sPLA2-IIA quantified by time-resolved fluoroimmunoassay in serum and intestinal lysates of sPLA2-IIATGN mice treated or not with antibiotics (n = 5). Data from 1 experiment are presented as mean ± SEM. Statistical analysis included 1-way ANOVA with Dunnett’s multiple comparisons test. *P < 0.05, **P < 0.01, ****P < 0.0001.
Figure 5
Figure 5. The sPLA2-IIA–mediated increased susceptibility to arthritis is dependent upon the intestinal flora.
(A) Twelve-week-old WT and sPLA2-IIATGN mice housed in an Elite SPF+ animal facility were administered broad-spectrum antibiotics for 23 days. On experimental days 14 and 16, mice were injected i.p. with 150 μL of K/B×N serum (black arrows) to induce arthritis, and the disease severity was monitored daily by measuring ankle thickness (n = 16–30 from 2 separate experiments). (B and C) Quantification of sPLA2-IIA by time-resolved fluoroimmunoassay in serum (n = 5–10) and the intestinal compartments of arthritic sPLA2-IIATGN mice treated or not with antibiotics (n = 4–5). Dotted line indicates mean concentration in sPLA2-IIATGN mice. (D) The severity of serum-transferred arthritis was evaluated in 12-week-old transgenic mice depleted of IL-17A (IL-17A−/−) (n = 8–10). (E) Assessment of intestinal permeability in arthritic and nonarthritic mice by quantification of serum 4 kDa FITC-Dextran (FD4) translocated to the circulation following administration by oral gavage (n = 5). (F and G) Ten-week-old WT and sPLA2-IIATGN mice were administered antibiotics for 1 week to deplete their microbiota. On day 7, mice were administered a polyethylene-glycol–based laxative to empty their bowels, and a fecal microbiota transplantation (FMT) was performed. In brief, fresh fecal matter solution was administered by oral gavage to mice once a day for 3 consecutive days. Mice were then allowed to rest for 10 days before arthritis was induced by injection of K/B×N serum (black arrows). The severity of the disease was monitored daily (n = 10). Data from 1 (CG) to 2 (A and B) separate experiments are presented as mean ± SEM. Statistical analysis included the following: (A, D, and G) repeated-measures 2-way ANOVA evaluating the statistical variation between groups. (B, C, and E) One-way ANOVA with Tukey’s multiple comparisons test. *P < 0.05, **P < 0.01, ***P < 0.001, ****P < 0.0001.
Figure 6
Figure 6. Mice with enhanced arthritis susceptibility present limited microbiota alterations.
The fecal microbiota of donor and recipient mice involved in the fecal microbiota transplantation was sequenced at 3 different time points: before the transplantation (D0), 10 days following the transplantation (D21), and 8 days following the induction of arthritis (D29). (A) α-Diversity (Shannon index) of the microbiome of each mouse group at every time point (n = 5–7). (B) Principal component analysis based on the Bray Curtis dissimilarity comparing the flora from all mouse groups. (C and D) Groups were organized into 2 categories depending on their susceptibility to induced arthritis: sPLA2-IIATGN donors and sPLA2-IIATGN mice receiving the flora from sPLA2-IIATGN donors were classified as “Prone to inflammation,” and WT donors, WT recipients, and sPLA2-IIATGN mice receiving the WT flora were labeled “Less susceptible to inflammation.” (C) Distribution of amplicon sequence variants (ASV) differentially modulated between categories. (D) Distribution of differentially enriched ASVs found only in WT donors and their recipient mouse groups within every mouse. Bacterial species with highest percentage of identity for each differentially enriched ASV are as follows: ASV 52, Ruminococcus bromii (99%); ASV 48, Vallitalea promyensis (87%); ASV 99, Anaerobacterium chartisolvens (88%); ASVs 24, 34, and 35, uncultured Muribaculum species (100%); ASV 17, Muribaculum intestinale (91%); ASV 71, Pseudoflafonifractor phocaeensis (89%); ASV 67, Uncultured Muribaculum specie (96%); and ASV 28, Muribaculum intestinale (92 %). Data are presented as boxes representing the median and quartiles, with whiskers extending up to 1.5 interquartile range. Statistical analysis included Welch’s t test with P value corrected by Benjamini-Hochberg FDR procedure. Percentage of identity represent the percentage of similarity to the closest known sequence (Blastn using RefSeq NT). *P < 0.05, **P < 0.01.
Figure 7
Figure 7. Mice expressing sPLA2-IIA possess an altered fecal lipidome.
The intestinal and fecal lipid profile of 14-month-old and arthritic 14-week-old male mice housed in the Elite SPF+ animal facility was investigated. (A and B) Lipids were isolated from intestinal samples and identified using high-performance liquid chromatography combined with mass spectrometry. The data distributions for 14-month-old (n = 4) (A) and 14-week-old arthritic mice (n = 9–10) (B) were visualized by principal component analysis (PCA) with 99 % confidence ellipses. (CF) An untargeted lipidomic analysis was performed using murine fecal samples. Data from 14-month-old (C) and 14-week-old arthritic mice (D) treated or not with antibiotics were visualized by PCA with 99 % confidence ellipses (n = 3–5). (E) Heatmap of the Z scores of the measured lipid classes for each experimental group. (F) Concentration of total fatty acids and lysophospholipids in samples from each mouse group (n = 3–5). (F) Data are presented as mean ± SEM. Statistical analysis included the following: unpaired t test and 1-way ANOVA with Šidák multiple comparisons test. *P < 0.05, **P < 0.01, ***P < 0.001, ****P < 0.0001.
Figure 8
Figure 8. Identification of the expression of sPLA2-IIA using its fecal lipid signature.
Machine learning was used to generate a fecal lipid signature able to distinguish WT and sPLA2-IIATGN mice independently of their housing facility and sex (n = 15–16 nonarthritic WT and sPLA2-IIATGN mice housed in either the SPF or Elite animal facility for 8 or 14 months, respectively). (A) Visualization of the data distribution using the identified lipids by PCA with 99% confidence ellipses to confirm the discrimination between the groups. (B) Heatmap of the Z scores — i.e., the number of SD above or below the mean, calculated from the concentration of the lipids. (C) Concentration of the 8 identified lipid metabolites in fecal samples. DAG, diacylglycerol; TAG, triacylglycerol; FA, fatty acid. Data are presented as boxes representing the median and quartiles, with whiskers extending up to 1.5 interquartile range. Statistical analysis included unpaired t test. **P < 0.01, ***P < 0.001.

References

    1. Sender R, et al. Revised estimates for the number of human and bacteria cells in the body. PLoS Biol. 2016;14(8):e1002533. doi: 10.1371/journal.pbio.1002533. - DOI - PMC - PubMed
    1. Jandhyala SM, et al. Role of the normal gut microbiota. World J Gastroenterol. 2015;21(29):8787–8803. doi: 10.3748/wjg.v21.i29.8787. - DOI - PMC - PubMed
    1. Tremaroli V, Bäckhed F. Functional interactions between the gut microbiota and host metabolism. Nature. 2012;489(7415):242–249. doi: 10.1038/nature11552. - DOI - PubMed
    1. Rangan KJ, Hang HC. Biochemical mechanisms of pathogen restriction by intestinal bacteria. Trends Biochem Sci. 2017;42(11):887–898. doi: 10.1016/j.tibs.2017.08.005. - DOI - PMC - PubMed
    1. Wu HJ, Wu E. The role of gut microbiota in immune homeostasis and autoimmunity. Gut Microbes. 2012;3(1):4–14. doi: 10.4161/gmic.19320. - DOI - PMC - PubMed

Publication types

Substances