. 2022 Apr;9(11):e2103940.
doi: 10.1002/advs.202103940. Epub 2022 Jan 25.

Identification of a STIM1 Splicing Variant that Promotes Glioblastoma Growth

Affiliations

Identification of a STIM1 Splicing Variant that Promotes Glioblastoma Growth

Jiansheng Xie et al. Adv Sci (Weinh). 2022 Apr.

Abstract

Deregulated store-operated calcium entry (SOCE) mediated by aberrant STIM1-ORAI1 signaling is closely implicated in cancer initiation and progression. Here the authors report the identification of an alternatively spliced variant of STIM1, designated STIM1β, that harbors an extra exon to encode 31 additional amino acids in the cytoplasmic domain. STIM1β, highly conserved in mammals, is aberrantly upregulated in glioma tissues to perturb Ca2+ signaling. At the molecular level, the 31-residue insertion destabilizes STIM1β by perturbing its cytosolic inhibitory domain and accelerating its activation kinetics to efficiently engage and gate ORAI calcium channels. Functionally, STIM1β depletion affects SOCE in glioblastoma cells, suppresses tumor cell proliferation and growth both in vitro and in vivo. Collectively, their study establishes a splicing variant-specific tumor-promoting role of STIM1β that can be potentially targeted for glioblastoma intervention.

Keywords: STIM1; calcium signaling; cell signaling; glioblastoma; splicing.


Conflict of interest statement

The authors declare no conflict of interest.

Figures
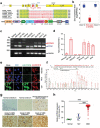
Figure 1
Figure 1
Discovery of STIM1β as a STIM1 alternative splicing variant that is upregulated in certain types of cancer. Data were shown as mean ± sem. a) Schematic of exon boundaries and alternative splicing of a previously‐unrecognized STIM1 variant (STIM1β). The primer pairs used to amplify the splice variant STIM1β or conventional STIM1 are shown as arrows. cEF/hEF, canonical or hidden EF‐hand; SAM, sterile alpha‐motif; TM, transmembrane domain; CC1, coiled coil region 1; CAD/SOAR, the STIM ORAI‐activating region; ID, inhibitory domain; PAD, pro‐activation domain; P/S, proline/serine‐rich region; PB, polybasic tail. b) The expression abundance of exon 10, the extra exon found in STIM1β (red), and exon 11 revealed by RNA‐seq. Boxplots denote expression distribution of each exon and each dot denotes RNA‐seq signals from one dataset. c,d) Comparison of the mRNA levels of STIM1 and STIM1β splice variants in selected cells by RT‐PCR. c) Agarose gel electrophoresis of PCR amplification of the region between exon 10 and exon 11. d) The relative expression ratio of STIM1β over STIM1 in the indicated cells. e) Immunostaining of STIM1β (green) in selected cell lines using a home‐made antibody specifically against STIM1β. Red, SEC61β as an ER marker. Scale bar, 10 µm. f) Detection of STIM1β protein in U87 cells with mass spectrometry. The polypeptide region containing PAD (underlined) was selected to perform MS/MS analysis to characterize its sequence identity. Assigned bn/yn fragments were listed with the corresponding peptide sequences. An anti‐STIM1β antibody was used to enrich STIM1β from cell lysates. g) IHC staining of STIM1β in normal, normal adjacent tissues of tumor (NAT), and cancerous tissues from patients with brain tumors. h) Quantification of STIM1β expression in patient samples shown in panel (g) (Normal, n = 10; NAT, n = 4; GBM, n = 80). Also see Figure S3, Supporting Information.
Figure 2
Figure 2
STIM1β contributes to SOCE and is prone to be activated. Data were shown as mean ± sem. Unpaired Student's t‐test. a) Ca2+ influx as monitored by Fura‐2 fluorescence in ORAI1‐CFP HEK293 stable cells cotransfected with STIM1‐YFP and STIM1β‐YFP, respectively, at comparable levels. Store depletion was induced by 1 µm thapsigargin (TG). Shown were representative traces (left), n  =  50 cells. The expression of STIM was at comparable levels based on YFP fluorescence intensities shown in the middle panel. The level of SOCE (n = 5) was summarized in the bar graph from five independent experiments (right), where each dot represents the average value from 30–60 cells. *p = 0.027. b) Comparison of Ca2+ entry in HEK293 STIM1/STIM2 double knockout (STIM‐DKO) cells expressing STIM1‐YFP or STIM1β‐YFP. The ratiometric Ca2+ sensor, GEM‐GECO, was used to monitor cytosolic Ca2+. n = 4 replicates, Each replicate counts for 30–60 cells. *p = 0.016. c) Immunoblot analysis to confirm the knockdown efficiency of STIM1β‐targeting shRNAs in STIM1β‐GFP U87 stable cells. β‐actin was used as loading control. d) Relative mRNA expression of STIM1β in U87 cells following shRNA‐mediated knockdown. n = 3. **p < 0.01. e) Representative recordings of Ca2+ influx as indicated by Fura‐2 in U87 cells upon shRNA treatment (left, the average value from ≈30–60 cells). Quantitation of SOCE for U87 cells was shown on the right. (n = 4; *p = 0.017 compared to control). f,g) Comparison of the activation kinetics of STIM1 and STIM1β. Representative confocal images (f) of mixed COS‐7 cells stably expressing STIM1‐mCh and STIM1β‐GFP, respectively, which showed protein clustering after store depletion triggered by 1 µm TG. g) Time course of STIM clustering. The half‐lives of activation were determined to be: STIM1β, t 1/2 = 37.9 ± 6.7 s; STIM1, t 1/2 = 56.9 ± 6.6 s. n = 12 cells from three independent experiments.
Figure 3
Figure 3
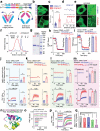
The cytoplasmic domain of STIM1β (STIM1β‐CT) is a more potent activator of ORAI1. a) Schematic representation of the domain architectures of STIM1‐CT and STIM1β‐CT. b,c) Confocal images (b) showing the subcellular distribution of YFP‐tagged STIM1‐CT and STIM1β‐CT. c) Quantification of the subcellular distribution ratio (PM/cytosol) of STIM1‐CT and STIM1β‐CT. n  =  54 cells from three independent experiments. d,e) YFP‐STIM1β‐CT displaying comet‐like patterns due to tracking of microtubule plus ends in ORAI‐KO HeLa cells. d) The fluorescence intensities (YFP) across the dashed line in panel (e) were plotted to evaluate the degree of comet formation. e) Selected confocal images showing different cytosolic distribution of STIM1‐CT and STIM1β‐CT. The selected regions (dashed boxes) were enlarged to aid visualization (right). Scale bar 5 µm. f,g) Elution profiles of purified recombinant STIM1‐CT and STIM1β‐CT when subjected to size exclusion chromatography. The molecular weights of standard protein samples were indicated above the elution profiles. g) The eluted fractions were collected and resolved on SDS‐PAGE. The isolated fractions (STIM1β‐CT at the elution volume of 7.5–8.5 mL; STIM1‐CT at 11.5–12.5 mL) were resolved by SDS‐PAGE. A dotted line indicated the separation between the sample lanes and the marker lane. h,i) FRET signals monitored in HEK293 cells co‐expressing STIM11‐342‐CFP (donor) and YFP‐tagged STIM‐CT fragments (acceptor) before and after TG‐induced store depletion. STIM1343‐491 versus STIM1β343‐522 (h) and STIM1343‐685 versus STIM1β343‐716 (i). The resting FRET signals were plotted on the right, n = 4 independent experiments with 30–50 cells per experiment. j–m) Real‐time FRET signals (top) and constitutive Ca2+ entry (bottom) visualized in ORAI1‐CFP HEK293 stable cells expressing YFP‐tagged STIM‐CT variants, STIM1233‐685 versus STIM1β233‐716 (j), STIM1233‐491 versus STIM1β233‐522 (k), STIM1343‐685 versus STIM1β343‐716 (l), or STIM1343‐491 versus STIM1β343‐522 (m). The FRET values and Ca2+ responses (n = 4) were plotted on the right. Each dot represents the average value from 30–50 cells. n) The putative non‐covalent interactions between Asp/Glu negatively‐charged clusters of the ID domain and the positive Arg‐rich sequence within PAD in the model structure of the STIM1β461‐523. The distance between the side chains (N‐H—O) was 2.8–2.9 Å. o) Real‐time FRET signals in ORAI1‐CFP HEK293 stable cells expressing YFP‐STIM1β343‐522 (WT and the indicated mutants). n = 60–80 cells from three independent experiments. p,q) Constitutive Ca2+ entry was triggered by transition from 0 to 1 mm extracellular Ca2+ in ORAI1‐CFP HEK293 stable cells expressing YFP‐STIM1β343‐522 (WT and its mutants). n = 60–80 cells from three independent experiments. All error bars denote S.E.M. *p ˂ 0.05, **p ˂ 0.01, ***p ˂ 0.001, ****p ˂ 0.0001. Unpaired Student's t‐test.
Figure 4
Figure 4
STIM1β depletion suppresses glioblastoma cell growth. Data were shown as mean ± sem. *p ˂ 0.05, ** p ˂ 0.01 ****p ˂ 0.0001. Unpaired Student's t‐test. a,b) Immunoblotting to confirm the knockdown (a) and knockout (b) of STIM1β in U87 cells. c,d) Evaluation of TG‐evoked Ca2+ influx in U87 cells (control and STIM1β knockout; (c)). d) Quantification of mean SOCE (n = 6 biological replicates). Approximately 30–60 cells were selected in each experiment. e–g) Effects of STIM1β knockdown (shSTIM1β) or knockout (STIM1β‐KO) on U87 cell growth (n = 3) (e), cell cycle (n = 2) (f), and migration revealed by the transwell assay (n = 4) (g). Scale bar, 50 µm. h) Effect of STIM1β knockout on the formation of gliomasphere in serum‐free neural stem cell culture media. Scale bar, 50 µm. i–l) STIM1β depletion inhibited U87 glioblastoma growth in a mouse xenograft model (n = 3). i) Representative images of mice bearing WT (control) or STIM1β KO U87 cell xenografts. j) Representative tumor images. k) Quantification of the tumor size at the indicated time points. l) Statistics of tumor weight. (n = 5–6 mice/group). m) HE and Ki‐67 staining of representative U87 xenograft tumors. Scale bar, 20 µm. n) Representative bioluminescence images of U87‐Luc and shSTIM1β U87‐Luc xenografts inoculated in the mouse brain. Nude mice were intracranially implanted with U87‐Luc and shSTIM1β U87‐Luc GBM cells (1 × 10⁵ cells/mouse). The tumor size was estimated by monitoring bioluminescence imaging (BLI). o) Quantification of BLI signals from the indicated groups (n = 5–6 mice/group).
Figure 5
Figure 5
A tentative model to explain STIM1β activation. At the resting condition, the full length STIM1 contains all three inhibitory regions to prevent pre‐activation: 1) ER luminal EF‐SAM autoinhibition; 2) cytoplasmic CC1‐SOAR autoinhibition; and 3) inhibitory domain (ID), which work concertedly to force STIM1 adopting a folded‐back configuration and keep itself inactive. After removal of the luminal EF‐SAM domain, the STIM1 cytoplasmic domain (STIM1‐CT) remains largely inactive because of the existence of two remaining braking mechanisms. For STIM1β, the additional insertion of 31‐residue in the PAD region may perturb the inhibitory function of ID to compromise the autoinhibitory machinery in STIM1β. Although STIM1β still adopts a largely inactive status, its activation kinetics and gating ability to ORAI channels are greatly enhanced. Compared with the largely‐inactive STIM1‐CT, STIM1β‐CT assumes a conformation that is more prone for activation after removal/weakening of two inhibitory brakes. Please note that the oligomeric state, relative positioning and orientation of each domain in the cartoon are yet to be determined by further structural studies.

Similar articles

Cited by

References

    1. a) Prakriya M., Lewis R. S., Physiol. Rev. 2015, 95, 1383. - PMC - PubMed
    2. b) Hogan P. G., Lewis R. S., Rao A., Annu. Rev. Immunol. 2010, 28, 491. - PMC - PubMed
    3. c) Soboloff J., Rothberg B. S., Madesh M., Gill D. L., Nat. Rev. Mol. Cell Biol. 2012, 13, 549. - PMC - PubMed
    4. d) Nguyen N. T., Han W., Cao W. M., Wang Y., Wen S., Huang Y., Li M., Du L., Zhou Y., Compr. Physiol. 2018, 8, 981. - PubMed
    1. Derler I., Jardin I., Romanin C., Am. J. Physiol. Cell Physiol. 2016, 310, C643. - PMC - PubMed
    1. a) Rosado J. A., Diez R., Smani T., Jardin I., Front. Pharmacol. 2015, 6, 325. - PMC - PubMed
    2. b) Darbellay B., Arnaudeau S., Bader C. R., Konig S., Bernheim L., J. Cell Biol. 2011, 194, 335. - PMC - PubMed
    3. c) Miederer A. M., Alansary D., Schwar G., Lee P. H., Jung M., Helms V., Niemeyer B. A., Nat. Commun. 2015, 6, 6899. - PMC - PubMed
    4. d) Rana A., Yen M., Sadaghiani A. M., Malmersjo S., Park C. Y., Dolmetsch R. E., Lewis R. S., J. Cell Biol. 2015, 209, 653. - PMC - PubMed
    1. Trebak M., Kinet J. P., Nat. Rev. Immunol. 2019, 19, 154. - PMC - PubMed
    1. a) Parekh A. B., Nat. Rev. Drug Discovery 2010, 9, 399. - PubMed
    2. b) Lacruz R. S., Feske S., Ann. N. Y. Acad. Sci. 2015, 1356, 45. - PMC - PubMed

Publication types

MeSH terms

LinkOut - more resources