. 2022 Mar 2;10(5):1231-1247.
doi: 10.1039/d1bm01421h.

Antioxidant Response Activating nanoParticles (ARAPas) localize to atherosclerotic plaque and locally activate the Nrf2 pathway

Affiliations

Antioxidant Response Activating nanoParticles (ARAPas) localize to atherosclerotic plaque and locally activate the Nrf2 pathway

Sophie Maiocchi et al. Biomater Sci. .

Abstract

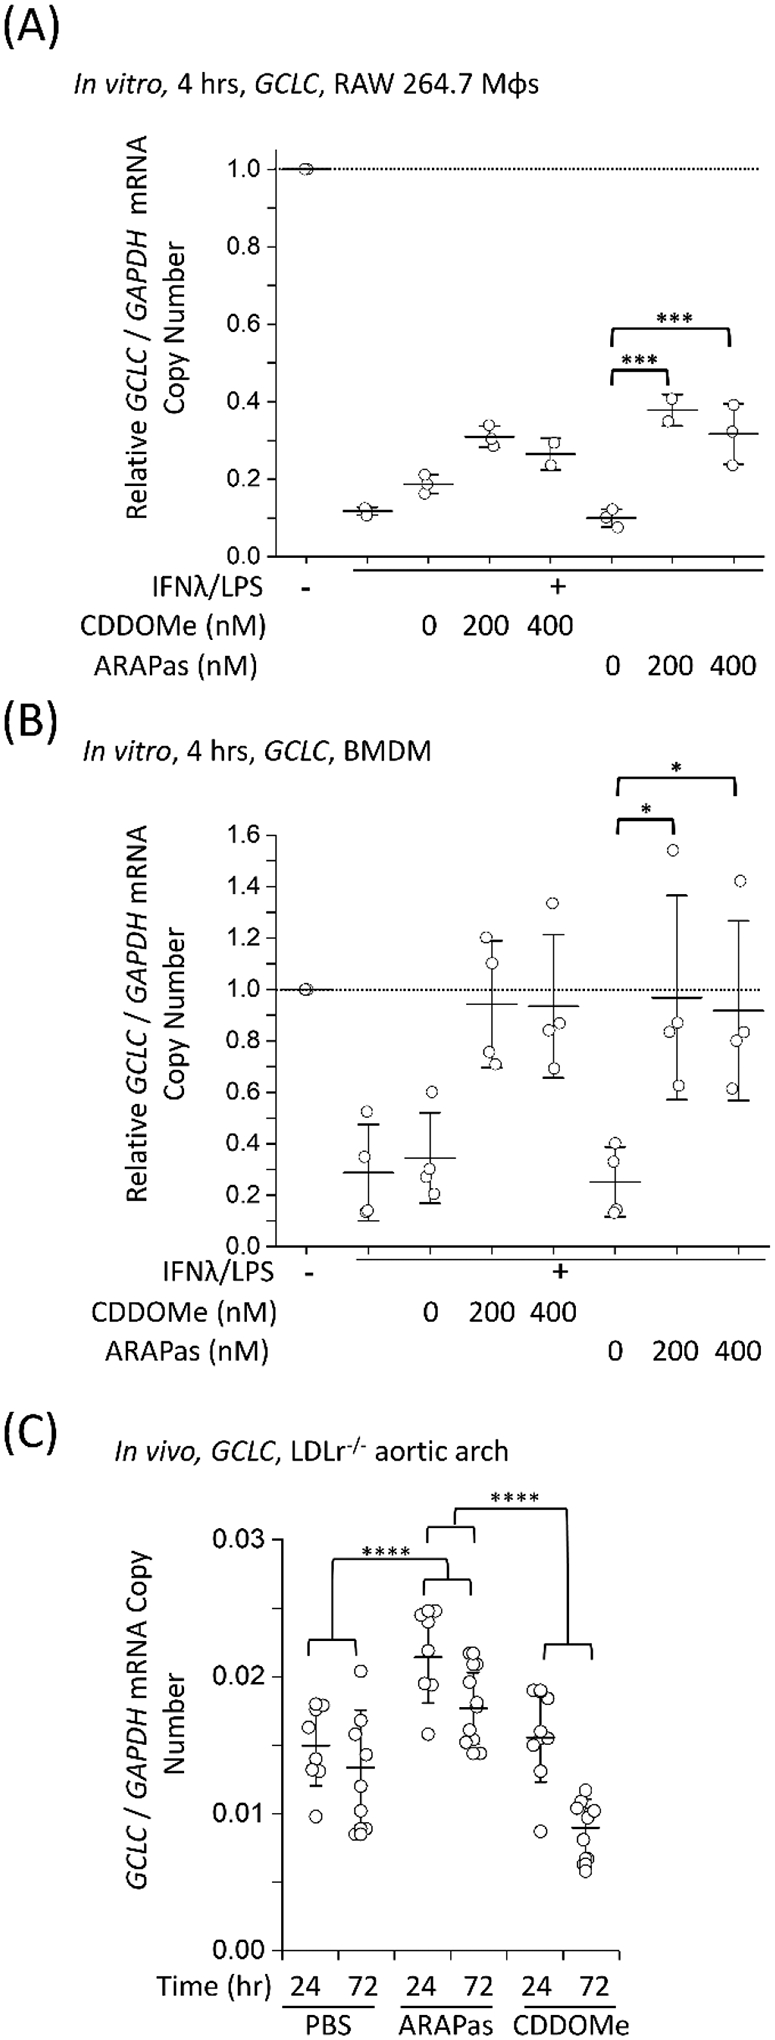
Atherosclerotic disease is the leading cause of death world-wide with few novel therapies available despite the ongoing health burden. Redox dysfunction is a well-established driver of atherosclerotic progression; however, the clinical translation of redox-based therapies is lacking. One of the challenges facing redox-based therapies is their targeted delivery to cellular domains of redox dysregulation. In the current study, we sought to develop Antioxidant Response Activating nanoParticles (ARAPas), encapsulating redox-based interventions, that exploit macrophage biology and the dysfunctional endothelium in order to selectively accumulate in atherosclerotic plaque. We employed flash nanoprecipitation (FNP) to synthesize bio-compatible polymeric nanoparticles encapsulating the hydrophobic Nrf2 activator drug, CDDO-Methyl (CDDOMe-ARAPas). Nuclear factor erythroid 2-related factor 2 (Nrf2)-activators are a promising class of redox-active drug molecules whereby activation of Nrf2 results in the expression of several antioxidant and cyto-protective enzymes that can be athero-protective. In this study, we characterize the physicochemical properties of CDDOMe-ARAPas as well as confirm their in vitro internalization by murine macrophages. Drug release of CDDOMe was determined by Nrf2-driven GFP fluorescence. Moreover, we show that these CDDOMe-ARAPas exert anti-inflammatory effects in classically activated macrophages. Finally, we show that CDDOMe-ARAPas selectively accumulate in atherosclerotic plaque of two widely-used murine models of atherosclerosis: ApoE-/- and LDLr-/- mice, and are capable of increasing gene expression of Nrf2-transcriptional targets in the atherosclerotic aortic arch. Future work will assess the therapeutic efficacy of intra-plaque Nrf2 activation with CDDOMe-ARAPas to inhibit atherosclerotic plaque progression. Overall, our present studies underline that targeting of atherosclerotic plaque is an effective means to enhance delivery of redox-based interventions.


Conflict of interest statement

Conflicts of interest

There are no conflicts to declare.

Figures

Figure 1.
Figure 1.. Synthesis and Characterization of CDDOMe-ARAPas.
(A) Schematic overview of the Flash Nanoprecipitation (FNP) method to generate CDDOMe-ARAPas using a confined impinging jet (CIJ) mixer. (B) Hydrodynamic diameter and polydispersity index (PDI) of CDDOMe-ARAPas with or without the lipophilic fluorescent dye, DiD (25μg/mL final concentration). These were measured via an Intensity Distribution with Dynamic Light Scattering (DLS). (C) Change in hydrodynamic diameter of CDDOMe-ARAPas following 6 days of incubation at 4°C, pH 7.4. DLS was used to show that the size was unchanged relative to freshly prepared CDDOMe-ARAPas. (D) Hydrodynamic diameter of CDDOMe-ARAPas determined via nanosight nanotracking analysis. The data for (A)-(D) represent the mean of 3–24 separate preparations of CDDOMe-ARAPas. (E) TEM of CDDOMe-ARAPas. Particles were adsorbed onto copper 400 mesh TEM grids were negatively stained with 2% uranyl acetate and imaged via TEM at 5000x magnification (scale bar = 5μm) and at (F) 100,000x magnification (scale bar = 200 nm). (G) Particle concentration as a function of temperature, pH and time. CDDOMe-ARAPas were diluted 5-fold either into 10mM PBS, pH 7.4 or into 5mM citrate buffer, pH 5 and maintained at either 4°C or 37°C for up to 48 hr. Total particle concentration was assayed at both 24 and 48 hr incubation via Zetaview Nanoparticle Tracking. A 3-way ANOVA to assess the effect of pH, time and temperature was conducted, following by post-hoc Tukey Pairwise comparisons (** P < 0.01).
Figure 2.
Figure 2.. Internalization of CDDOMe-ARAPas by murine macrophages.
(A) Kinetic association of CDDOMe-ARAPas with murine macrophages. RAW macrophages stained with Hoechst dye (10μg/mL, 30 minutes) were treated with fluorescent DiD-CDDOMe-ARAPas (0.1mg/mL final, 20% PBS) over the course of 18 hrs (37°C, 5% CO2). Fluorescent images of RAW macrophages were taken at 4 hour intervals and thresholded fluorescence area was quantified per cell, an average of 800 cells were counted per well. Data represents N=3 independent experiments in 6–12-tuplicate. (B) A representative image of macrophage-associated fluorescent DiD-CDDOMe-ARAPas at 18 hr. Scale bar is 30μm. (C) Z-projection and orthogonal slices of internalized DiD-CDDO-Me-ARAPas in cd11b stained macrophages. RAW macrophages were incubated in the presence or absence of fluorescent DiD-CDDOMe-ARAPas (0.1mg/mL final, 20% PBS) for 18 hrs (37°C, 5% CO2), and then fixed and counter-stained with cd11b antibody and DAPI. Scale bar is 10μm. (D) 3D rendered surface image of cd11b membrane, and internalized DiD-CDDO-Me-ARAPas in murine macrophages. Scale bar is 5μm. (E) Temperature-dependent internalization of DiD-CDDOMe-ARAPas at 18 hr by RAW macrophages. Macrophages were incubated with DiD-CDDOMe-ARAPas as described in (C), and then washed of un-associated ARAPas and the cell lysate assayed for fluorescence intensity and protein content. Data represents means ± 1 S.D. (N=3 independent experiments in triplicate). **, p <0.01.
Figure 3.
Figure 3.. Activation of Nrf2 by CDDOMe-ARAPas.
H1299 cells were treated with either 1% DMSO, P84 polymer (at equivalent concentrations as present in most concentrated NP preparations), CDDOMe (10–400nm), or CDDOMe-ARAPas (10–400nM) for 24–40 hours (37°C, 5% CO2). (A) Representative images of live cell GFP-NQO1 fluorescence as a proxy of Nrf2 activation in H1299 cells after 24 hours as collected by the Cytation 5 plate reader. Shown here is treatment with 1% DMSO vehicle, or P84 polymer at concentrations equivalent to that found in the most concentrated nanoparticle preparations, 100 nM CDDOMe-ARAPas and 100 nM CDDOMe. Scale bar is 100μm. (B) Dose-dependent activation of NQO1 transcription by CDDOMe (red solid line) and CDDOMe-ARAPas (black solid line). GFP fluorescence intensity per cell was quantified with an average of 200 cells counted per measurement. Data represents the means ± 1 S.D. of N=4–5 independent biological experiments, conducted in sextuplicate. (C) Time-dependent activation of NQO1 transcription by CDDOMe and CDDOMeNPs. H1299 cells were treated with either 1% DMSO, P84 polymer (at equivalent concentrations as present in most concentrated NP preparations), CDDOMe (solid lines, 50–200nm), or CDDOMe-ARAPas (dashed lines, 50–400nM) for up to 40 hours. GFP fluorescence intensity per cell was quantified with an average of 200 cells counted per measurement. Data represents the means ± SEM, N=2–4 independent biological experiments.
Figure 4.
Figure 4.. Toxicity of CDDOMe-ARAPas. (A) MTT of RAW 264.7 macrophages treated with CDDOMe or CDDOMe-ARAPas.
Murine macrophages were incubated with CDDOMe or CDDOMe-ARAPas in a 0–2000nM dose range. Data represents N = 3–5 independent experiments ± SEM with 8 replicates per experiment. Data were fitted with a growth/sigmoidal curve with a dose response function in OriginPro 2018b software where the upper asymptote was fixed at 100 and the lower asymptote unfixed. The R square (COD) value for the CDDOMe-ARAPas and CDDOMe fitted curve were 0.98 and 0.99 respectively. The EC50 was derived from the fitted curves and were 274 95% CI [220, 328] and 378 95% CI [348, 408] for CDDOMe and CDDOMe-ARAPas respectively. (B)-(C) Quantification of viable, early apoptotic, late apoptotic and dead RAW 264.7 macrophages following treatment with CDDOMe or CDDOMe-ARAPas. Macrophages were incubated for 24 hours with 25–1000nM (B) CDDOMe-ARAPas or (C) CDDOMe and then cells were analyzed by the Muse Annexin V and Dead Cell Assay Kit. *p < 0.05 compared to control (0 μM CDDOMe-(ARAPas)). Data presented as means ± SEM (N = 3–5 independent experiments in triplicate). Data were analyzed using multivariate analysis of variance (MANOVA) to compare the effect of treatment with either CDDOMe or CDDOMe-ARAPas as well as concentration on total live cell population and then total dead cell population (where early and late apoptotic and dead cell populations were grouped together). Based on this analysis, we found a significant difference due to concentration, Wilk’s Lambda λ = 0.302, (F(12,62) = 4.24, P<0.001), with a large effect size estimate ⍵2Mult = 0.637. No difference was found due to treatment with either CDDOMe or CDDOMe-ARAPas. A separate univariate analysis (two-way ANOVA) revealed that the significant effect was upon the live cell population (including both CDDOMe and ARAPas) (F(6,32) = 5.72, P < 0.001), but not the dead cell population. A one-way ANOVA was conducted to examine the effect of concentration of either CDDOMe or CDDOMe-ARAPas on total live cell population. The one-way ANOVA for CDDOMe was significant (F(6, 14) = 3.21, P = 0.034) and for CDDOMe-ARAPas (F(6, 18) = 3, P = 0.033). Tukey post-hoc tests found a significant difference between the live cell population at 0 and 1000nM treatment in both CDDOMe (P = 0.04952) and CDDOMe-ARAPas (P = 0.02475).
Figure 5.
Figure 5.. Inhibition of iNOS transcription, iNOS protein activity and expression in classically stimulated RAW 264.7 macrophages.
RAW 264.7 macrophages were classically stimulated with IFNλ (10ng/mL, 7 hr) followed by treatment with LPS (100 ng/mL, 4–24 hrs) in the presence or absence of treatments and their respective vehicles. The media was then collected and cells were either washed and scraped into sterile HBSS and pelleted for RNA extraction, or fixed (2% PFA), permeabilized (0.3% Triton X-100 in 10mM PBS) and then stained with anti-iNOS antibody followed by an appropriate secondary antibody. Secondary antibody alone and no antibody controls were included for all experiments. (A) CDDOMe and CDDOMe-ARAPas inhibit iNOS mRNA expression after 4 hrs incubation. Data represents the mean of N = 3–4 independent biological replicates, ± 1 S.D. A factorial ANOVA was conducted to determine the effect of either CDDOMe or CDDOMe-ARAPas treatment and dose upon relative iNOS mRNA levels normalized to GAPDH copy number (* P < 0.05, *** P < 0.001, **** P < 0.0001). (B) CDDOMe and CDDOme-ARAPas inhibit nitrite production after 24 hr incubation. Nitrite in the media was reduced with acidic iodide reducing agent, and the resulting NO produced was detected with a Sievers NO analyzer. Cells were counted via DAPI staining, and NO normalized to cell count. Picomol NO/Cell is expressed as a percentage of maximal picomol/NO produced due to IFNλ/LPS stimulation. Data represents the mean of 3–4 independent biological replicates, ± 1 S.D. A factorial ANOVA was conducted to determine the effect of either CDDOMe or CDDOMe-ARAPas treatment and dose upon % maximal picomol NO/cell (* P < 0.05, *** P < 0.001). (C) Representative images of immunofluorescence of iNOS-stained murine RAW macrophages after 24 hr incubation. Fixed and permeabilized cells were stained with an anti-iNOS antibody followed by a secondary antibody conjugated to Alexa Fluor 488 dye, and then counter-stained with DAPI for nuclear detection. Scale bar is 100 μm. (D) CDDOMe and CDDOMe-ARAPas inhibit iNOS protein expression in classically stimulated macrophages after 24 hr incubation. Fluorescence intensity in the 488 channel was thresholded and then positive cells that expressed fluorescence above this threshold were taken as a percentage of total cell count. Data represents the mean of N=1–3 biological replicates, with 3 biologcal replicates for all IFNλ/LPS treated conditions, conducted in sextuplicate, ± 1 S.D. A 2-way ANOVA was conducted to determine the effect of either CDDOMe or CDDOMe-ARAPas treatment and dose upon % Positive Cells (* P < 0.05, ** P < 0.01).
Figure 6.
Figure 6.. Inhibition of iNOS transcription, iNOS protein activity and expression in classically stimulated murine bone marrow derived macrophages (BMDMs).
BMDMs were classically stimulated with IFNλ (10ng/mL, 7 hr) followed by treatment with LPS (100 ng/mL, 4–24 hrs) in the presence or absence of treatments and their respective vehicles. The media was then collected and cells were either washed and scraped into sterile HBSS and pelleted for RNA extraction, or fixed (2% PFA), permeabilized (0.3% Triton X-100 in 10mM PBS). (A) CDDOMe and CDDOMe-ARAPas inhibit iNOS mRNA expression after 4 hrs incubation. Data represents the mean of N = 4 independent biological replicates, ± 1 S.D. A factorial ANOVA was conducted to determine the effect of either CDDOMe or CDDOMe-ARAPas treatment and dose upon relative iNOS mRNA expression normalized to GAPDH copy number (** P < 0.01, *** P < 0.001). (B) CDDOMe and CDDOMe-ARAPas inhibit nitrite production after 24 hr incubation. Nitrite in the media was reduced with acidic iodide reducing agent, and the resulting NO produced was detected with a Sievers NO analyzer. Cells were counted via DAPI staining, and NO normalized to cell count. Data represents the mean of 3 independent biological replicates, ± 1 S.D. A factorial ANOVA was conducted to determine the effect of either CDDOMe or CDDOMe-ARAPas treatment and dose upon % maximal picomol NO/cell (* P < 0.05, *** P < 0.001). (C) Representative images of immunofluorescence of iNOS-stained BMDMs after 24 hr stimulation. Fixed and permeabilized cells were stained with an anti-iNOS antibody followed by a secondary antibody conjugated to Alexa Fluor 488 dye, and then counter-stained with DAPI for nuclear detection. Scale bar is 100 μm. (D) CDDOMe and CDDOMe-ARAPas inhibit iNOS protein expression in classically stimulated BMDMs after 24 hr incubation. Fluorescence intensity in the 488 channel was thresholded and then positive cells that expressed fluorescence above this threshold were taken as a percentage of total cell count. Data represents the mean of N=3 biological replicates, conducted in 6-plicate, ± 1 S.D. A 2-way ANOVA was conducted to determine the effect of either CDDOMe or CDDOMe-ARAPas treatment and dose upon % Positive Cells (* P < 0.05, ** P < 0.01).
Figure 7.
Figure 7.. CDDOMe and CDDOMe-ARAPas treatment and IL1b mRNA trasncription in classically stimulated (A) RAW 264.7 macrophages and (B) murine bone marrow derived macrophages (BMDMs).
Cells were classically stimulated with IFNλ (10ng/mL, 7 hr) followed by treatment with LPS (100 ng/mL, 4 hrs) in the presence or absence of treatments and their respective vehicles. The media was then collected and cells were pelleted for RNA extraction. Data represents the mean of N = 2–4 independent biological replicates, ± 1 S.D. A factorial ANOVA was conducted to determine the effect of either CDDOMe or CDDOMe-ARAPas treatment and dose upon relative iNOS/GAPDH mRNA copy number (*** P < 0.001, **** P < 0.0001).
Figure 8.
Figure 8.. CDDOMe-ARAPas localize to atherosclerotic plaque in athero-prone mice.
LDLr−/− and ApoE−/− mice were fed a high fat diet for 15 weeks and then intravenously injected with 3 mg/kg of DiD-CDDOMe-ARAPas (5mL/kg) or an equivalent volume of 10mM PBS. 24 hours later their organs and plasma were collected. (A) Representative images of localization of DiD-CDDOMe-ARAPas in atherosclerotic plaque of both ApoE−/− and LDLr−/− mice. Tissue sections were imaged by fluorescence microscopy (left panels) and then the same tissue sections were stained with Oil Red O (right panels) to confirm the visualization of atherosclerotic plaque. Scale bar is 500 μm. (B) CDDOMe-ARAPas selectively localize to atherosclerotic plaque. Aortic root sections were analyzed with fluorescence microscopy to determine localization of DiD-CDDOmeARAPas in atherosclerotic plaque. DiD fluorescence intensity was thresholded and normalized to lesion area (determined by auto-fluorescence in the 488 channel). Data represents the mean of 3–5 independent biological replicates, ± 1 S.D. A factorial ANOVA was conducted to determine the effect of CDDOMe-ARAPas treatment and genotype upon RFU/lesion area (*** P < 0.001). (C) Biodistribution of CDDOMe-ARAPas in athero-prone mice. Organs were weighed and homogenized in 5% Triton-X-100 in 10mM PBS, and subsequently extracted with isopropanol. Fluorescence intensity was recorded and μg of DiD determined with a standard curve and normalized to tissue mass. Data represents the mean of 3–5 independent biological replicates, with fluorescence measurements conducted in triplicate, ± 1 S.D. Sham-injected genotype-matched animals were also measured and for each organ, the basal μg DiD/mg tissue was deducted. A factorial ANOVA was conducted to determine the effect of genotype and organs upon μg DiD/mg tissue (*** P < 0.001, **** P < 0.0001).
Figure 9.
Figure 9.. Activation of Nrf2-regulated genes in vitro and in vivo by CDDOMe-ARAPas.
GCLC mRNA level were recorded in either classically stimulated murine RAW 264.7 macrophages, BMDMs or in aortic arch homogenates of high fat diet fed LDLr−/− mice. RAW 264.7 macrophages and BMDMs were classically stimulated with IFNλ (10 ng/mL, 7 hr) followed by treatment with LPS (100 ng/mL, 4 hrs) in the presence or absence of treatments and their respective vehicles. Cells were then pelleted for RNA extraction. 4–6 wk old LDLr−/− mice were high fat diet fed for 8 weeks (till 12–14 wks old) and then either injected intravenously with 1mg/kg of CDDOMe-ARAPas or 10mM PBS, or intraperitoneally with 1mg/kg CDDOme dissolved in DMSO. Aortic arches were collected at either 24 hr or 72 hr post injection of CDDOMe-ARAPas, 10 mM PBS, or CDDOme. (A) Activation of GCLC mRNA expression in classically activated murine RAW macrophages following 4 hr incubation. Data represents the mean of 2–3 independent biological replicates, ± 1 S.D. A factorial ANOVA was conducted to determine the effect of classical stimulation, treatment and dose upon relative GCLC/GAPDH mRNA copy number (*** P < 0.001). (B) Activation of GCLC mRNA expression in classically activated murine BMDMs following 4 hr incubation. Data represents the mean of 4 independent biological replicates, ± 1 S.D. A factorial ANOVA was conducted to determine the effect of classical stimulation, treatment and dose upon relative GCLC/GAPDH mRNA copy number (* P < 0.05). (C) Activation of GCLC mRNA expression in LDLr−/− aortic arch homegenates. Data represents the mean of 8–10 independent biological replicates for each condition, ± 1 S.D. A factorial ANOVA was conducted to determine the effect of treatment with either PBS, CDDOMe or CDDOMe-ARAPas and time upon GCLC mRNA expression normalized to GAPDH copy number (**** P < 0.0001).

Similar articles

Cited by

References

    1. W. H. Organization, 2017.
    1. Benjamin EJ, Blaha MJ, Chiuve SE, Cushman M, Das SR, Deo R, de Ferranti SD, Floyd J, Fornage M, Gillespie C, Isasi CR, Jiménez MC, Jordan LC, Judd SE, Lackland D, Lichtman JH, Lisabeth L, Liu S, Longenecker CT, Mackey RH, Matsushita K, Mozaffarian D, Mussolino ME, Nasir K, Neumar RW, Palaniappan L, Pandey DK, Thiagarajan RR, Reeves MJ, Ritchey M, Rodriguez CJ, Roth GA, Rosamond WD, Sasson C, Towfighi A, Tsao CW, Turner MB, Virani SS, Voeks JH, Willey JZ, Wilkins JT, Wu JH, Alger HM, Wong SS and Muntner P, Circulation, 2017, 135, e146–e603. - PMC - PubMed
    1. Libby P, Buring JE, Badimon L, Hansson GK, Deanfield J, Bittencourt MS, Tokgözoğlu L and Lewis EF, Nat Rev Dis Primers, 2019, 5, 56. - PubMed
    1. Bäck M, Yurdagul A, Tabas I, Öörni K and Kovanen PT, Nature Reviews Cardiology, 2019, 16, 389–406. - PMC - PubMed
    1. Hansson GK and Hermansson A, Nat Immunol, 2011, 12, 204–212. - PubMed