. 2022 Mar;192(2):275-295.
doi: 10.1007/s00360-021-01426-1. Epub 2022 Jan 25.

Comparative transcriptomics reveal tissue level specialization towards diet in prickleback fishes

Affiliations

Comparative transcriptomics reveal tissue level specialization towards diet in prickleback fishes

Michelle J Herrera et al. J Comp Physiol B. 2022 Mar.

Abstract

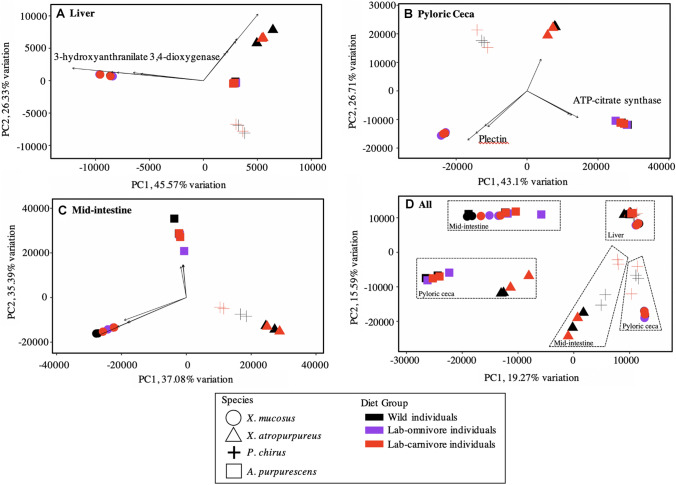
Beyond a few obvious examples (e.g., gut length, amylase activity), digestive and metabolic specializations towards diet remain elusive in fishes. Thus, we compared gut length, δ13C and δ15N signatures of the liver, and expressed genes in the intestine and liver of wild-caught individuals of four closely-related, sympatric prickleback species (family Stichaeidae) with different diets: Xiphister mucosus (herbivore), its sister taxon X. atropurpureus (omnivore), Phytichthys chirus (omnivore) and the carnivorous Anoplarchus purpurescens. We also measured the same parameters after feeding them carnivore or omnivore diets in the laboratory for 4 weeks. Growth and isotopic signatures showed assimilation of the laboratory diets, and gut length was significantly longer in X. mucosus in comparison to the other fishes, whether in the wild, or in the lab consuming the different diets. Dozens of genes relating to digestion and metabolism were observed to be under selection in the various species, but P. chirus stood out with some genes in the liver showing strong positive selection, and these genes correlating with differing isotopic incorporation of the laboratory carnivore diet in this species. Although the intestine showed variation in the expression of hundreds of genes in response to the laboratory diets, the liver exhibited species-specific gene expression patterns that changed very little (generally <40 genes changing expression, with P. chirus providing an exception). Overall, our results suggest that the intestine is plastic in function, but the liver may be where specialization manifests since this tissue shows species-specific gene expression patterns that match with natural diet.

Keywords: Digestion; Gut; Intestine; Physiology; Prickleback fish; Transcriptomics.


Conflict of interest statement

The authors declare that they have no conflict of interest.

Figures

Fig. 1
Fig. 1
Phylogenetic relationships of the polyphyletic family Stichaeidae based on 2100 bp of cytb, 16 s, and tomo4c4 genes (Kim et al. 2014). Bayesian posterior probabilities are indicated on nodes. Studied taxa are bolded, and photos are shown with their digestive systems beneath their bodies. Note the differences in gut size. H herbivory, O omnivory, C carnivory. Evolution of herbivory (— — — —) and omnivory (…………) are shown. Numbers in parentheses show number of taxa evaluated at that branch. Boxes highlight some of the alleged families or subfamilies within the polyphyletic family Stichaeidae, with Xiphisterinae (top), and Alectriinae (bottom) highlighted
Fig. 2
Fig. 2
Relative gut length (gut length. standard length−1) of wild-caught fishes, and those fed omnivore or carnivore diets in the laboratory. Top to Bottom: X. mucosusH, X. atropurpureusO, P. chirusO, and A. purpurescensC. Intraspecific comparisons of individuals on the different diets (along the x-axis) were made with ANCOVA (using body mass as a covariate; Supplemental Table S5), and symbols sharing a line of the same elevation are not significantly different (P > 0.05) from each other. No intraspecific differences were found for X. atropurpureusO or P. chirusO, and hence, no lines are drawn. For a given dietary category (wild, omnivore, carnivore), interspecific comparisons were made (vertically) with ANCOVA (with body mass as a covariate), and symbols sharing a letter are not significantly (P > 0.05) different from each other
Fig. 3
Fig. 3
Carbon and nitrogen (‰) dual isotope plots of wild-caught fishes, and fishes fed omnivore and carnivore diets in the laboratory. Top to bottom: X. mucosusH, X. atropurpureusO, P. chirusO, and A. purpurescensC. Shapes indicate the following: open square: lab omnivore diet; filled square: lab omnivore fish; open triangle: lab carnivore diet; filled triangle: lab carnivore fish; filled circle: wild fishes. Values are mean ± standard deviation. Intraspecific comparisons of the fish on the different diets were made with ANOVA for each species. Significant differences (P < 0.05) for δ15N indicated with capital letters, whereas lower case letters indicate significant differences in δ13C values
Fig. 4
Fig. 4
An adaptive branch-site random effects likelihood (aBSREL) test for episodic diversification phylogenetic tree constructed for various genes in the liver from four prickleback fish species: A Glucose-6-Phosphate 1-Dehydrogenase (G6PD), B fatty acid binding protein, C Mitochondrial import inner membrane translocase subunit (TIM21), and D endothelial lipase. ω is the ratio of nonsynonymous to synonymous substitutions. The color gradient represents the magnitude of the corresponding ω. Branches thicker than the other branches have a p < 0.05 (corrected for multiple comparisons) to reject the null hypothesis of all ω on that branch (neutral or negative selection only). A thick branch is considered to have experienced diversifying positive selection
Fig. 5
Fig. 5
Differential gene expression depicted as heatmaps in different tissues of X. mucosusH: A Liver, B mid intestine, and C pyloric ceca. Yellow indicates elevated relative expression, whereas blue indicates low expression. Each row is a single gene, and genes are clustered in a dendrogram (on left of each heatmap) by similarity of expression patterns. The various clusters of genes are described in Table 4. Each column represents the gene expression in a single tissue from an individual fish, with WF wild-caught fish, LO fish fed an omnivore diet in the laboratory, and LC fish fed a carnivore diet in the laboratory
Fig. 6
Fig. 6
PCA plot of gene expression data from the four species and A liver, B pyloric ceca, C mid-intestine, and D all tissues combined with all species and diet groups. Shapes represent species. Spheres depict X. mucosusH, triangles depict X. atropurpureusO, plus sign ( +) depict P. chirusO, and squares depict A. purpurescensC. Colors represent diet, with wild individuals in black, lab-omnivore individuals in purple, and lab-carnivore individuals in red. Vectors in panels AC indicate the ‘weight’ in different directions for the genes driving differences along each PC (fall within the top 5% of loadings range). The full gene list can be found in Supplementary Table S10 and the genes of interest that are related to digestion and metabolism are labeled on the graph

References

    1. Abrams ZB, Johnson TS, Huang K, Payne PRO, Coombes K. A protocol to evaluate RNA sequencing normalization methods. BMC Bioinformat. 2019;20(24):679. doi: 10.1186/s12859-019-3247-x. - DOI - PMC - PubMed
    1. Al-Hussaini A. The feeding habits and the morphology of the alimentary tract of some teleosts living in the neighbourhood of the marine biological station, Ghardaqa, Red Sea. Publ Mar Biol Sta Ghar (red Sea) 1947;5:1–61.
    1. Barton M. Intertidal vertical distribution and diets of five species of central California stichaeid fishes. Calif Fish Game. 1982;68:174–182.
    1. Bernal MA, Dixon GB, Matz MV, Rocha LA. Comparative transcriptomics of sympatric species of coral reef fishes (genus: Haemulon) PeerJ. 2019;7:e6541. doi: 10.7717/peerj.6541. - DOI - PMC - PubMed
    1. Betancor MB, Olsen RE, Marandel L, Skulstad OF, Madaro A, Tocher DR, Panserat S. Impact of dietary carbohydrate/protein ratio on hepatic metabolism in land-locked Atlantic Salmon (Salmo salar L.) Frontiers Physiol. 2018 doi: 10.3389/fphys.2018.01751. - DOI - PMC - PubMed

Publication types

LinkOut - more resources