. 2022 Mar 1;121(5):793-807.
doi: 10.1016/j.bpj.2022.01.018. Epub 2022 Jan 22.

IQGAP1 scaffolding links phosphoinositide kinases to cytoskeletal reorganization

Affiliations

IQGAP1 scaffolding links phosphoinositide kinases to cytoskeletal reorganization

V Siddartha Yerramilli et al. Biophys J. .

Abstract

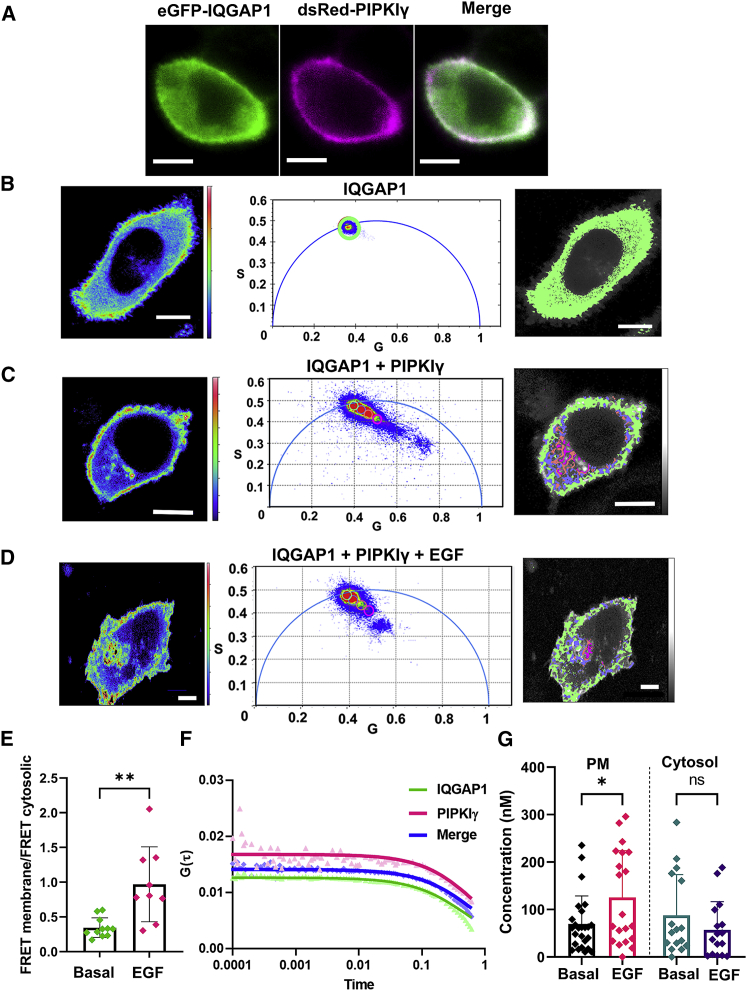
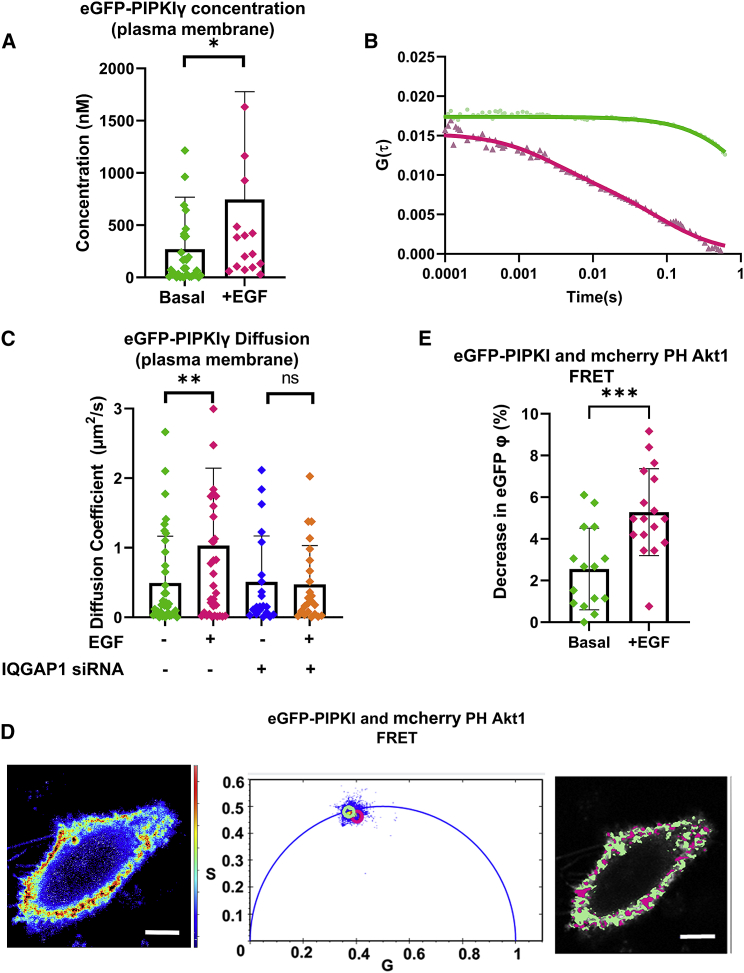
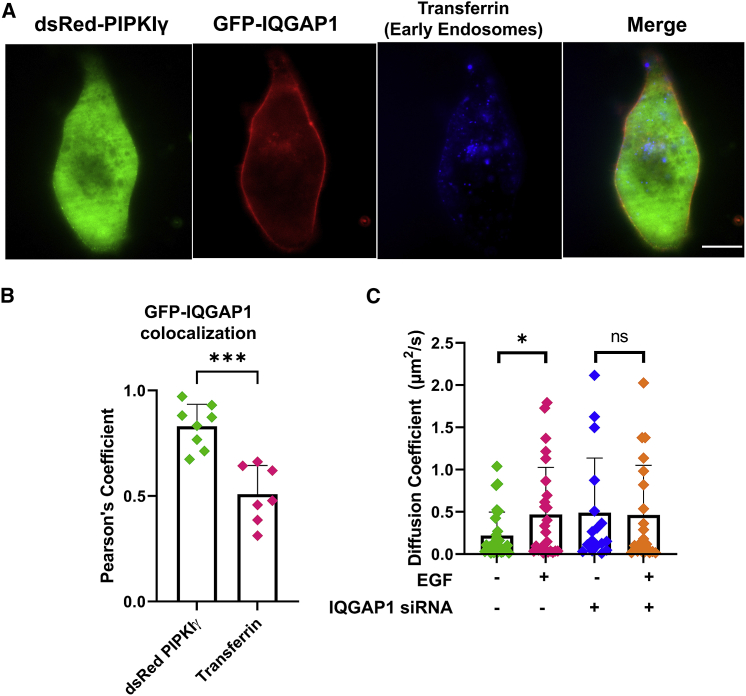
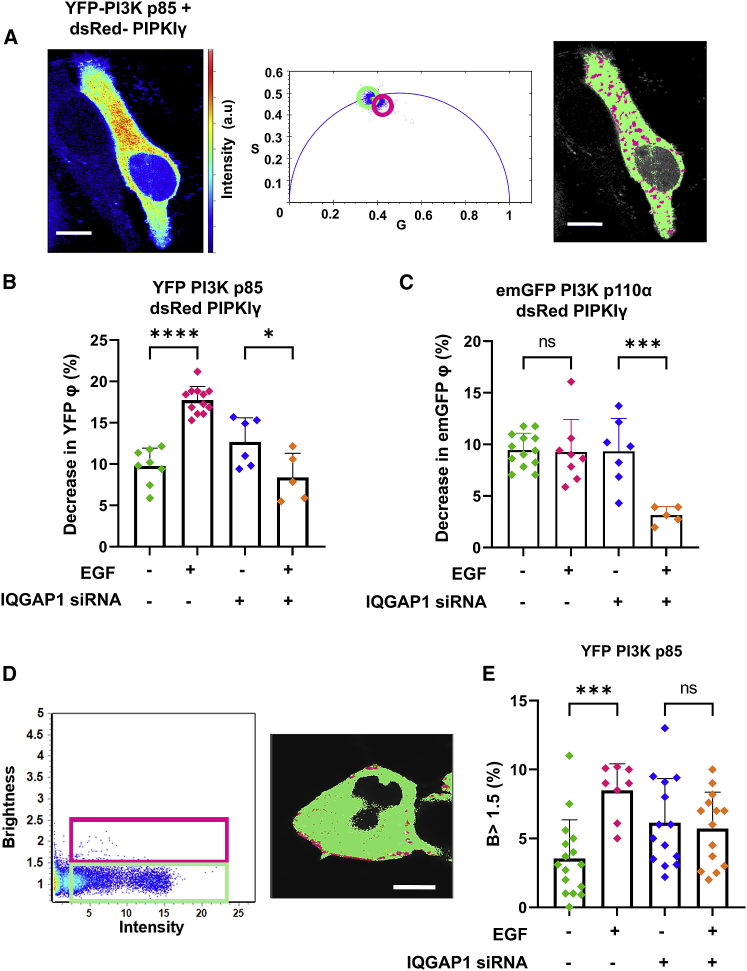
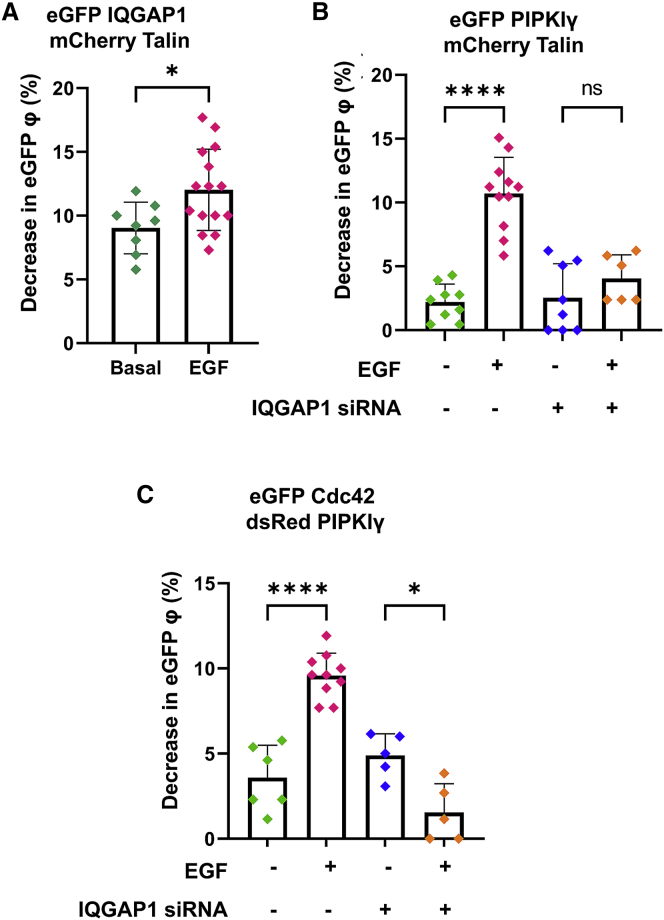
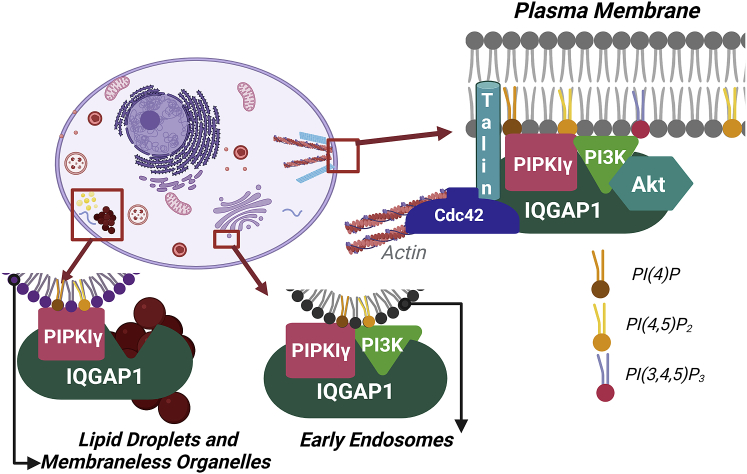
IQGAP1 is a multidomain scaffold protein that coordinates the direction and impact of multiple signaling pathways by scaffolding its various binding partners. However, the spatial and temporal resolution of IQGAP1 scaffolding remains unclear. Here, we use fluorescence imaging and correlation methods that allow for real-time live-cell changes in IQGAP1 localization and complex formation during signaling. We find that IQGAP1 and PIPKIγ interact on both the plasma membrane and in cytosol. Epidermal growth factor (EGF) stimulation, which can initiate cytoskeletal changes, drives the movement of the cytosolic pool toward the plasma membrane to promote cytoskeletal changes. We also observe that a significant population of cytosolic IQGAP1-PIPKIγ complexes localize to early endosomes, and in some instances form aggregated clusters which become highly mobile upon EGF stimulation. Our imaging studies show that PIPKIγ and PI3K bind simultaneously to IQGAP1, which may accelerate conversion of PI4P to PI(3,4,5)P3 that is required for cytoskeletal changes. Additionally, we find that IQGAP1 is responsible for PIPKIγ association with two proteins associated with cytoskeletal changes, talin and Cdc42, during EGF stimulation. These results directly show that IQGAP1 provides a physical link between phosphoinositides (through PIPKIγ), focal adhesion formation (through talin), and cytoskeletal reorganization (through Cdc42) upon EGF stimulation. Taken together, our results support the importance of IQGAP1 in regulating cell migration by linking phosphoinositide lipid signaling with cytoskeletal reorganization.


Figures

Figure 1
Figure 1
IQGAP1 strongly associates with PIPKIγ. (A) A representative image showing colocalization between eGFP-IQGAP1 and dsRed-PIPKIγ in HeLa cells. (B) A false-color image of a representative cell (left) shows that eGFP-IQGAP1 expressed in HeLa cells has a broad distribution across the cell except the nucleus. Plotting the raw lifetime values of each pixel in the image as a phasor plot (described in materials and methods, center) shows that eGFP-IQGAP1 has a single fluorescent lifetime indicated by a homogenous population on the phasor arc. The pixels included in the green circle of the phasor plot (lifetime center = 2.56 ns) are false-colored green and overlaid on a grayscale image of the cell (right), leading to the conclusion that the fluorescence lifetime is similar throughout the cell. The green pixels completely cover the gray of the cell. (C) When coexpressed with dsRed-PIPKIγ, the representative cell image (left) shows that IQGAP1 is primarily localized to the membrane. The phasor plots (center) show distinct eGFP-IQGAP1 lifetime populations both on the arc and inside the arc due to reduced lifetimes caused by FRET. The distinct regions on the phasor plots are highlighted by a green circle indicating higher (non-FRET) lifetimes (lifetime center = 2.55 ns, top) or by blue, orange, and magenta circles indicating shortened lifetimes (blue lifetime center = 2.1 ns, orange lifetime center = 1.9 ns, magenta lifetime center = 1.7 ns). The pixels underlying these circles are false colored and overlaid on grayscale cell images (right). (D) After stimulation with 100 ng/mL EGF, we still see a comet-like projection in cells expressing both eGFP-IQGAP1 and dsRed-PIPKIγ in the phasor plots (center), showing distinct eGFP-IQGAP1 lifetime populations both on the arc and inside the arc due to reduced lifetimes caused by FRET. The distinct regions on the phasor plots from the representative image (left) are highlighted as described above (right). n ≥ 10 in at least two individual experiments. (E) The ratios of FRET pixels in the membrane versus FRET pixels in the cytosol were quantified per image from the experiments described above in basal and EGF treatment groups. (F) Representative correlation curves from HeLa cells expressing eGFP-IQGAP1 and dsRed-PIPKIγ simultaneously. (G) Concentrations of the IQGAP1-PIPKIγ complexes were derived from the cross-correlated curves of plasma-membrane-localized focal areas on HeLa cells expressing eGFP-IQGAP1 and dsRed-PIPKIγ both at a basal state and after being stimulated with EGF (100 ng/mL for 1 h). φ denotes fluorescence lifetime in figure legends. n ≥ 10 in at least two individual experiments; siRNA treatment was used for the control groups. p ≤ 0.05, ∗∗p ≤ 0.01, ∗∗∗p ≤ 0.001, ∗∗∗∗p ≤ 0.0001; ns, not significant. Error bars denote standard deviation. Scale bars, 10 μm. To see this figure in color, go online.
Figure 2
Figure 2
PIPKI moves to plasma membrane in response to EGF. (A) Concentrations of eGFP-PIPKIγ particles derived from FCS correlation curves in plasma-membrane-localized focal areas on cells both at a basal state and after EGF stimulation (100 ng/mL). (B) Diffusion coefficients of eGFP-PIPKIγ particles derived from FCS correlation curves in plasma-membrane-localized focal areas on cells both at a basal state and after EGF stimulation (100 ng/mL) in the presence and absence of IQGAP1 expression. (C) FCS correlation curves from cells expressing eGFP-PIPKIγ that represent the range of diffusion coefficients (D) from our imaging data. The lighter-shade dots represent the raw data while the darker-colored curve represents the fitted curve. Here, the green curve represents a low diffusion curve with a D of 0.004 μm2/s while the red curve represents a D of 1.2 μm2/s. (D) Images of a representative HeLa cell coexpressing mCherry-PH-Akt1 and eGFP-PIPKIγ (left), where the pixels of distinct regions on phasor plots (center) are highlighted to show the distinct regions. The distinct regions on the phasor plots are represented by a green circle indicating higher (non-FRET) lifetimes (lifetime center = 2.55 ns) or by magenta or yellow circles indicating shortened lifetimes (magenta lifetime center = 2.00 ns). The pixels underlying these circles are false colored and overlaid on grayscale cell images (right). (E) Coexpression of mCherry-PH-Akt1 and eGFP-PIPKIγ in HeLa cells results in decreased eGFP IQGAP1 lifetimes due to FRET only when stimulated by EGF (100 ng/mL). φ denotes fluorescence lifetime in figure legends. Scrambled (nonspecific) siRNA treatment was used for the control groups. n ≥ 10 measured in at least two independent experiments; p ≤ 0.05, ∗∗p ≤ 0.01, ∗∗∗p ≤ 0.001, ∗∗∗∗p ≤ 0.0001; ns, not significant. Error bars denote standard deviation. Scale bars, 10 μm. To see this figure in color, go online.
Figure 3
Figure 3
PIPKI and IQGAP1 interact in the cytosol. (A) A representative image showing colocalization between eGFP-IQGAP1, dsRed-PIPKIγ, and transferrin that acts as a marker for early endosomes in HeLa cells. (B) Colocalization quantified using Pearson's coefficient based on immunofluorescence studies show that eGFP-IQGAP1 strongly colocalizes with dsRed-PIPKIγ significantly higher than its colocalization with transferrin (positive control = 0.92 ± 0.02, negative control = 0.004 ± 0.007). (C) Diffusion coefficients of eGFP-PIPKIγ particles derived from FCS correlation curves in cytosol-localized focal areas on cells both at a basal state and after EGF stimulation (100 ng/mL) in the presence and absence of IQGAP1 expression. Scrambled (nonspecific) siRNA treatment was used for the control groups. n ≥ 5 measured in at least two independent experiments; p ≤ 0.05, ∗∗p ≤ 0.01, ∗∗∗p ≤ 0.001, ∗∗∗∗p ≤ 0.0001; ns, not significant. Error bars denote standard deviation. Scale bar, 10 μm. To see this figure in color, go online.
Figure 4
Figure 4
IQGAP1 mediates an association between PIPKIγ and PI3K. (A) A representative cell image shows the eYFP fluorescence of HeLa cells expressing both dsRed-PIPKIγ and eYFP-PI3K p85 (left). eYFP lifetimes for some pixels are inside the arc due to reduced lifetime caused by FRET (center). The distinct regions on the phasor plots are highlighted by a green circle indicating higher (non-FRET) lifetimes (lifetime center = 2.55 ns) and a magenta circle indicating shortened lifetimes (lifetime center = 2.00 ns). The pixels underlying these circles are false colored and overlaid on grayscale cell images (right). (B) EGF treatment decreases the fluorescence lifetime of HeLa cells expressing eYFP-PI3K p85-dsRed-PIPKIγ, indicating that EGF enhances the interactions of PIPKIγ with p85. Furthermore, suppressing IQGAP1 levels with siRNA decreased the PIPKIγ-p85 interactions. (C) EGF treatment does not decrease the fluorescence lifetime of HeLa cells expressing eGFP PI3K p110α-dsRed-PIPKIγ, while suppressing IQGAP1 levels with siRNA decreased PIPKIγ-p110α interactions in response to EGF. (D) A brightness-versus-intensity plot, where individual pixels of HeLa cell images under stimulation by EGF (100 ng/mL for 1 h) expressing eYFP-PI3K p85 are highlighted either in a green box (B < 1.5) or a magenta box (B > 1.5) (left). The distribution of these highlighted pixels can be seen overlaid (right) on a representative cell. This EGF-stimulated cell shows localization of IQGAP1 clusters at the plasma membrane. (E) There is a statistically significant increase in the number of pixels having higher B values (magenta pixels, B > 1.5) that represent the oligomeric species or clusters of eYFP-PI3K p85 after the cells are stimulated with EGF compared with basal levels both in the presence and absence of IQGAP1. φ denotes fluorescence lifetime in figure legends. Scrambled (nonspecific) siRNA treatment was used for the control groups. n ≥ 5 measured in at least two independent experiments. In both cases, lifetimes of the control and IQGAP1 siRNA groups are significantly different from eYFP-p85 alone and from emGFP-p110α alone (p < 0.001). p ≤ 0.05, ∗∗p ≤ 0.01, ∗∗∗p ≤ 0.001, ∗∗∗∗p ≤ 0.0001; ns, not significant. Error bars denote standard deviation. Scale bars, 10 μm. To see this figure in color, go online.
Figure 5
Figure 5
IQGAP1 interacts with talin and mediates PIPKIγ interactions with talin and Cdc42. (A) There is a decrease in eGFP fluorescence lifetime of due to FRET between eGFP-IQGAP1 and mCherry-talin. The interaction between IQGAP1 and talin is further enhanced by EGF stimulation (100 ng/mL). (B) eGFP lifetime also decreases due to FRET in HeLa cells expressing both eGFP-PIPKIγ and mCherry-talin only when stimulated with EGF (100 ng/mL). These EGF-mediated interactions are abrogated by IQGAP1 downregulation, indicating that IQGAP1 is required for PIPKIγ and talin interactions. (C) A similar effect is seen in HeLa cells expressing both eGFP-Cdc42 and dsRed-PIPKIγ where FRET is seen only upon EGF (100 ng/mL) stimulation but not with IQGAP1. n ≥ 5 measured in at least two independent experiments. φ denotes fluorescence lifetime in figure legends. Scrambled (nonspecific) siRNA treatment was used for the control groups. p ≤ 0.05, ∗∗p ≤ 0.01, ∗∗∗p ≤ 0.001, ∗∗∗p ≤ 0.0001; ns, not significant. Error bars denote standard deviation. To see this figure in color, go online.
Figure 6
Figure 6
A proposed model of IQGAP1-PIPKIγ interactions in various cellular localizations, created with BioRender.com To see this figure in color, go online.

References

    1. Berridge M.J., Irvine R.F. Inositol trisphosphate, a novel second messenger in cellular signal transduction. Nature. 1984;312:315–321. - PubMed
    1. Prestwich G.D. Phosphoinositide signaling; from affinity probes to pharmaceutical targets. Chem. Biol. 2004;11:619–637. - PubMed
    1. Balla T., Szentpetery Z., Kim Y.J. Phosphoinositide signaling: new tools and insights. Physiology (Bethesda) 2009;24:231–244. - PMC - PubMed
    1. Bunney T.D., Katan M. Phosphoinositide signalling in cancer: beyond PI3K and PTEN. Nat. Rev. Cancer. 2010;10:342–352. - PubMed
    1. Park S.J., Itoh T., Takenawa T. Phosphatidylinositol 4-phosphate 5-kinase type I is regulated through phosphorylation response by extracellular stimuli. J. Biol. Chem. 2001;276:4781–4787. - PubMed

Publication types

MeSH terms

Substances