. 2022 Feb 3;29(2):315-327.e6.
doi: 10.1016/j.stem.2021.12.011. Epub 2022 Jan 24.

Multi-omic analysis reveals divergent molecular events in scarring and regenerative wound healing

Affiliations

Multi-omic analysis reveals divergent molecular events in scarring and regenerative wound healing

Shamik Mascharak et al. Cell Stem Cell. .

Abstract

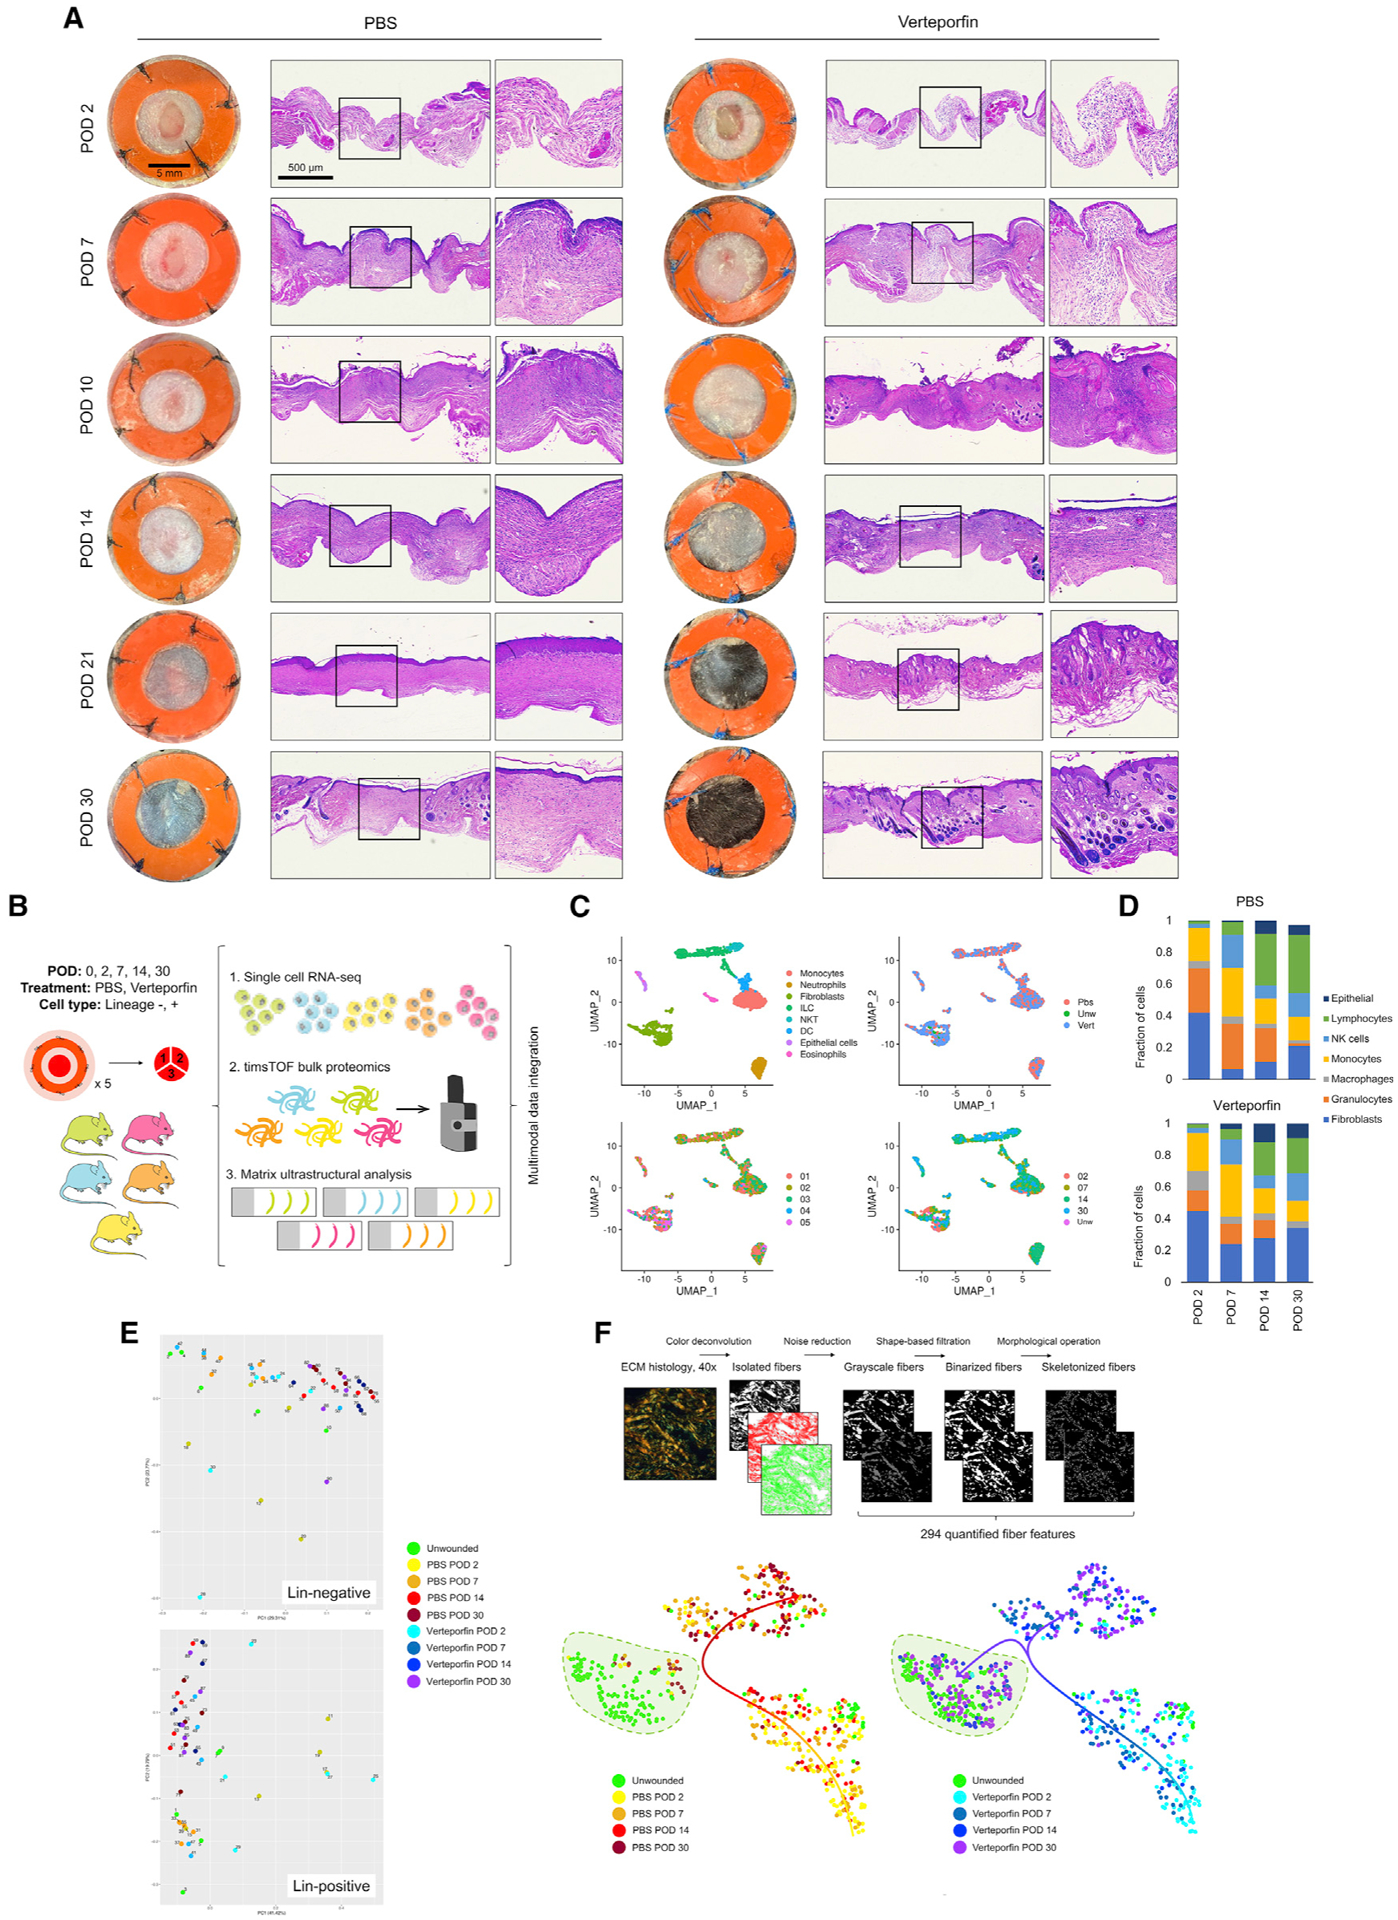
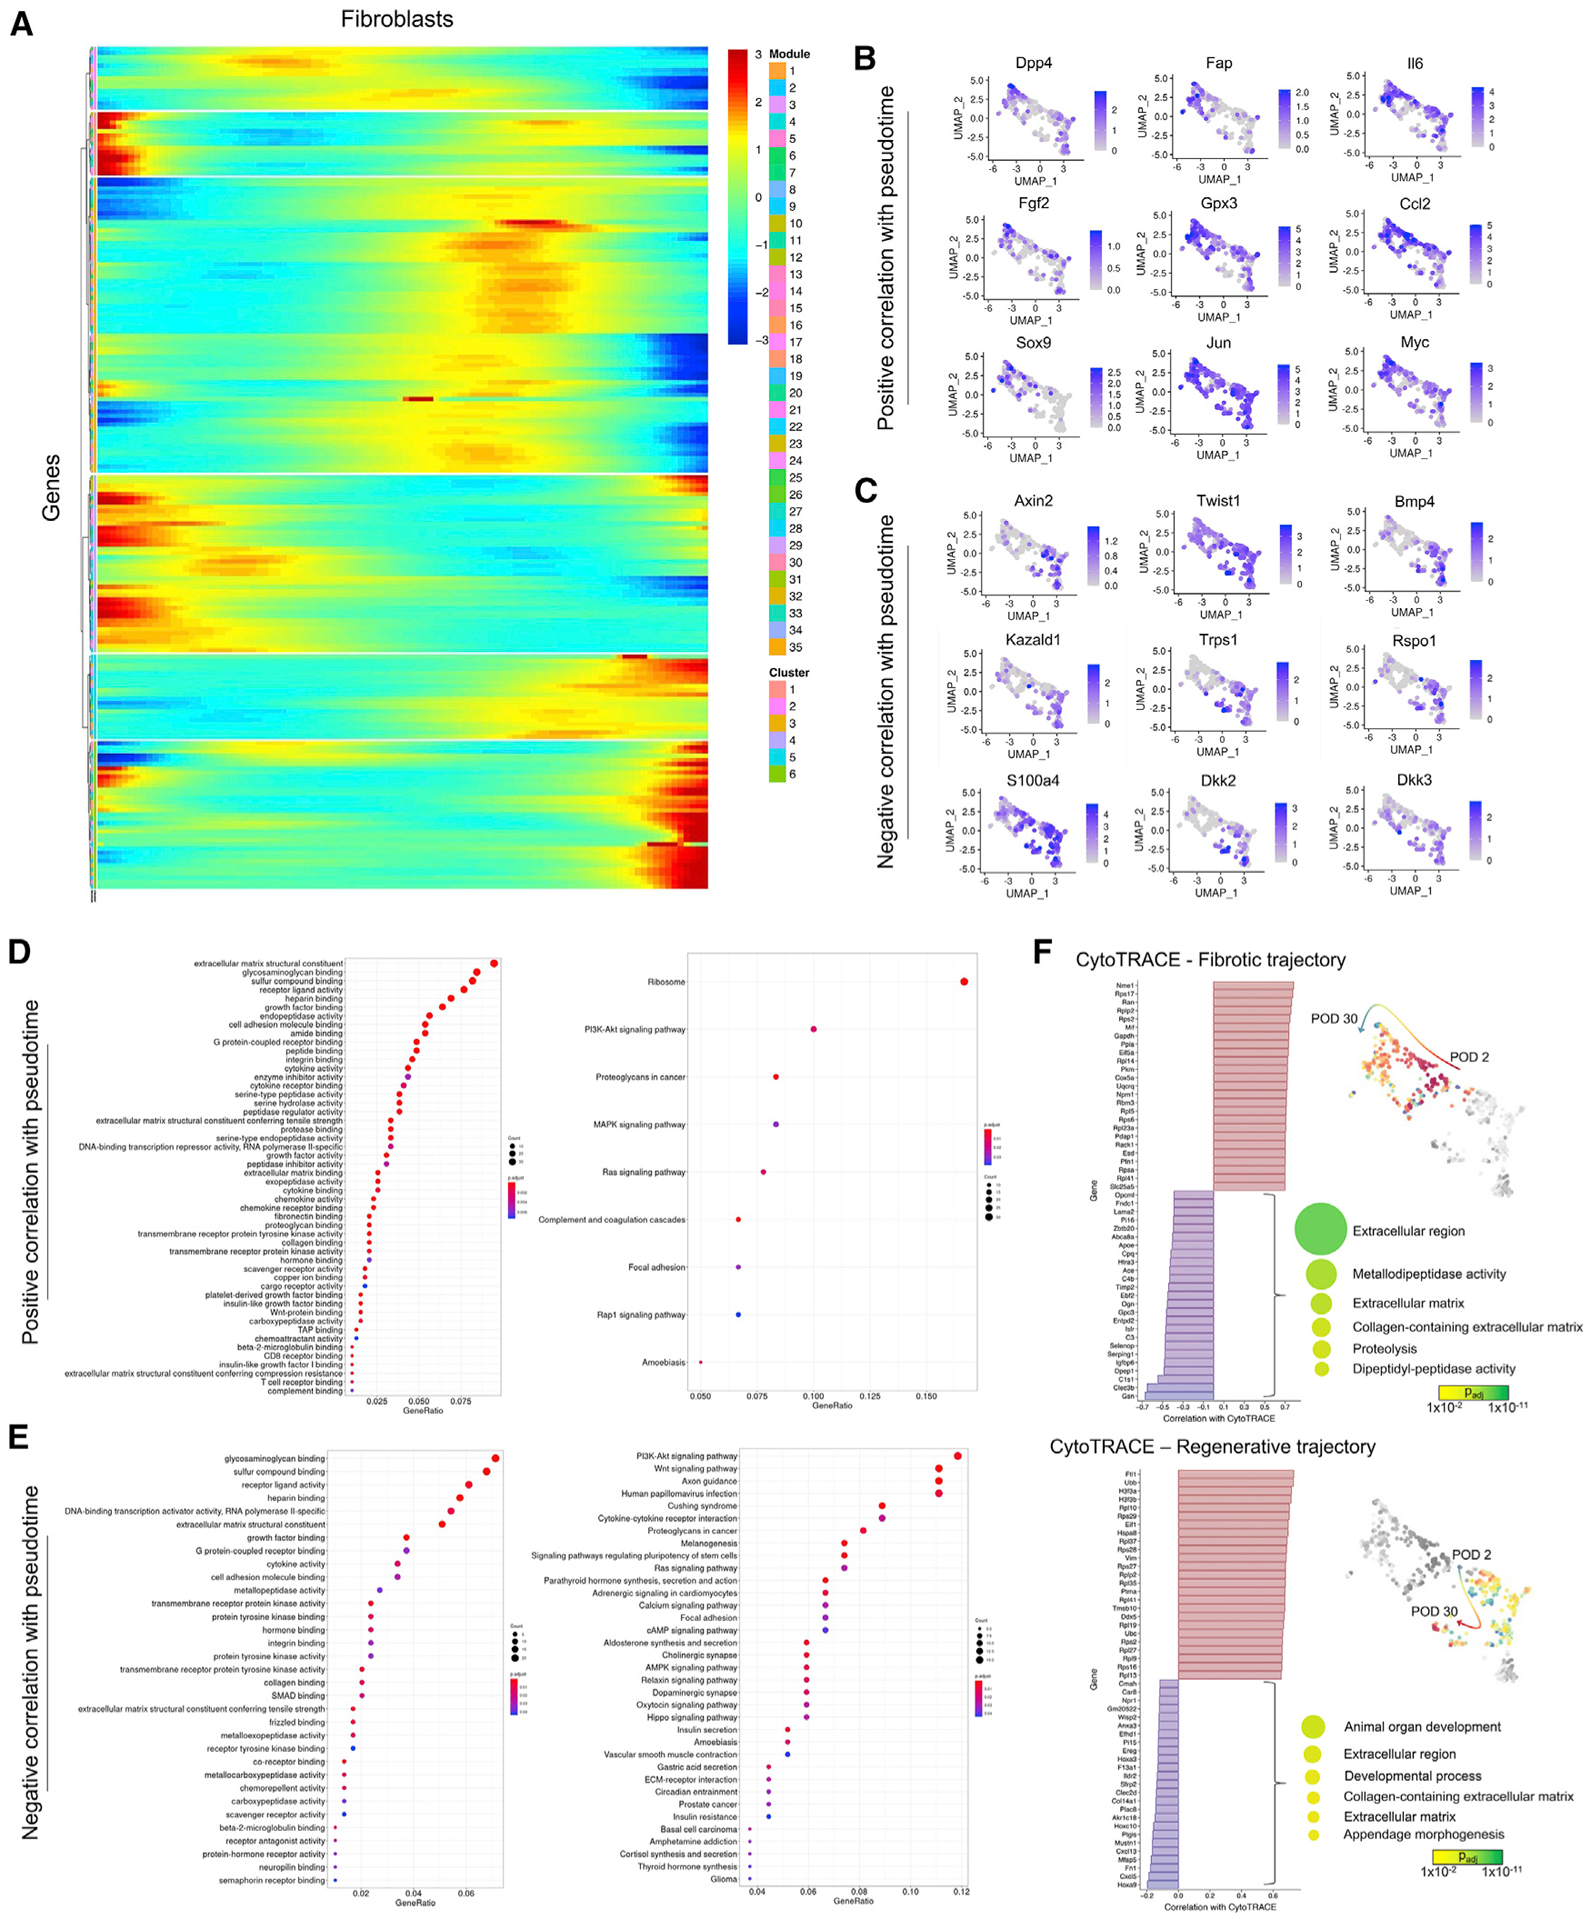
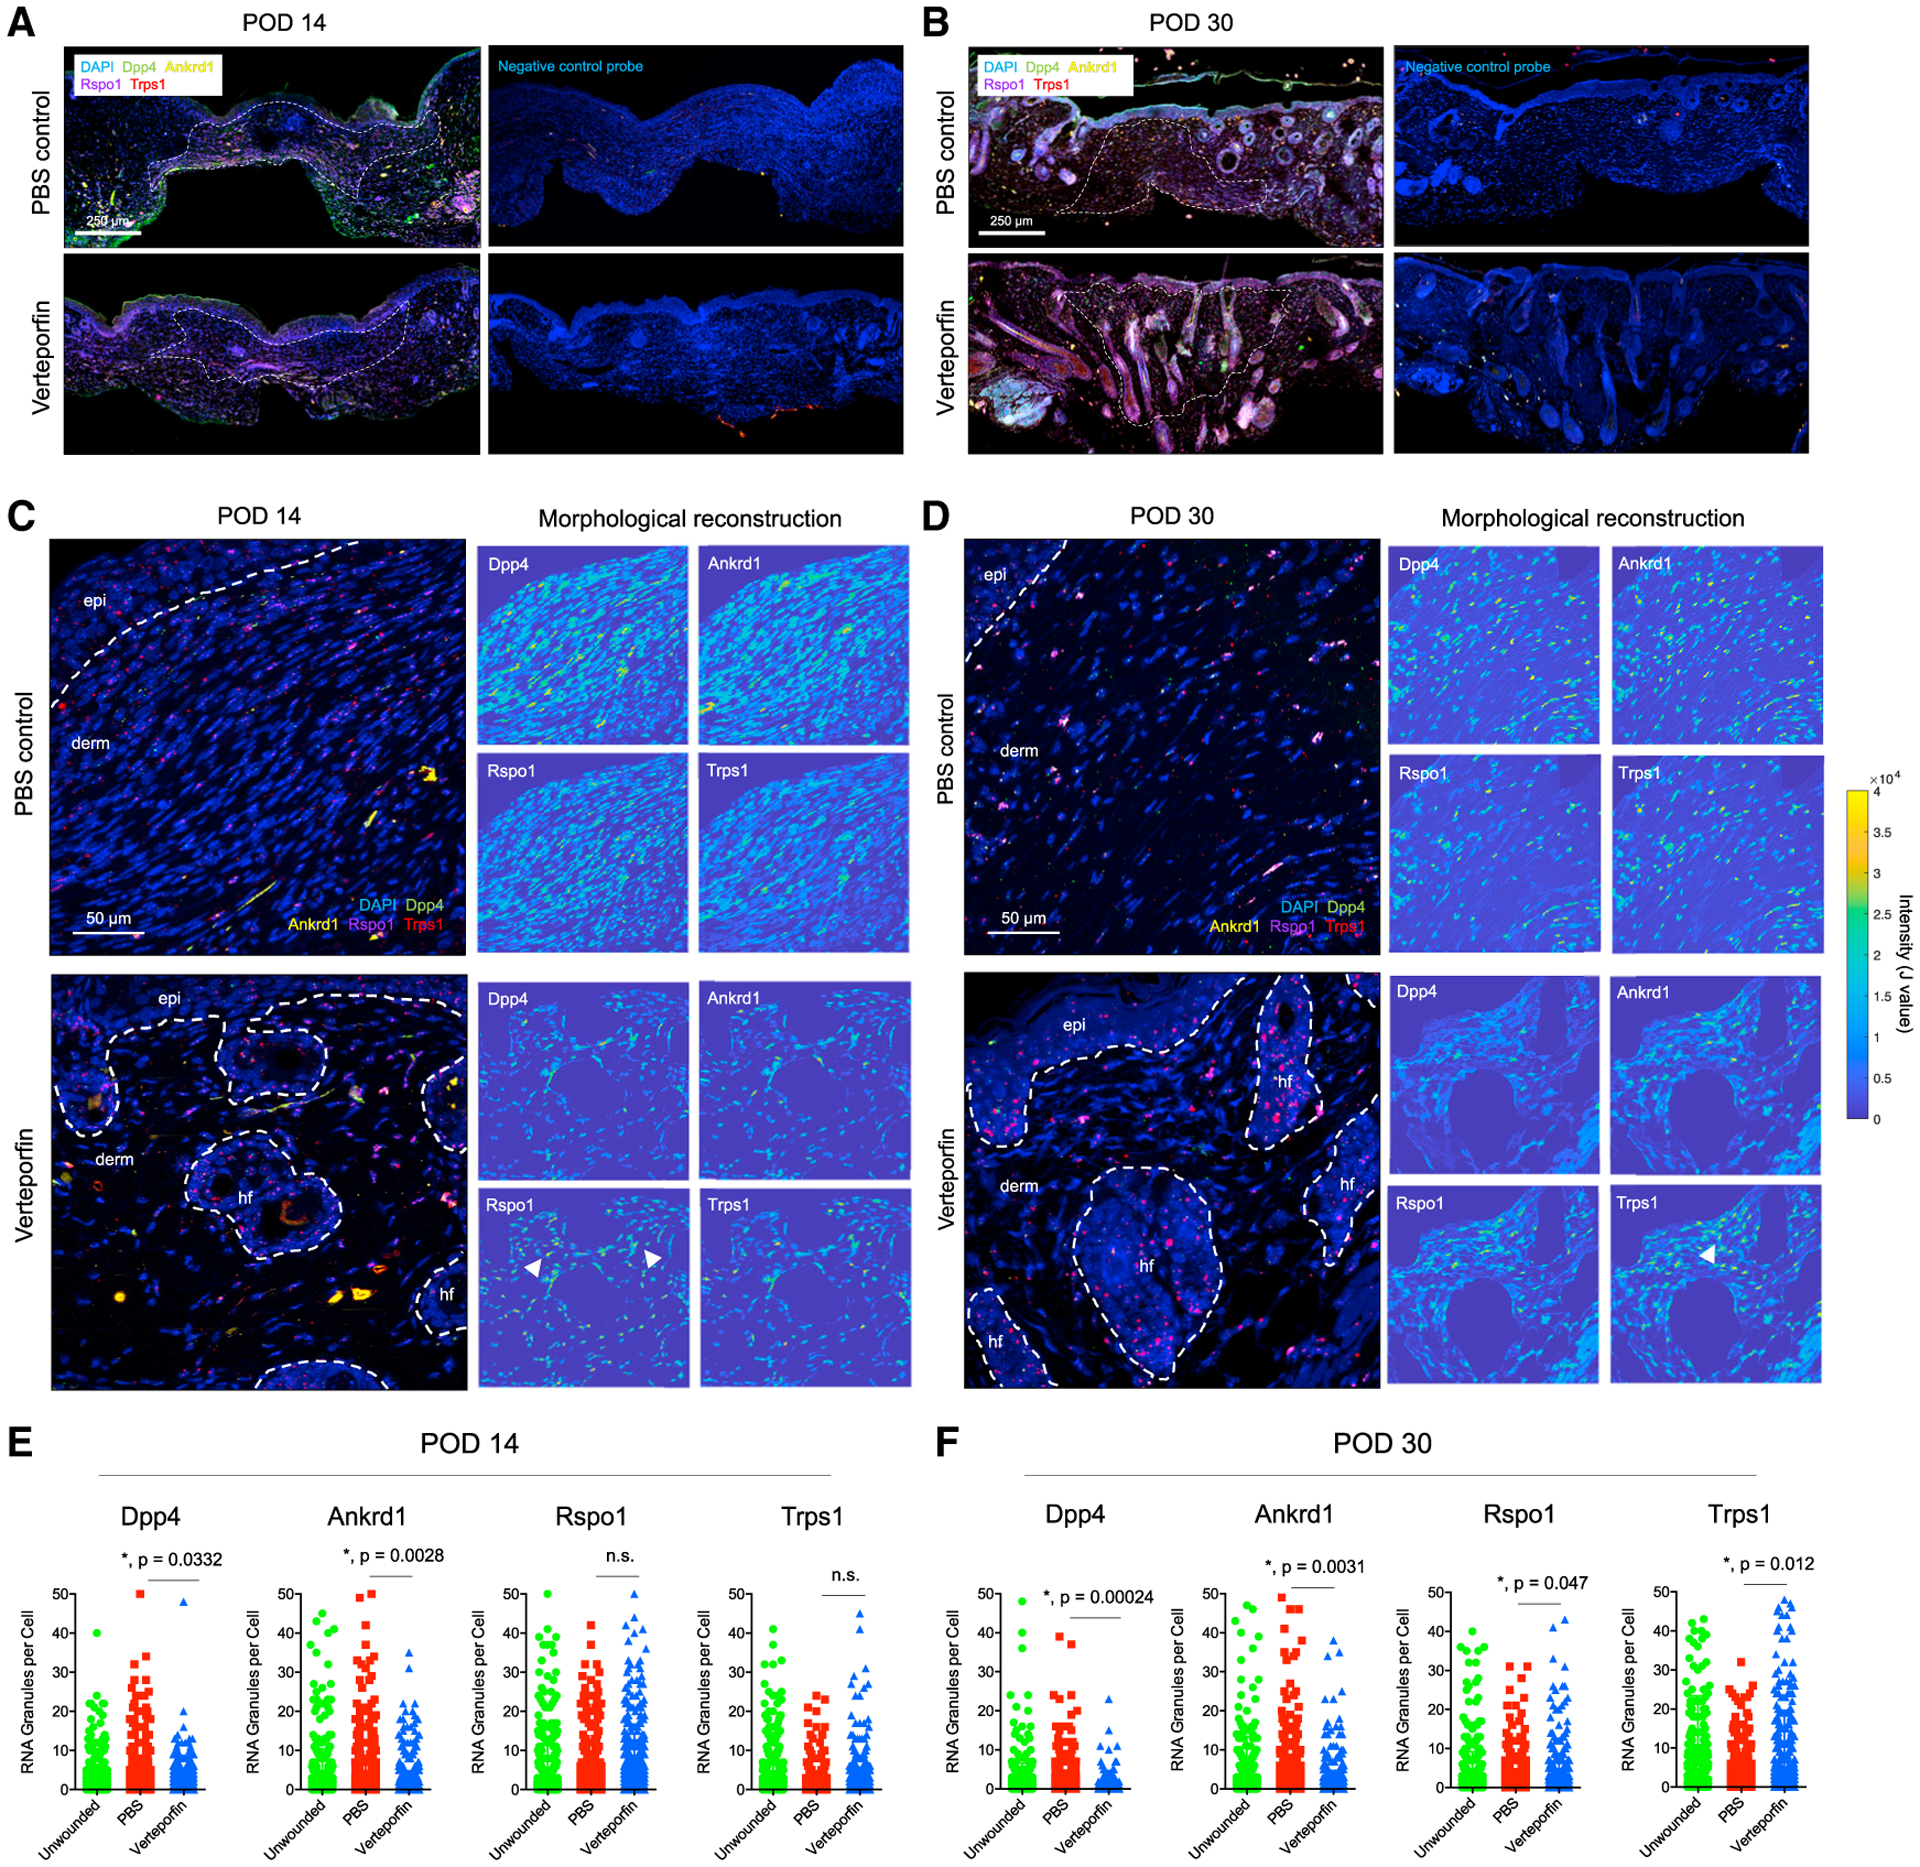
Regeneration is the holy grail of tissue repair, but skin injury typically yields fibrotic, non-functional scars. Developing pro-regenerative therapies requires rigorous understanding of the molecular progression from injury to fibrosis or regeneration. Here, we report the divergent molecular events driving skin wound cells toward scarring or regenerative fates. We profile scarring versus YAP-inhibition-induced wound regeneration at the transcriptional (single-cell RNA sequencing), protein (timsTOF proteomics), and tissue (extracellular matrix ultrastructural analysis) levels. Using cell-surface barcoding, we integrate these data to reveal fibrotic and regenerative "molecular trajectories" of healing. We show that disrupting YAP mechanotransduction yields regenerative repair by fibroblasts with activated Trps1 and Wnt signaling. Finally, via in vivo gene knockdown and overexpression in wounds, we identify Trps1 as a key regulatory gene that is necessary and partially sufficient for wound regeneration. Our findings serve as a multi-omic map of wound regeneration and could have therapeutic implications for pathologic fibroses.

Keywords: fibroblast heterogeneity; fibrosis; mechanotransduction signaling; regeneration; wound healing.


Conflict of interest statement

Declaration of interests M.T.L., S.M., H.E.T., and M.F.D. are inventors on patent 62/879,369 held by Stanford University that covers the use of YAP inhibition for wound healing. S.M., H.E.T., and M.T.L. are inventors on patent application PCT/US2020/043717 that covers a machine-learning algorithm for analysis of connective tissue networks in scarring and chronic fibroses. The authors declare no other competing interests.

Figures

Figure 1.
Figure 1.. Multimodal interrogation of scarring and regenerative wound repair
(A) Gross photos (left columns) and low-power hematoxylin and eosin (H&E) histology (right columns) of PBS and verteporfin-treated wounds at indicated PODs. (B) Experimental strategy for mouse-paired multimodal analysis of wound healing over time. (C) Manifold projection of scRNA-seq cells colored by cell type (top left), treatment group (top right), individual mouse (bottom left), and POD (bottom right). (D) Proportion of cell types in PBS and verteporfin-treated wounds by time point. (E) Principal components mapping of proteomic data for Lin− (fibroblast, top) and Lin+ (non-fibroblast, bottom) cells. (F) Top, schematic outline of image processing and analysis pipeline to quantify 294 ECM parameters. Bottom, t-SNE plots of control (left) and verteporfin (right) wounds over time. Green shaded region, UW skin cluster; overlaid arrows, ECM evolution over time.
Figure 2.
Figure 2.. Transcriptomic trajectory analysis of fibroblasts in pseudotime
(A) Schematic outlining manifold generation, optimization, and branchpoint analysis for fibroblasts in Monocle3. (B) Fibroblast manifold colored by POD (left), treatment group (middle-left), pseudotime value (middle-right), and Louvain-based (Seurat) cluster (right). (C–E) mRNA expression of selected genes (C) and functional enrichment analyses of genes (D) and proteins (E) positively correlated with pseudotime. (F–H) As in (C–E), but negatively correlated with pseudotime. (I and J) SCENIC analysis of regulons corresponding to each fibroblast cluster. (K) RNA velocity analysis of fibroblasts from all conditions. (L) Top, fibroblast manifold projection colored by CytoTRACE score; bottom, CytoTRACE scores for cells in each arm. (M) IF histology for YAP (red) and Trps1 (green; left) or Dpp4 (CD26; far right) in UW skin and PBS- or verteporfin-treated wounds at indicated time points. (N) Quantification of Trps1 nuclear localization by Biodock AI automated analysis.
Figure 3.
Figure 3.. Pseudotime and CytoTRACE analysis of fibroblasts in scarring and regeneration
(A) Fibroblast clustering by pseudotemporal expression pattern. (B and C) mRNA expression feature plots for selected genes positively (B) and negatively (C) correlated with pseudotime. (D and E) EnrichR gene ontology analysis on top 1% of genes positively (D) or negatively (E) correlated with pseudotime. (F) Waterfall plots showing genes positively (red) and negatively (blue) correlated with CytoTRACE score for cells in the fibrotic (top) and regenerative (bottom) trajectories. Right panels, functional enrichment results for genes correlated with decreasing CytoTRACE score (i.e., with fibroblast differentiation).
Figure 4.
Figure 4.. CellChat analysis of fibroblast cell interactions
(A) Strength of ligand-receptor interactions between cell population pairs. Edge width is proportional to the number of ligand-receptor pairs. (B) As in (A), subset by cell population. (C) Heatmaps showing relative importance of each cell group based on the computed network centrality measures of indicated signaling networks (ncWNT, non-canonical Wnt). (D and E) Inferred outgoing (D) and incoming (E) communication patterns for secreting cells, showing correspondence between inferred latent patterns and cell groups (left) and signaling pathways (right).
Figure 5.
Figure 5.. Spatial transcriptomic analysis of fibroblasts in scarring and regeneration
(A and B) Low-power tile scan of RNAscope multiplexed in situ hybridization for Dpp4 (green), Ankrd1 (yellow), Rspo1 (magenta), and Trps1 (red) in PBS- and verteporfin-treated wounds at POD 14 (A) and 30 (B). White dotted line, scar boundary. Right panels, neighboring slides hybridized with negative control scrambled probes. (C and D) High-power images of RNAscope granules in PBS- and verteporfin-treated wounds at POD 14 (C) and 30 (D). White dotted line, quantified regions of interest in dermis. Right panels, morphological reconstructions (dermis only; epidermis and HF excluded); yellow, cells strongly expressing indicated gene. (E and F) Quantification of Dpp4, Ankrd1, Rspo1, and Trps1 RNA puncta per cell in POD 14 (E) and 30 (F) specimens.
Figure 6.
Figure 6.. Fibroblast-targeted lentiviral Trps1 overexpression and knockdown
(A) Gross photos, PBS-treated wounds at POD 30 (Col1a1-CreERT;Ai9 mice) injected with control lentivirus (Trps1-OEC, left), Trps1 OE lentivirus at POD −3/7 (Trps1-OEE, middle), or POD 7/17 (Trps1-OEL, right). Red dotted lines demarcate the region where the silicone splint was attached and later removed. (B) H&E (top row) and IF (bottom row; GFP+Ai9+ cells, successfully transduced fibroblasts) histology of Trps1-OEC, Trps1-OEE, and Trps1-OEL wounds. (C) IF staining for Trps1 in indicated wounds; white arrowheads, nuclear Trps1. (D) Quantification of HF (left), glands (middle), and ECM score (right). (E) Matrix ultrastructural analysis of UW skin and POD 30 Trps1-OEC, Trps1-OEE, and Trps1-OEL wounds. (F–J) As in (A–E), but for verteporfin-treated wounds with control lentivirus (Trps1-KDC), Trps1 KD lentivirus at POD 3/7 (Trps1-KDE), or POD 7/17 (Trps1-KDL). In (D) and (I), error bars bars indicate mean ± standard error (SEM).

Comment in

References

    1. Aarabi S, Bhatt KA, Shi Y, Paterno J, Chang EI, Loh SA, Holmes JW, Longaker MT, Yee H, and Gurtner GC (2007). Mechanical load initiates hypertrophic scar formation through decreased cellular apoptosis. FASEB J 21, 3250–3261. 10.1096/fj.07-8218com. - DOI - PubMed
    1. Abbasi S, Sinha S, Labit E, Rosin NL, Yoon G, Rahmani W, Jaffer A, Sharma N, Hagner A, Shah P, et al. (2020). Distinct regulatory programs control the latent regenerative potential of dermal fibroblasts during wound healing. Cell Stem Cell 27, 396. e6–412.e6.. 10.1016/j.stem.2020.07.008 - DOI - PubMed
    1. Aibar S, González-Blas CB, Moerman T, Huynh-Thu VA, Imrichova H, Hulselmans G, Rambow F, Marine JC, Geurts P, Aerts J, et al. (2017). SCENIC: single-cell regulatory network inference and clustering. Nat. Methods 14, 1083–1086. 10.1038/nmeth.4463. - DOI - PMC - PubMed
    1. Barnes LA, Marshall CD, Leavitt T, Hu MS, Moore AL, Gonzalez JG, Longaker MT, and Gurtner GC (2018). Mechanical forces in cutaneous wound healing: emerging therapies to minimize scar formation. Adv. Wound Care (New Rochelle) 7, 47–56. 10.1089/wound.2016.0709. - DOI - PMC - PubMed
    1. Bergen V, Lange M, Peidli S, Wolf FA, and Theis FJ (2020). Generalizing RNA velocity to transient cell states through dynamical modeling. Nat. Biotechnol 38, 1408–1414. 10.1038/s41587-020-0591-3. - DOI - PubMed

Publication types