. 2022 Apr 1:203:466-480.
doi: 10.1016/j.ijbiomac.2022.01.121. Epub 2022 Jan 22.

Insights into the specificity for the interaction of the promiscuous SARS-CoV-2 nucleocapsid protein N-terminal domain with deoxyribonucleic acids

Affiliations

Insights into the specificity for the interaction of the promiscuous SARS-CoV-2 nucleocapsid protein N-terminal domain with deoxyribonucleic acids

Icaro Putinhon Caruso et al. Int J Biol Macromol. .

Abstract

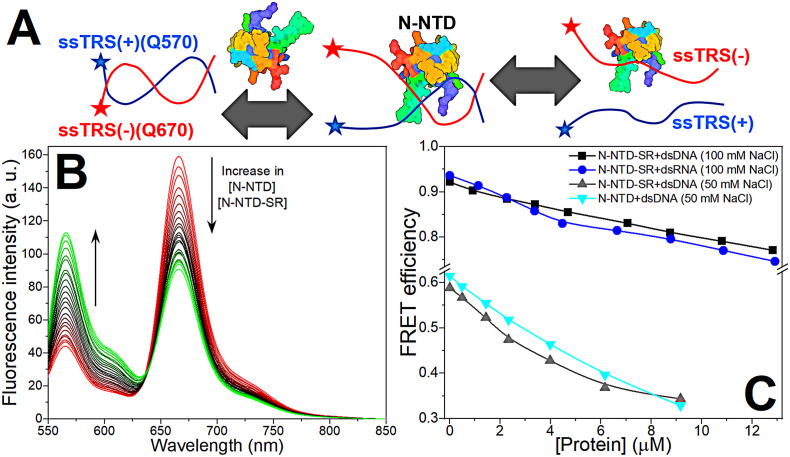
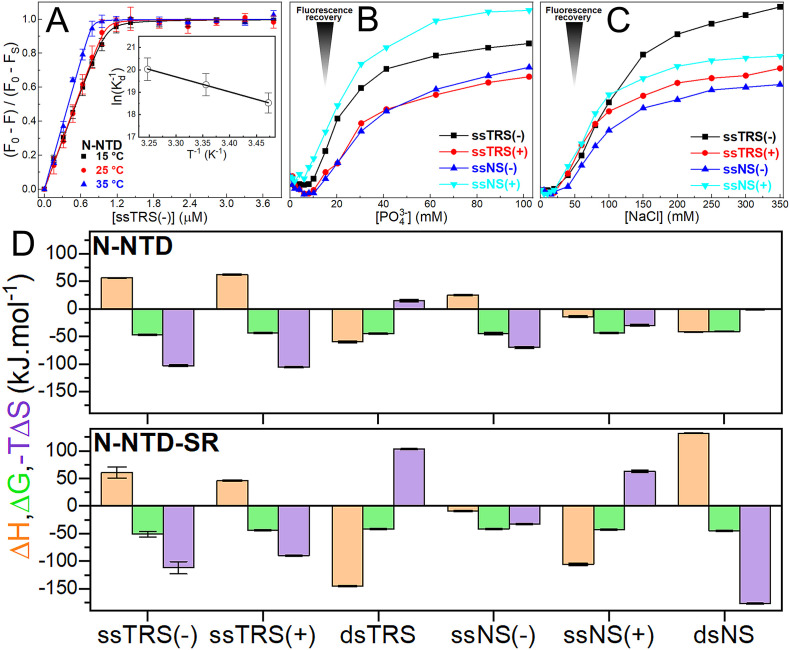
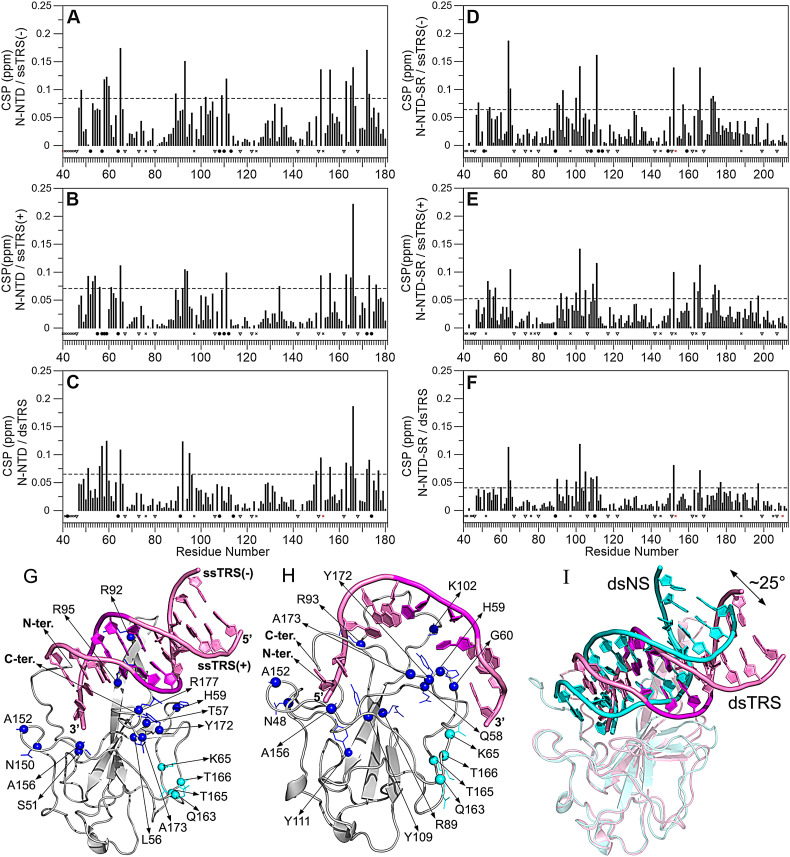
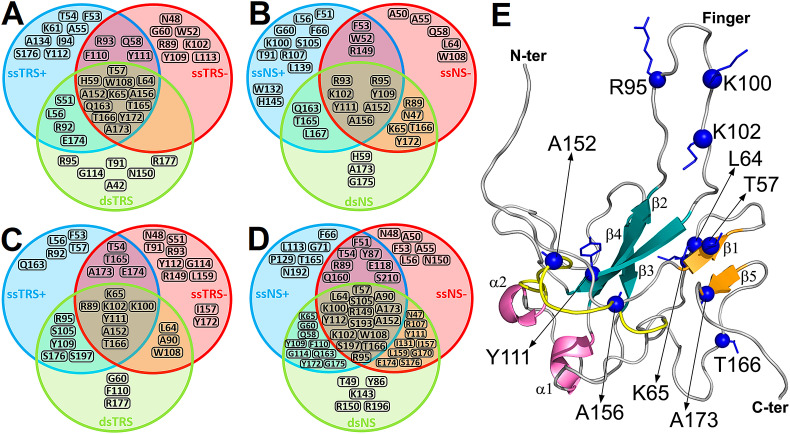
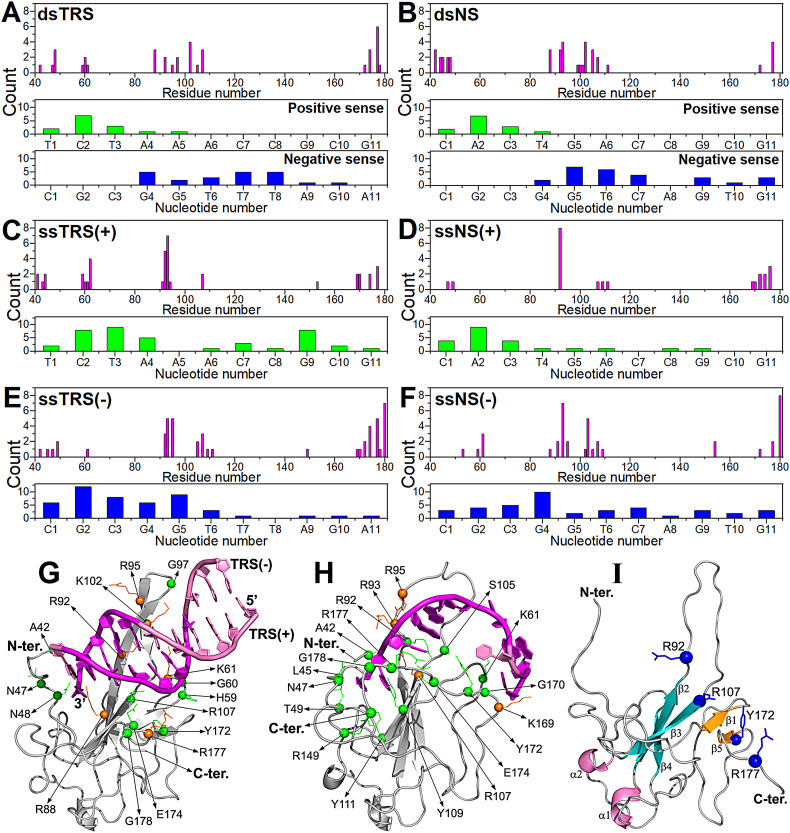
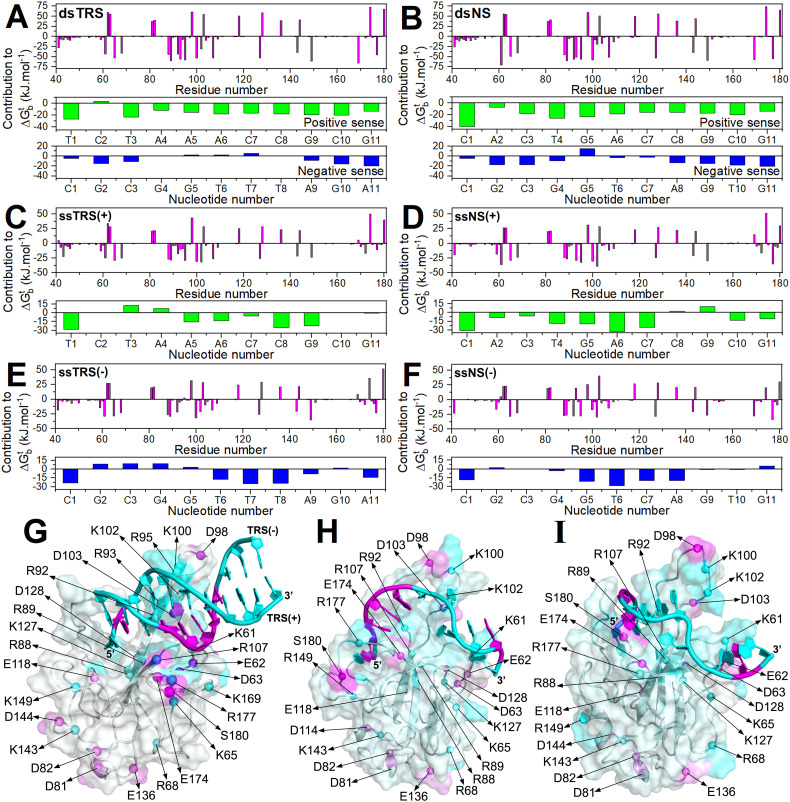
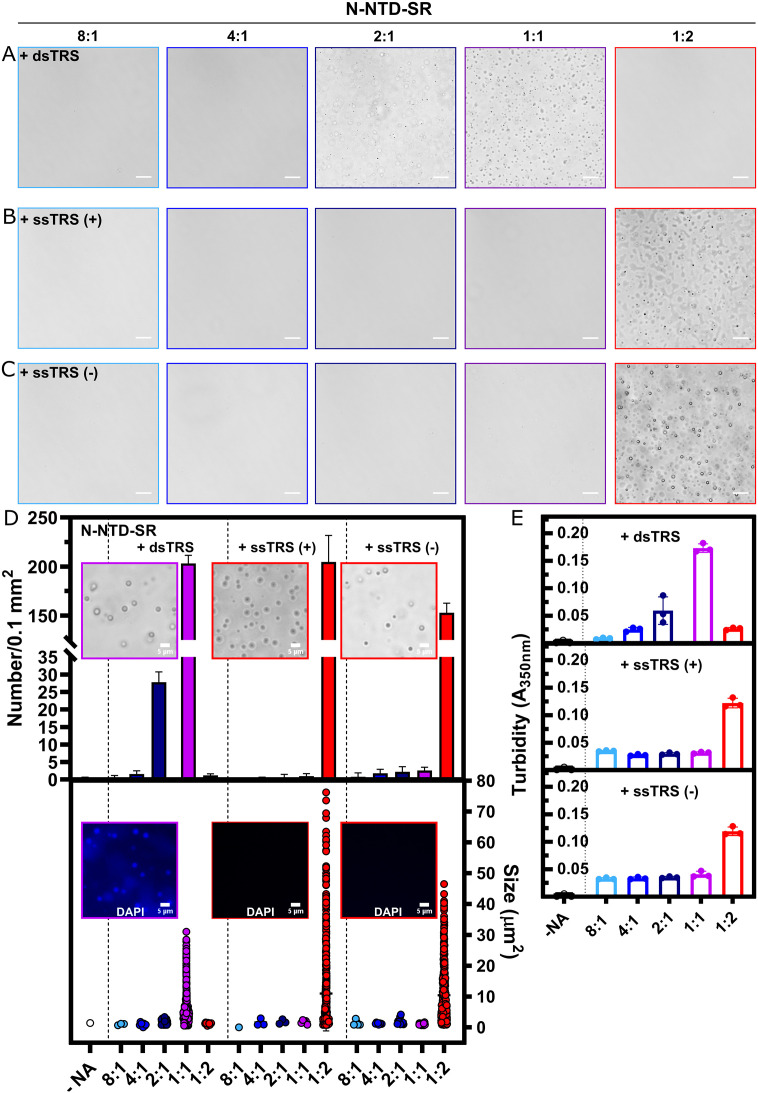
The SARS-CoV-2 nucleocapsid protein (N) is a multifunctional promiscuous nucleic acid-binding protein, which plays a major role in nucleocapsid assembly and discontinuous RNA transcription, facilitating the template switch of transcriptional regulatory sequences (TRS). Here, we dissect the structural features of the N protein N-terminal domain (N-NTD) and N-NTD plus the SR-rich motif (N-NTD-SR) upon binding to single and double-stranded TRS DNA, as well as their activities for dsTRS melting and TRS-induced liquid-liquid phase separation (LLPS). Our study gives insights on the specificity for N-NTD(-SR) interaction with TRS. We observed an approximation of the triple-thymidine (TTT) motif of the TRS to β-sheet II, giving rise to an orientation difference of ~25° between dsTRS and non-specific sequence (dsNS). It led to a local unfavorable energetic contribution that might trigger the melting activity. The thermodynamic parameters of binding of ssTRSs and dsTRS suggested that the duplex dissociation of the dsTRS in the binding cleft is entropically favorable. We showed a preference for TRS in the formation of liquid condensates when compared to NS. Moreover, our results on DNA binding may serve as a starting point for the design of inhibitors, including aptamers, against N, a possible therapeutic target essential for the virus infectivity.

Keywords: Binding specificity; DNA/RNA binding protein; SARS-CoV-2 nucleocapsid protein.


Conflict of interest statement

The authors declare that no conflict of interest exists.

Figures

Fig. 1
Fig. 1
dsDNA/dsRNA melting activity of N-NTD and N-NTD-SR. (A) Cartoon model of the dsTRS melting activity of N-NTD(-SR). The ssTRSs are presented as curved lines and the fluorescent probes (Q570 and Q670) as stars. ssTRS(+) and ssTRS(−) are colored in blue and red, respectively. The protein is denoted as a colored surface. (B) Fluorescence spectra of the Q570-ssTRS(+)/Q670-ssTRS(−) DNA duplex (50 nM) at absence and presence of N-NTD or N-NTD-SR (λexc = 535 nm and temperature at 20 °C). The arrows denote the changes in the spectra as protein is added. (C) FRET efficiency as a function of the total concentration of N-NTD-SR for dsDNA (black squares) and dsRNA (blue circles) melting activity in 20 mM sodium phosphate buffer (pH 6.5) containing 100 mM NaCl, and as a function of total concentration of N-NTD-SR (gray triangles up) and N-NTD (cyan triangle down) for dsDNA melting activity in 20 mM sodium phosphate buffer (pH 6.5) containing 50 mM NaCl.
Fig. 2
Fig. 2
Thermodynamic analysis of the binding of TRS and NS DNAs to N-NTD and N-NTD-SR. (A) Protein intrinsic fluorescence quenching changes of N-NTD as a function of the ssTRS(−) concentration in 20 mM Bis-Tris buffer (pH 6.5) at 15, 25, and 35 °C. Each point on the binding isotherm represents the average and standard error calculated from triplicate measurements. The continuous lines denote the theoretical curves globally adjusted to the experimental data. The inset shows the van't Hoff plot determined the enthalpy change value for the N-NTD/ssTRS(−) complex. (B, C) Fluorescence recovery as a function of inorganic phosphate (Pi) and sodium chloride (NaCl) concentration for the formation of the N-NTD:ssDNA complexes. (D) Thermodynamic parameters for the interaction of TRS and NS DNAs with the N-NTD and N-NTD-SR at 25 °C. For each DNA, the orange bar on the left denotes the enthalpy change (ΔH); the green bar in the middle, the Gibbs free energy change (ΔG); and the purple on the right, the entropic term (TΔS). The error bars represent the standard deviation calculated from duplicate or triplicate measurements.
Fig. 3
Fig. 3
Mapping the residues involved in the protein/TRS interaction. Chemical shift perturbation (CSP) for the interaction of the N-NTD with (A) ssTRS(−), (B) ssTRS(+), and (C) dsTRS, and of the N-NTD-SR with (D) ssTRS(−), (E) ssTRS(+), and (F) dsTRS. The dotted line denotes the average CSP value (Δδave) plus one standard deviation (SD), which is the cutoff used to identify the most significant residues involved in the binding to DNA. The proline residues (46, 67, 73, 80, 106, 117, 122, 142, 151, 162, 168, 199, and 207) are indicated by triangle. Resonances signals broadened beyond detection upon TRS titration are represented by the filled black circles. Representative structural model of the N-NTD:DNA complexes for (G) dsTRS and (H) ssTRS(−) obtained from the molecular docking and molecular dynamic simulations. The spheres denote the residues with CSP values higher than Δδave + SD, participating directly in the binding interface (blue) and in the remote region (cyan). (I) Comparison of the position and orientation for dsTRS (light pink) and dsNS (cyan) with a difference of ~25° between them. The proteins are shown as a cartoon model, DNAs are represented as a cartoon-ring model, and the TTT motif in TRS is colored in magenta.
Fig. 4
Fig. 4
Consensus of residues involved in the protein:DNA binding. Intersecting set of residues represented by circles containing the significant CSP information (higher than Δδave + SD or resonances signals broadened beyond detection upon DNA binding) for the interaction of the TRS and NS with (A and B) N-NTD and (C and D) N-NTD-SR. The blue, red, and green sphere denotes the CSP set for ssDNA(+), ssDNA(−), and ds DNA, respectively. (E) The DNA-binding residues most recurrent in the intersections for the protein:DNA binding are indicated as blue spheres on the N-NTD structure. The protein is shown as a cartoon model with the β-sheet I (β2/β3/β4), β-sheet II (β1/β5), and α-helices (α1 and α2) colored in dark green, light orange, and magenta, respectively. The thumb (residues I146–V158 in α2/β5) is colored in yellow.
Fig. 5
Fig. 5
Protein-DNA hydrogens bonds involved in the structure models of the N-NTD:DNA complex. Count of protein-DNA hydrogen bonds with persistency higher that 10% were with respect to amino acid (magenta bars) and nucleotide residues (green and blue bars) for the interaction of the N-NTD with (A) dsTRS, (B) dsNS, (C) ssTRS(+), (D) ssNS(+), (E) ssTRS(−), and (F) ssNS(−). The residues involved in the persistent protein-DNA hydrogen bonds (green sphere) and salt bridges (orange sphere) are indicated on the representative structural models of the (G) N-NTD:dsTRS and (H) N-NTD:ssTRS(−) complex. The protein is shown as a cartoon model in gray and DNA as a cartoon-ring model in light pink with TTT motif in magenta. (I) The most recurrent residues (R92, R107, Y172, and R177) involved in protein-DNA hydrogen bonds are indicated as blue spheres on the N-NTD structure. The protein is shown as a cartoon model with the β-sheet I (β2/β3/β4), β-sheet II (β1/β5), and α-helices (α1 and α2) colored in cyan, orange, and magenta, respectively.
Fig. 6
Fig. 6
Energy contribution to Gibbs free energy change (∆Gbt) of N-NTD:DNA binding. Energy contribution of the amino acid (magenta bars) and nucleotide (green and blue bars) residues to ∆Gbt (in kJ·mol−1) for the interaction of the N-NTD with (A) dsTRS, (B) dsNS, (C) ssTRS(+), (D) ssNS(+), (E) ssTRS(−), and (F) ssNS(−). Charged residues with most significant energy contribution to ∆Gbt are indicated as spheres on the representative structural models of the complexes of N-NTD with (G) dsTRS, (H) ssTRS(−), and (I) ssTRS(+). The protein is shown as a cartoon model and translucid surface in gray with the favorable and unfavorable energy contribution of the residues colored in cyan and magenta gradient, respectively. The DNA molecule is displayed as a cartoon-ring model with the favorable and unfavorable energy contribution of the nucleotides colored in cyan and magenta, respectively.
Fig. 7
Fig. 7
The high-affinity duplex TRS triggers N-NTD-SR phase separation at a lower protein:DNA stoichiometry. Representative phase contrast micrographs of 20 μM N-NTD-SR in presence of dsTRS (A); ssTRS(+) (B) or ssTRS(−) (C) at the following protein:DNA stoichiometries: 8:1 (light blue); 4:1 (marine blue); 2:1 (dark blue); 1:1 (purple); 1:2 (red), respectively, in 20 mM Tris-HCl buffer (pH 7.5) with 30 mM NaCl. (D) Top graph: Mean number of condensates ± S.D. per 100 μm2 area (n = 5 images). Top insets: Phase contrast microscopy in the presence of DAPI for conditions with the highest number of liquid droplets (1:1 for the dsTRS; 1:2 for ssTRS(+), and 1:2 for ssTRS(−)). Bottom graph: Scatter plot from the size of condensates (represented as area in μm2) obtained from micrographs analysis. The following number of condensates were measured: -NA (1); for dsTRS at 8:1 (N = 3); 4:1 (N = 8); 2:1 (N = 132); 1:1 (N = 1014) and 1:2 (N = 11); for ssTRS(+) at 8:1 (N = 1); 4:1 (N = 3); 2:1 (N = 3); 1:1 (N = 5) and 1:2 (N = 1019); for ssTRS(−) at 8:1 (N = 4); 4:1 (N = 9); 2:1 (N = 11); 1:1 (N = 21) and 1:2 (N = 759). Bottom inset: corresponding DAPI emission from the top graph insets images (DAPI stains condensates in presence of dsTRS and no fluorescence were observed for the ssTRSs). All conditions contained 10% (w/v) PEG-4000. Scale bar, 20 μm apart from insets (5 μm). (E) Phase separation of 20 μM N-NTD-SR in 20 mM Tris-HCl buffer (pH 7.5) with 30 mM NaCl in the presence of 10% (w/v) PEG-4000 monitored by absorbance measurements at 350 nm as a function of increasing concentrations of the specific DNA oligonucleotides dsTRS (top graph), ssTRS(+) (middle graph), and ssTRS(−) (bottom graph). The protein:DNA stoichiometries are the same as in (A).

References

    1. Singhal T. A review of coronavirus Disease-2019 (COVID-19), indian. J. Pediatr. 2020;87:281–286. doi: 10.1007/s12098-020-03263-6. - DOI - PMC - PubMed
    1. Lai C.C., Shih T.P., Ko W.C., Tang H.J., Hsueh P.R. Severe acute respiratory syndrome coronavirus 2 (SARS-CoV-2) and coronavirus disease-2019 (COVID-19): the epidemic and the challenges. Int. J. Antimicrob. Agents. 2020;55 doi: 10.1016/j.ijantimicag.2020.105924. - DOI - PMC - PubMed
    1. F. Jiang L.Deng., L. Zhang COVID-19. J. Gen. Intern. Med. 2019;2020:1–5. doi: 10.1007/s11606-020-05762-w. - DOI
    1. Sola I., Almazán F., Zúñiga S., Enjuanes L. Continuous and discontinuous RNA synthesis in coronaviruses. Annu. Rev. Virol. 2015;2:265–288. doi: 10.1146/annurev-virology-100114-055218. - DOI - PMC - PubMed
    1. Zúñiga S., Sola I., Alonso S., Enjuanes L. Sequence motifs involved in the regulation of discontinuous coronavirus subgenomic RNA synthesis. J. Virol. 2004;78:980–994. doi: 10.1128/jvi.78.2.980-994.2004. - DOI - PMC - PubMed

MeSH terms