

Structural Identification of Individual Helical Amyloid Filaments by Integration of Cryo-Electron Microscopy-Derived Maps in Comparative Morphometric Atomic Force Microscopy Image Analysis
- PMID: 35077765
- PMCID: PMC9005780
- DOI: 10.1016/j.jmb.2022.167466
Structural Identification of Individual Helical Amyloid Filaments by Integration of Cryo-Electron Microscopy-Derived Maps in Comparative Morphometric Atomic Force Microscopy Image Analysis
Abstract
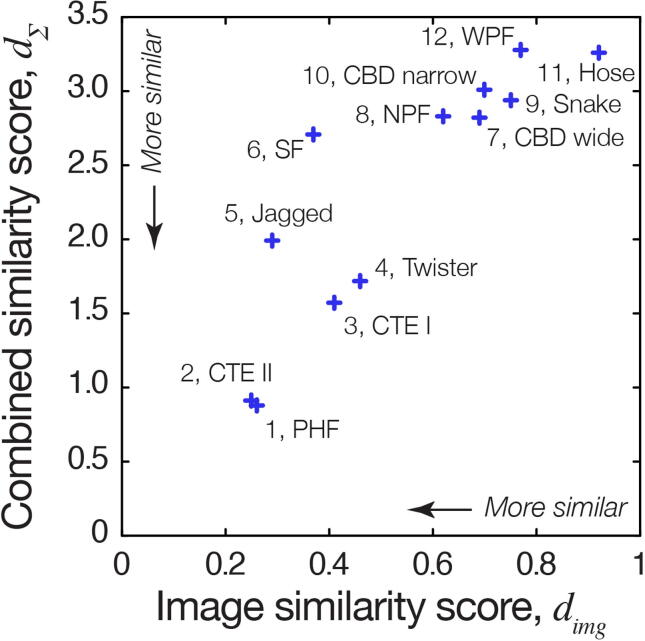
The presence of amyloid fibrils is a hallmark of more than 50 human disorders, including neurodegenerative diseases and systemic amyloidoses. A key unresolved challenge in understanding the involvement of amyloid in disease is to explain the relationship between individual structural polymorphs of amyloid fibrils, in potentially mixed populations, and the specific pathologies with which they are associated. Although cryo-electron microscopy (cryo-EM) and solid-state nuclear magnetic resonance (ssNMR) spectroscopy methods have been successfully employed in recent years to determine the structures of amyloid fibrils with high resolution detail, they rely on ensemble averaging of fibril structures in the entire sample or significant subpopulations. Here, we report a method for structural identification of individual fibril structures imaged by atomic force microscopy (AFM) by integration of high-resolution maps of amyloid fibrils determined by cryo-EM in comparative AFM image analysis. This approach was demonstrated using the hitherto structurally unresolved amyloid fibrils formed in vitro from a fragment of tau (297-391), termed 'dGAE'. Our approach established unequivocally that dGAE amyloid fibrils bear no structural relationship to heparin-induced tau fibrils formed in vitro. Furthermore, our comparative analysis resulted in the prediction that dGAE fibrils are structurally closely related to the paired helical filaments (PHFs) isolated from Alzheimer's disease (AD) brain tissue characterised by cryo-EM. These results show the utility of individual particle structural analysis using AFM, provide a workflow of how cryo-EM data can be incorporated into AFM image analysis and facilitate an integrated structural analysis of amyloid polymorphism.
Keywords: amyloid; atomic force microscopy; cryo-electron microscopy; polymorphism; structural biology.
Copyright © 2022 The Authors. Published by Elsevier Ltd.. All rights reserved.
Conflict of interest statement
Declaration of Competing Interest The authors declare that they have no known competing financial interests or personal relationships that could have appeared to influence the work reported in this paper.
Figures
Similar articles
-
Unraveling the complexity of amyloid polymorphism using gold nanoparticles and cryo-EM.Proc Natl Acad Sci U S A. 2020 Mar 24;117(12):6866-6874. doi: 10.1073/pnas.1916176117. Epub 2020 Mar 11. Proc Natl Acad Sci U S A. 2020. PMID: 32161130 Free PMC article.
-
Automated picking of amyloid fibrils from cryo-EM images for helical reconstruction with RELION.J Struct Biol. 2021 Jun;213(2):107736. doi: 10.1016/j.jsb.2021.107736. Epub 2021 Apr 6. J Struct Biol. 2021. PMID: 33831509 Free PMC article.
-
Automatic identification of crossovers in cryo-EM images of murine amyloid protein A fibrils with machine learning.J Microsc. 2020 Jan;277(1):12-22. doi: 10.1111/jmi.12858. Epub 2019 Dec 29. J Microsc. 2020. PMID: 31859366
-
Emerging Trends in Cryo-EM-based Structural Studies of Neuropathological Amyloids.J Mol Biol. 2023 Dec 15;435(24):168361. doi: 10.1016/j.jmb.2023.168361. Epub 2023 Nov 8. J Mol Biol. 2023. PMID: 37949311 Review.
-
Challenges in sample preparation and structure determination of amyloids by cryo-EM.J Biol Chem. 2021 Aug;297(2):100938. doi: 10.1016/j.jbc.2021.100938. Epub 2021 Jul 3. J Biol Chem. 2021. PMID: 34224730 Free PMC article. Review.
Cited by
-
Shapeshifting tau: from intrinsically disordered to paired-helical filaments.Essays Biochem. 2022 Dec 16;66(7):1001-1011. doi: 10.1042/EBC20220150. Essays Biochem. 2022. PMID: 36373666 Free PMC article.
-
Exploring the Aβ1-42 fibrillogenesis timeline by atomic force microscopy and surface enhanced Raman spectroscopy.Front Mol Biosci. 2024 Jun 14;11:1376411. doi: 10.3389/fmolb.2024.1376411. eCollection 2024. Front Mol Biosci. 2024. PMID: 38948077 Free PMC article.
-
Dityrosine cross-linking and its potential roles in Alzheimer's disease.Front Neurosci. 2023 Mar 22;17:1132670. doi: 10.3389/fnins.2023.1132670. eCollection 2023. Front Neurosci. 2023. PMID: 37034163 Free PMC article. Review.
-
Structural exposure of different microtubule binding domains determines the propagation and toxicity of pathogenic tau conformers in Alzheimer's disease.PLoS Pathog. 2025 Jun 13;21(6):e1012926. doi: 10.1371/journal.ppat.1012926. eCollection 2025 Jun. PLoS Pathog. 2025. PMID: 40512826 Free PMC article.
-
Assembly of recombinant tau into filaments identical to those of Alzheimer's disease and chronic traumatic encephalopathy.Elife. 2022 Mar 4;11:e76494. doi: 10.7554/eLife.76494. Elife. 2022. PMID: 35244536 Free PMC article.
References
-
- Al-Hilaly Y.K., Foster B.E., Biasetti L., Lutter L., Pollack S.J., Rickard J.E., Storey J.M.D., Harrington C.R., et al. Tau (297–391) forms filaments that structurally mimic the core of paired helical filaments in Alzheimer’s disease brain. FEBS Lett. 2020;594:944–950. doi: 10.1002/1873-3468.13675. - DOI - PMC - PubMed
MeSH terms
Substances
Grants and funding
LinkOut - more resources
Full Text Sources
Other Literature Sources
Medical
Miscellaneous
