Review
. 2022 Apr:67:102115.
doi: 10.1016/j.cbpa.2021.102115. Epub 2022 Jan 22.

Super-multiplexed vibrational probes: Being colorful makes a difference

Affiliations
Review

Super-multiplexed vibrational probes: Being colorful makes a difference

Naixin Qian et al. Curr Opin Chem Biol. 2022 Apr.

Abstract

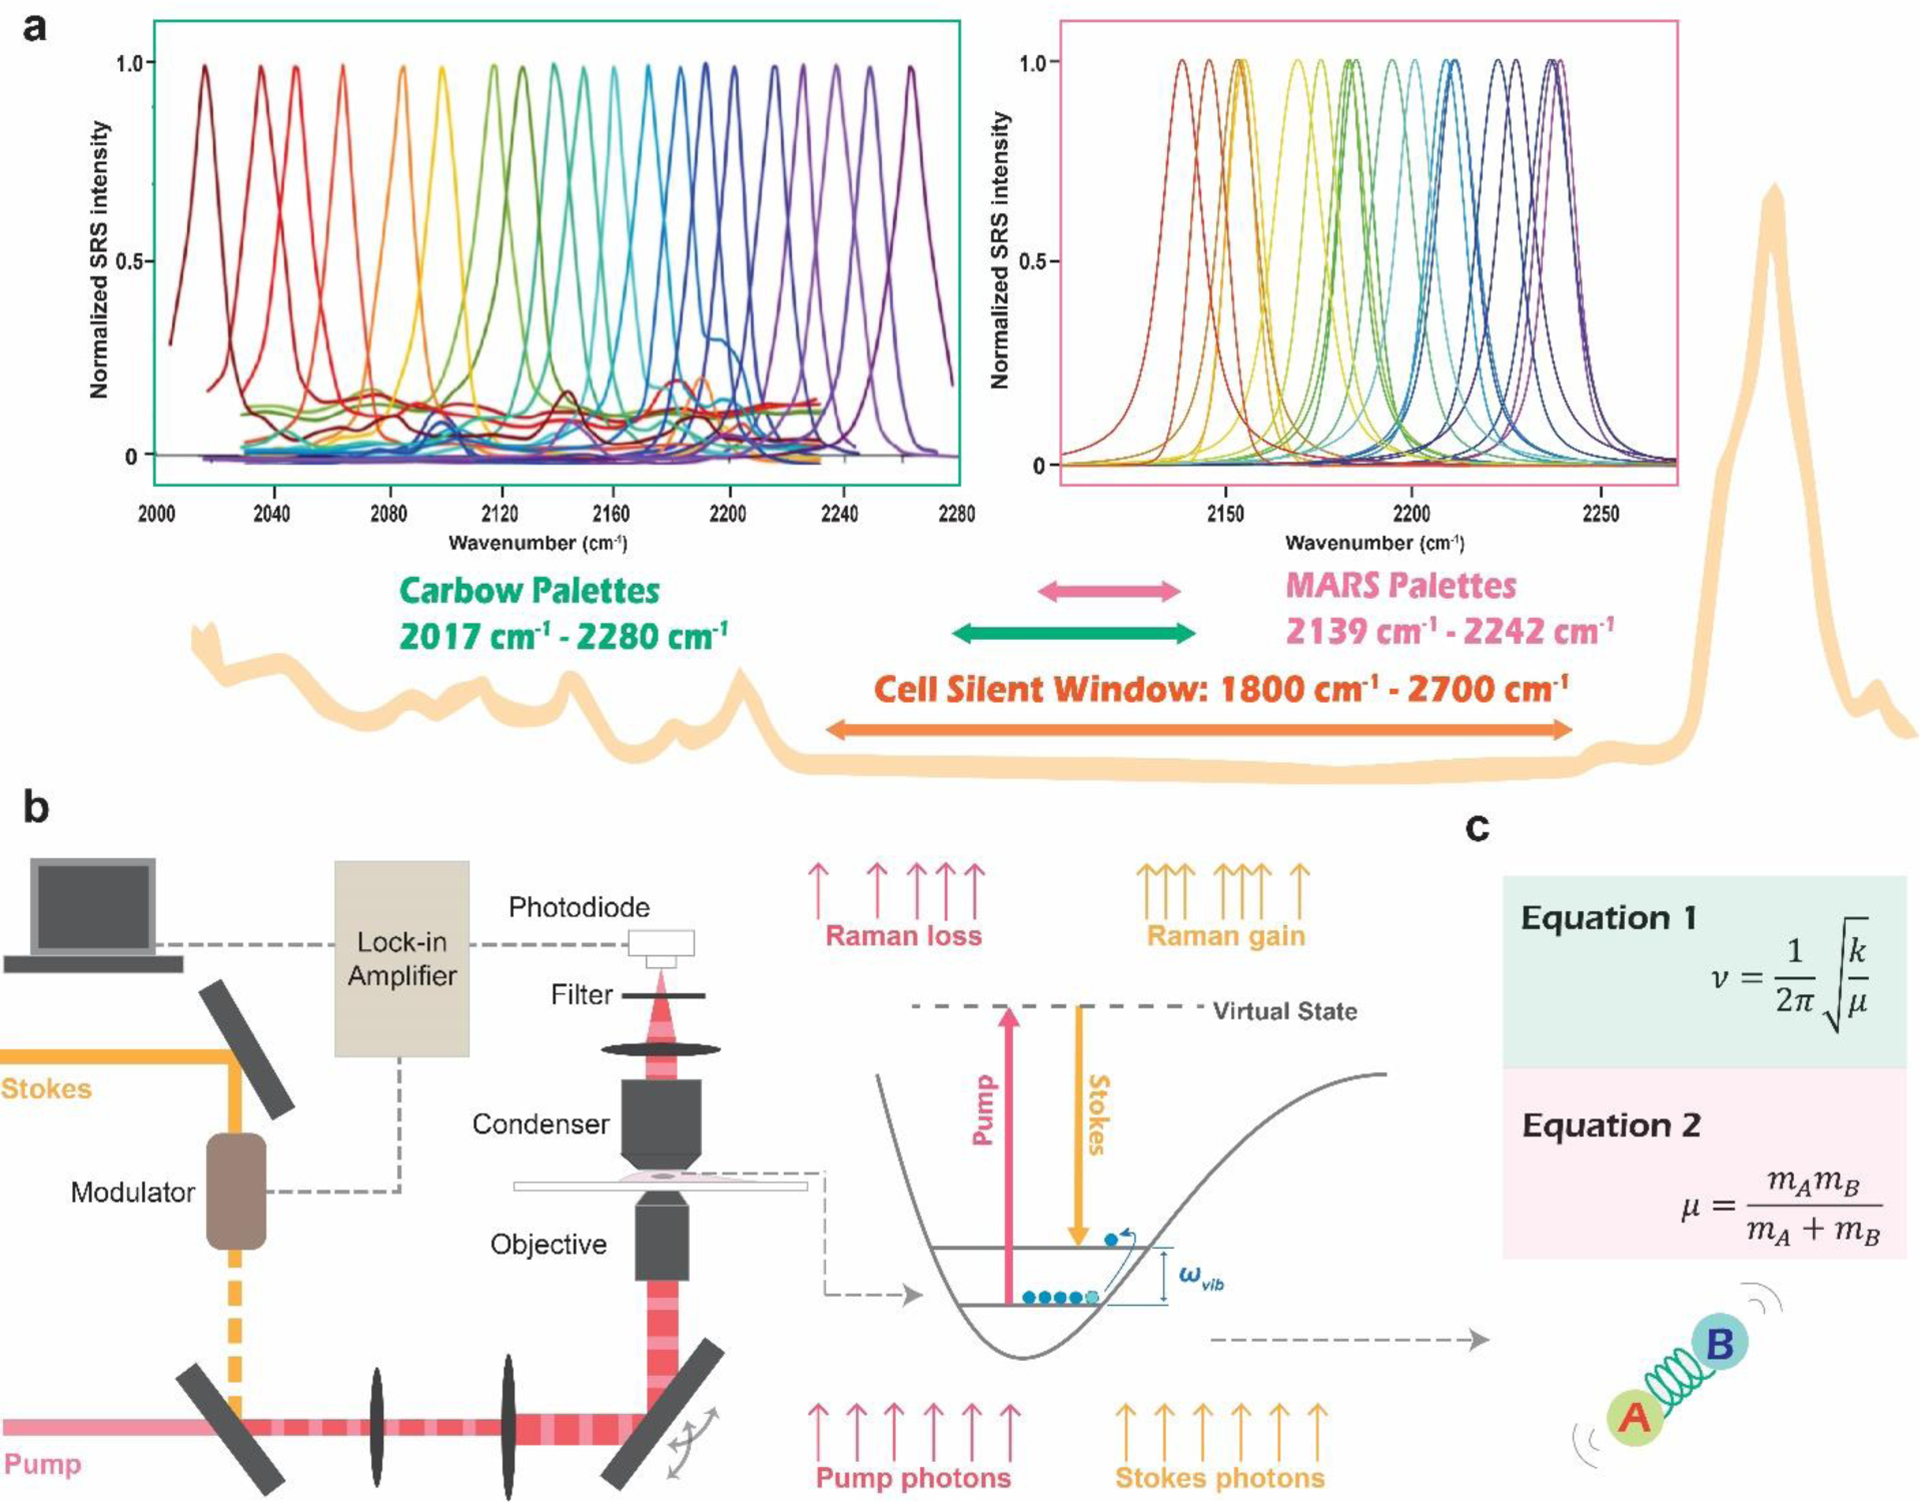
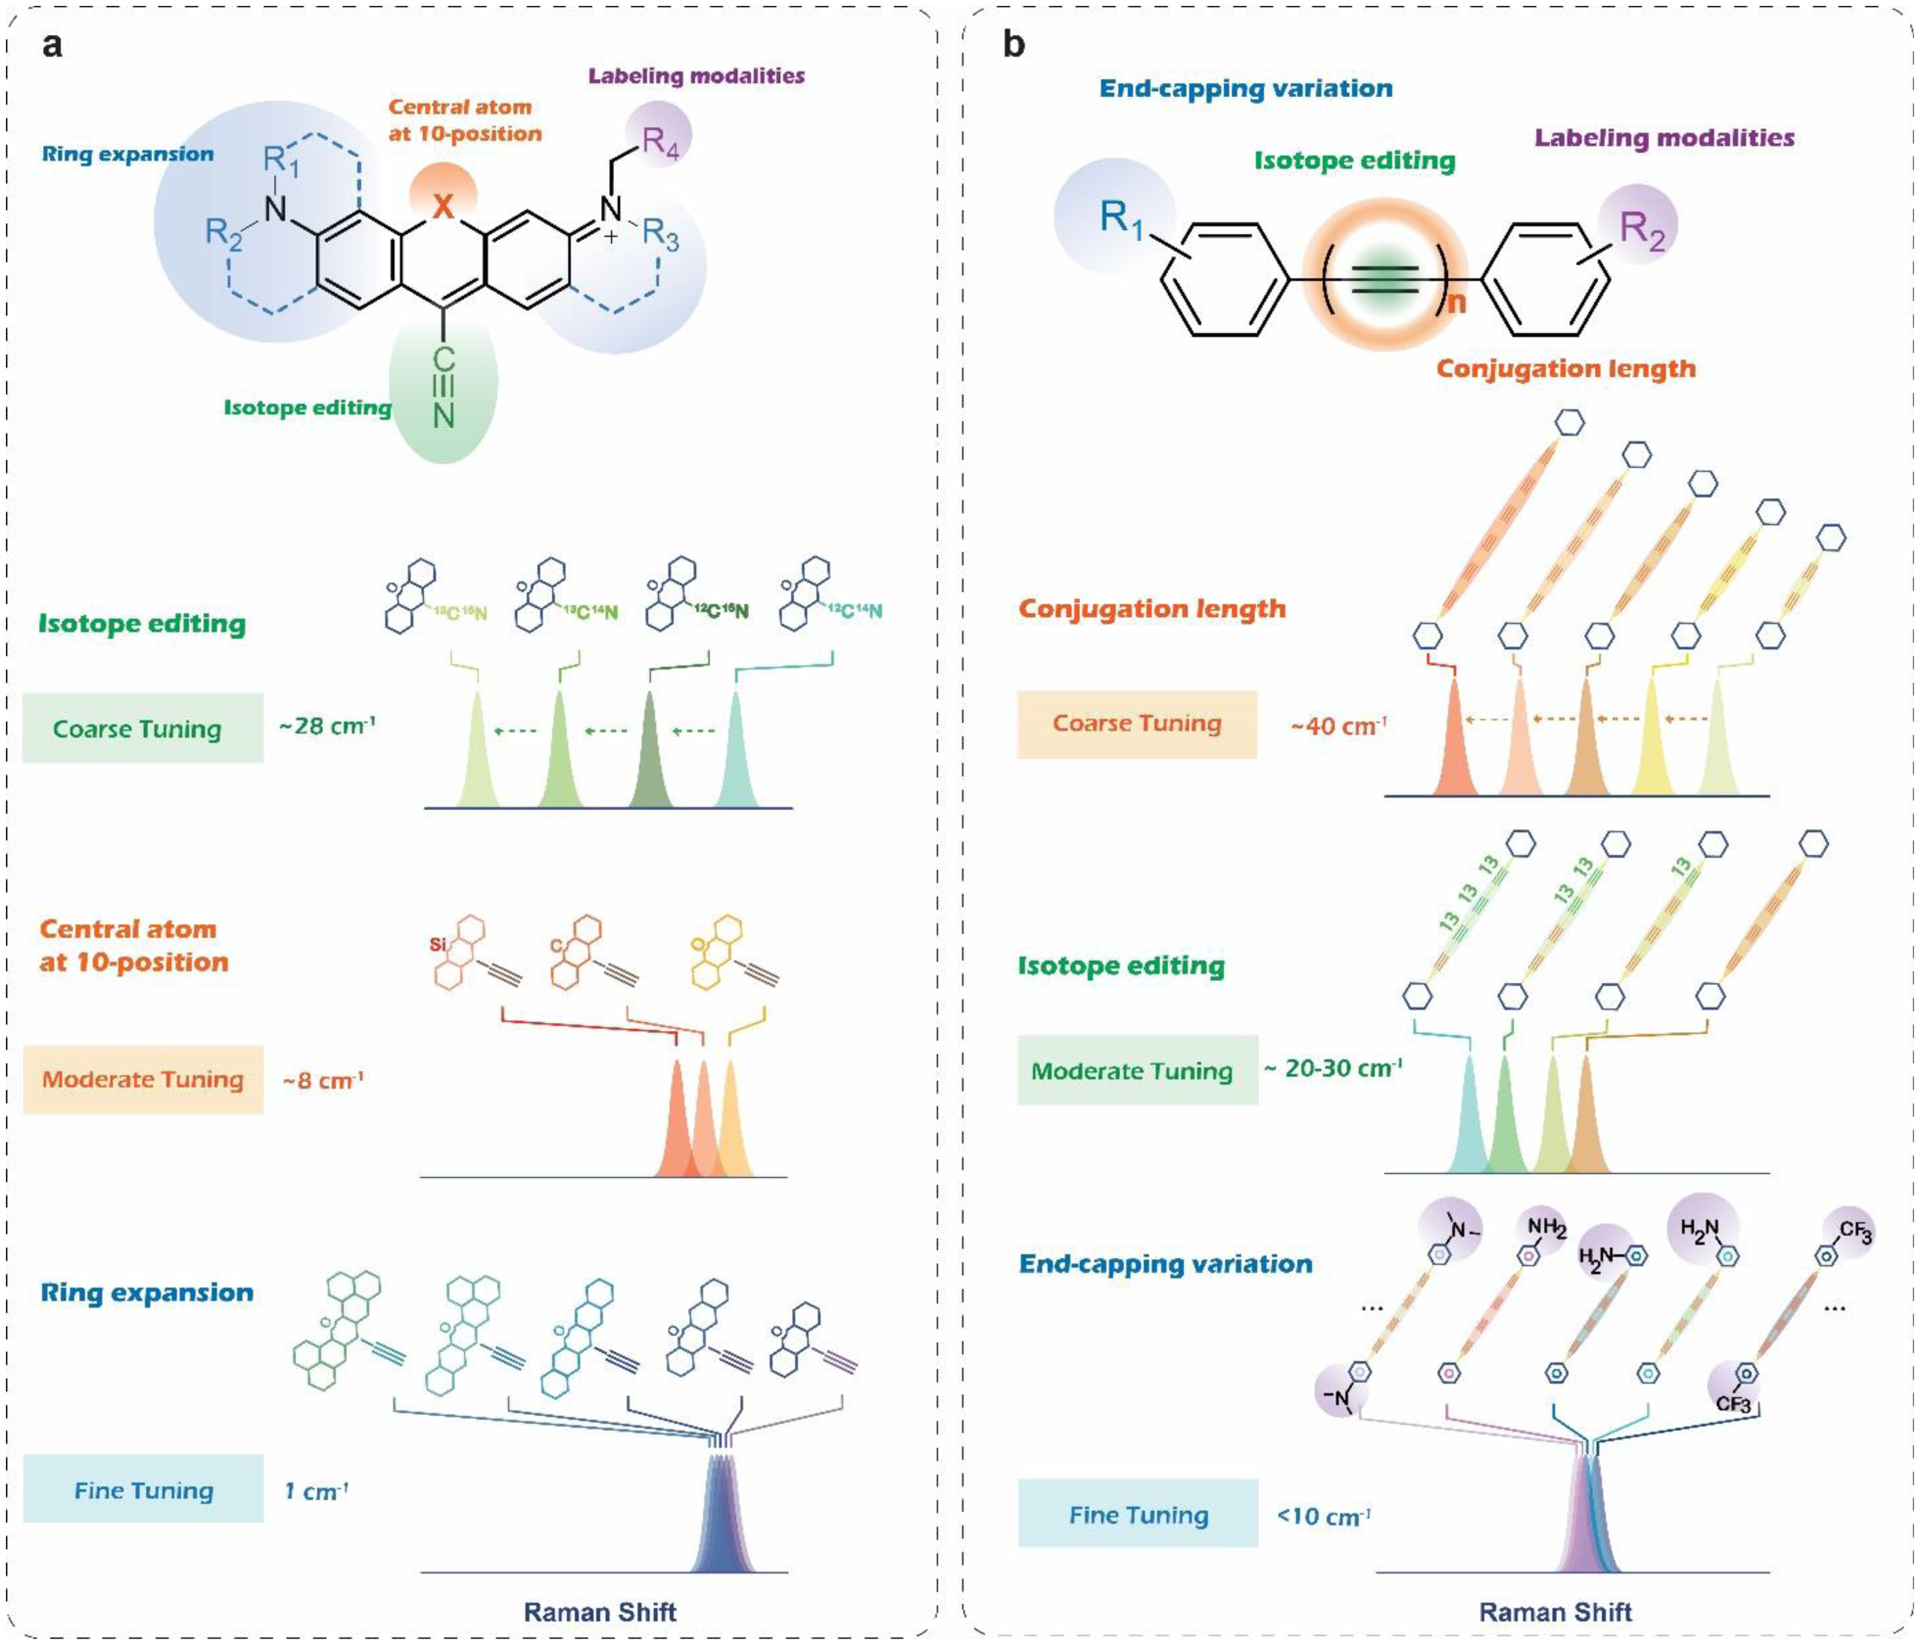
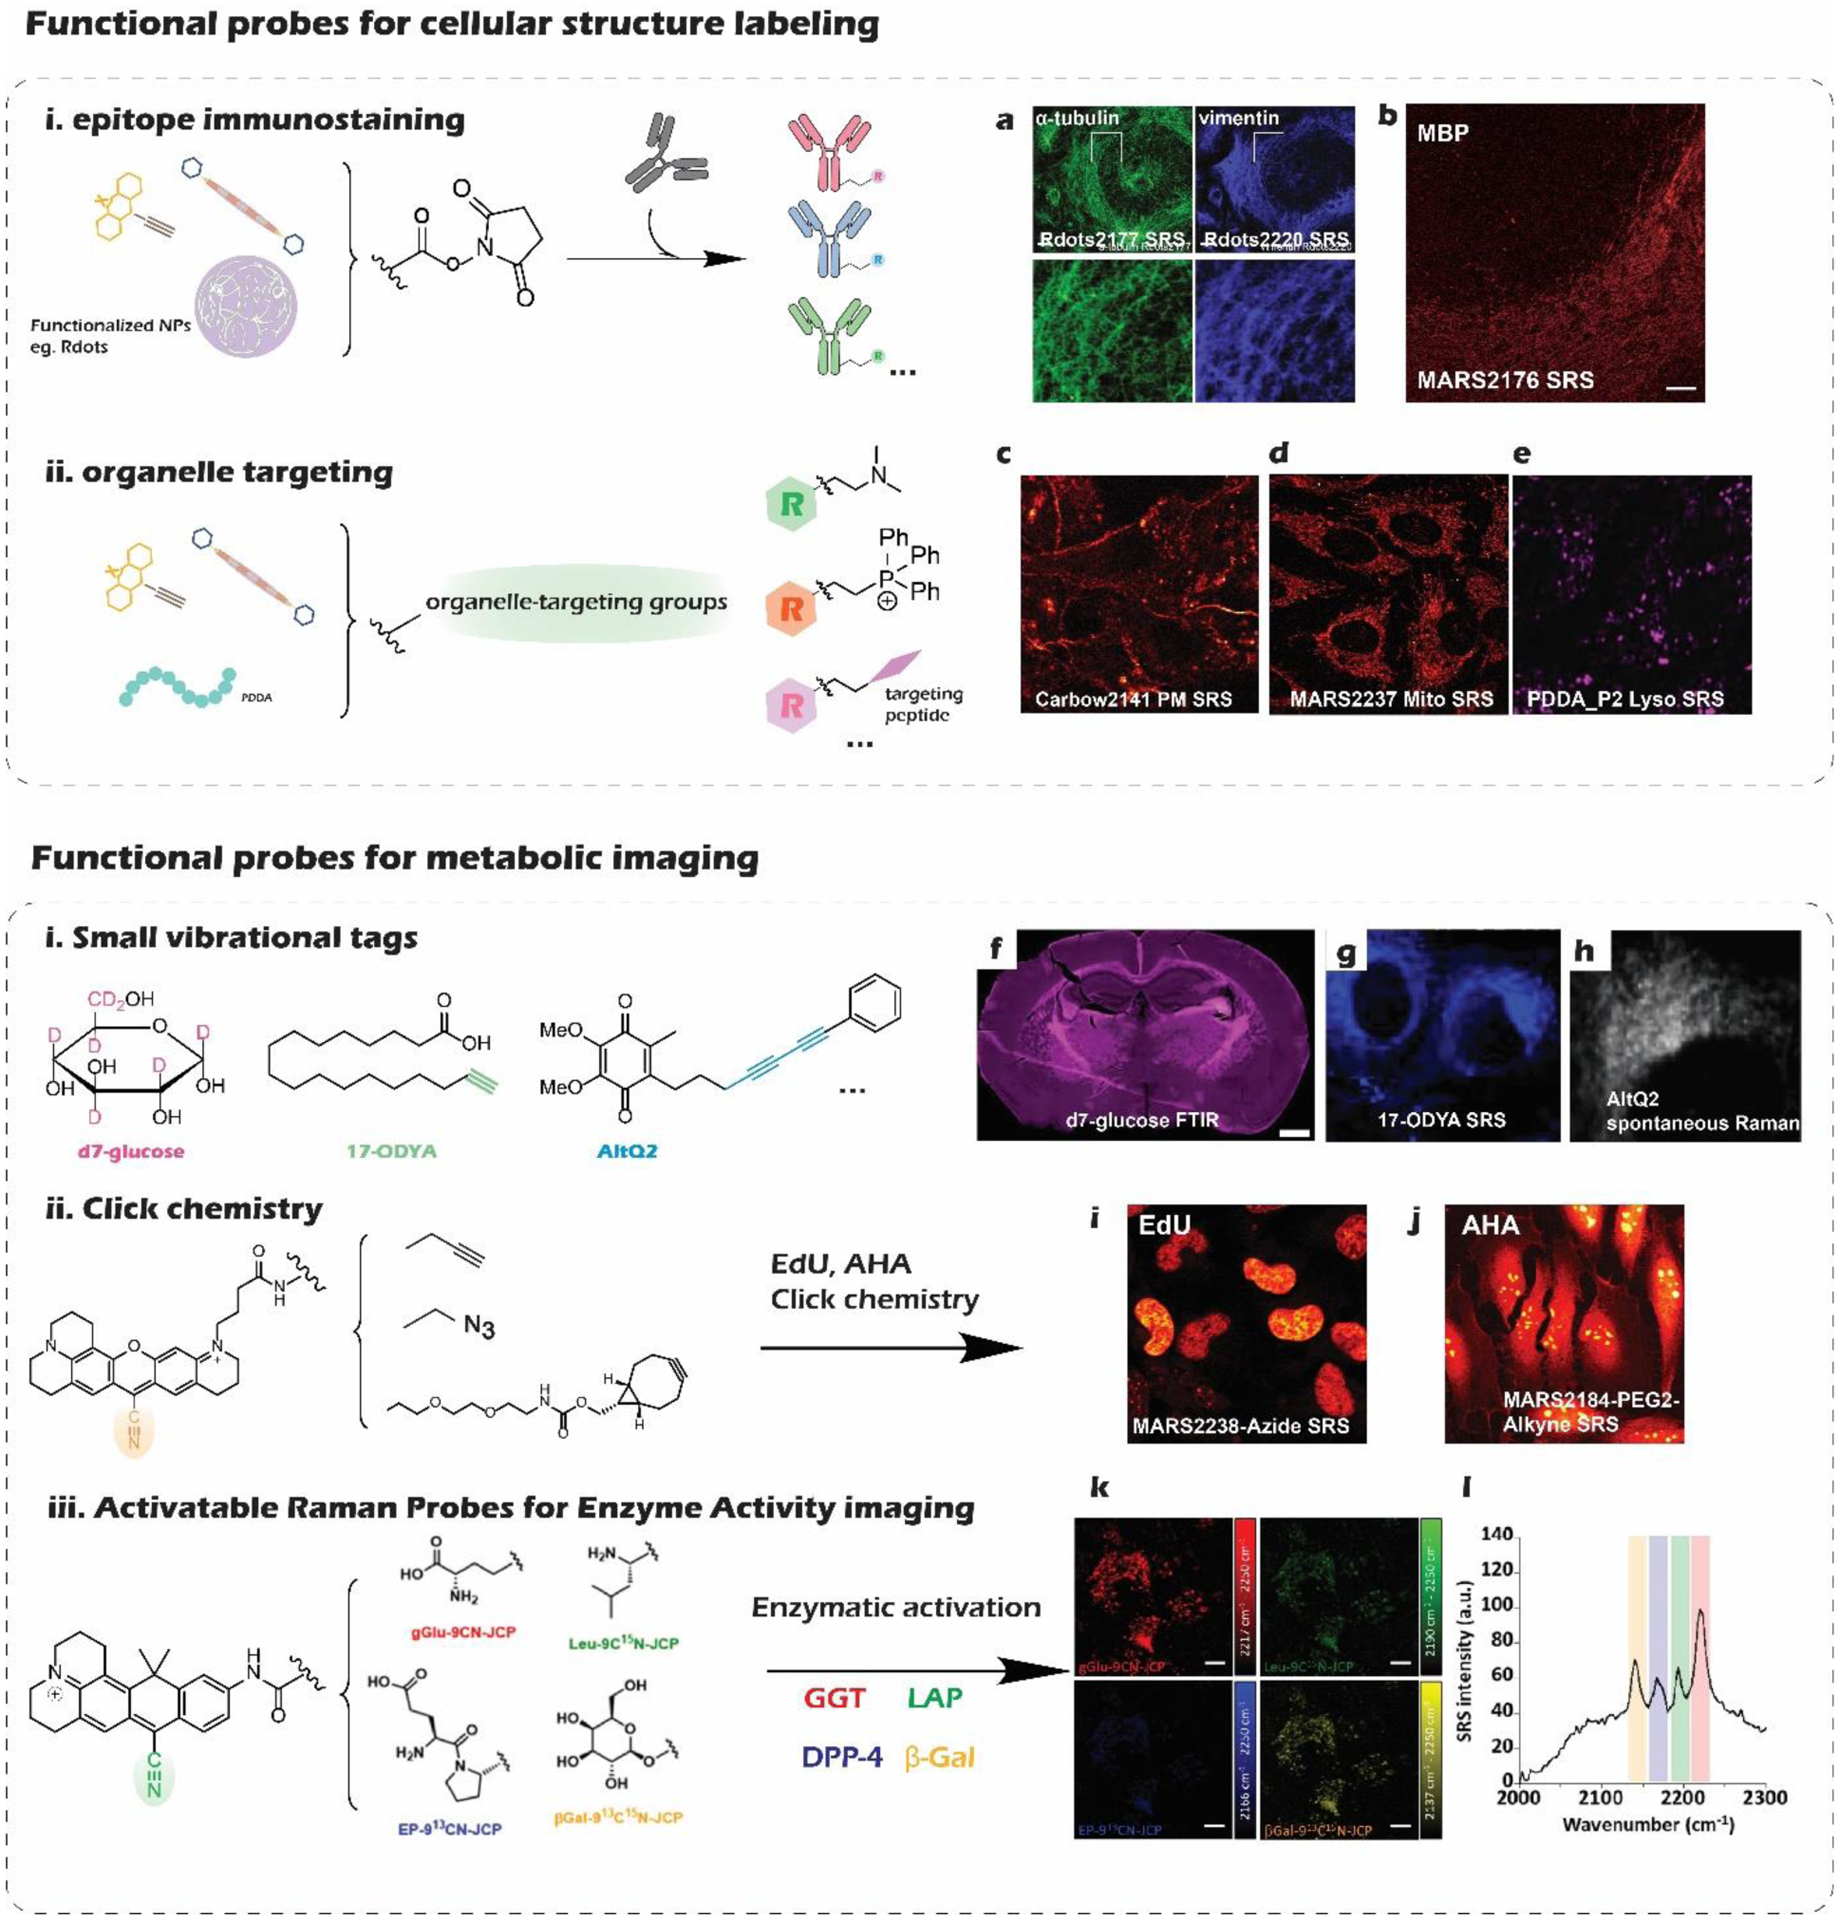
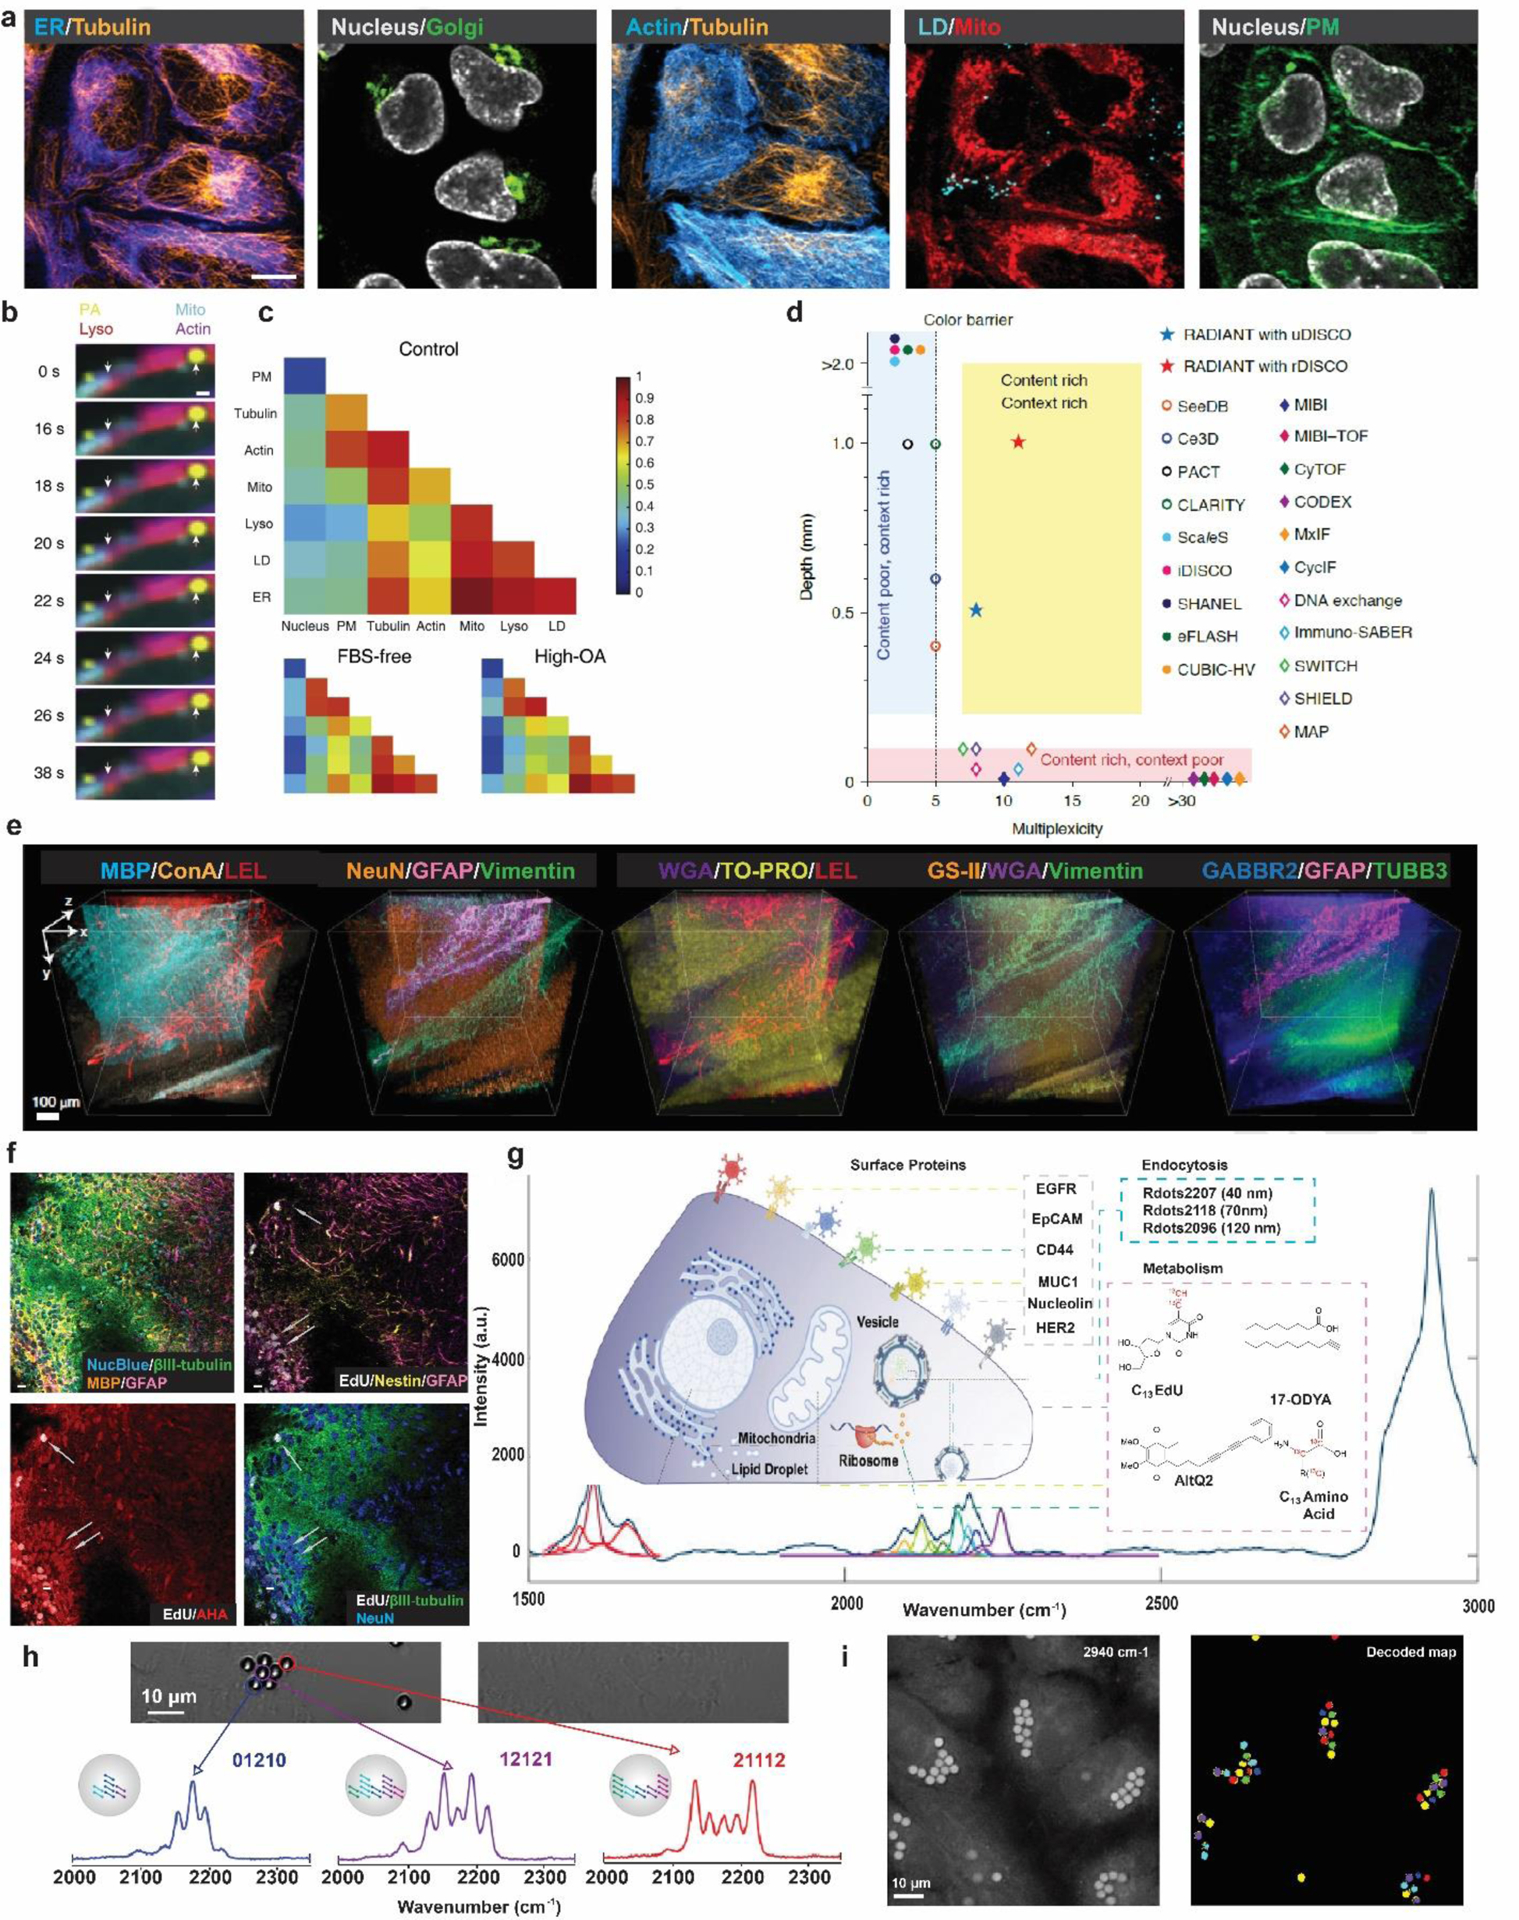
Biological systems with intrinsic complexity require multiplexing techniques to comprehensively describe the phenotype, interaction, and heterogeneity. Recent years have witnessed the development of super-multiplexed vibrational microscopy, overcoming the 'color barrier' of fluorescence-based optical techniques. Here, we will review the recent progress in the design and applications of super-multiplexed vibrational probes. We hope to illustrate how rainbow-like vibrational colors can be generated from systematic studies on structure-spectroscopy relationships and how being colorful makes a difference to various biomedical applications.

Keywords: Multiplex imaging; Raman microscopy; Stimulated Raman scattering; Vibrational probes.


Conflict of interest statement

Declaration of competing interest The authors declare that they have no known competing financial interests or personal relationships that could have appeared to influence the work reported in this paper.

Figures

Figure 1|
Figure 1|. Super-multiplexed vibrational palettes in the cell-silent window for SRS microscopy.
a. The typical Raman spectrum of cells contains a spectral window from 1800 cm−1 to 2700 cm−1, with no Raman peaks from endogenous biomolecules. Both of the super-multiplexed vibrational palettes, MARS and Carbow, have been developed within this spectral window. b. SRS microscopy illustration. Pump laser beam and modulated Stokes laser beam are combined and focused onto the sample. When the energy difference between the pump and the Stokes laser matches the vibrational energy(ωvib) of the chemical bond of interest, vibrational excitation happens. Each event is accompanied by one photon loss in the pump beam (stimulated Raman loss, SRL) and one photon gain in the Stokes beam (stimulated Raman gain, SRG). SRS signal is detected as the relative intensity change of the pump beam, which is extracted by the lock-in amplifier to achieve sensitive detection above the low-frequency laser background noise. c. Classical spring model to account for the tuning of vibrational frequency. ν (Hz) is the vibrational frequency determined by force constant k and reduced mass μ, while mA and mB are the atomic mass of atom A and B from the chemical bond.
Figure 2|
Figure 2|. Structural features and structure-spectroscopy relationship for MARS and Carbow palettes.
a. Schematic illustration of 9-Cyanopyronin based MARS dyes. From coarse tuning to fine tuning of the vibrational frequencies, isotope editing, central atom variation, and ring expansion can be used. The latter two rely on the specific chemical modification to xanthene rings to influence the k of the vibrational mode. b. Schematic illustration of polyyne-based Carbow dyes. Other than common isotope editing, two other tuning strategies on modifying conjugation length and end-capping variation are identified to be characteristic in engineering the Raman frequencies of polyynes.
Figure 3|
Figure 3|. Functionalized library of vibrational probes.
a. α-tubulin immunostaining with functionalized Rdots2177. b. Vimentin immunostaining with functionalized Rdots2220. c. MBP (myelin basic protein) in mouse cerebellum labeled by immunostaining with MARS2176 antibody conjugate. Scale bar, 50 μm. c. SRS imaging of plasma membrane (PM) in live Hela cells labeled by Carbow2141 PM. d. Imaging mitochondria with MARS2237 in live cells. e. SRS imaging of lysosomes in Hela cells labeled by PDDAP2. f. IR imaging of glucose anabolic activity in the whole brain with d7-glucose, integrating the C–D band as 2,060–2,220 cm−1. Scale bar, 1 mm. g. SRS imaging of fatty acid metabolism with fatty acyl derivatives 17-ODYA. h. Spontaneous Raman imaging of alkyne-labeled coenzyme Q (AltQ2) in live cells. i. SRS imaging of DNA synthesis in Hela cells with EdU and MARS2238-Azide through click reaction. j. SRS imaging of protein synthesis in Hela cells with AHA and MARS2184-PEG2-Alkyne through click reaction. k, Simultaneous detection of four enzyme activities in live A594 cells with SRS microscopy using four activable probes: gGlu-9CN-JCP, Leu-9C15N-JCP, EP-913CN-JCP, and βGal-913C15N-JCP. Scale bar, 10 μm. l. SRS spectra of enzyme activities obtained from A549 cells (left)
Figure 4
Figure 4. Biomedical applications enabled by super-multiplexed vibrational microscopy.
a. Ten-color optical imaging of PM (Carbow2141), ER (Carbow2226), Golgi (BODIPY TR), Mito (Carbow2262), LD (Carbow2202), Lyso (Carbow2086), nucleus (NucBlue), tubulin (SiR650), actin (GFP) and FM 4–64 in living Hela cells. Scale bar, 10 μm. b. Super-multiplex time-lapse imaging of live cells simultaneously showing shortening of Mito along the actin and small movement of large LD. The arrows indicate the initial positions of the mitochondria edge and the large LD. Scale bar, 1 μm. c. Single-cell analysis of organelle interactome by super-multiplex image-based cytometry of live cells. The matrix representation of medians of organelle correlation coefficients here reveals cell-to-cell heterogeneity for live HeLa cells grown in different culture conditions. d. Illustration on the content-context trade-off in immunohistochemistry-based protein imaging for current techniques. e. One-shot eleven-target volumetric imaging of 1-mm thick mouse cerebellum sections by RADIANT. Fluorescence: ConA (Concanavalin A), GS-II (Griffonia simplicifolia lectin), TUBB3, TO-PRO-3 (cell nuclei); epr-SRS: NeuN, LEL (Lycopersicon Esculentum lectin), MBP, GABBR2, WGA, Vimentin, GFAP. Z-step: 5 μm. Scale bars, 50 μm. f. Eight-color epr-SRS imaging of DNA replication and protein synthesis in hippocampal neuronal cultures epr-SRS: β-III-tubulin(neurons, green), myelin basic protein (MBP; oligodendrocytes, orange), glial fibrillary acidic protein (GFAP, astrocytes and neural stem cells, magenta), EdU(newly synthesized DNA, gray), AHA(newly synthesized proteins, red). Fluorescence: Nucblue (total DNA, cyan), NeuN (neurons, blue) and nestin (neural stem cells and astrocytes, yellow). Scale bars, 10 μm. g. Diagram illustrating of 14 Raman probes for multiparameter live-cell profiling and their subcellular targets and the resulting 14-plexed live-cell Raman spectra with unmixing processing. h. Typical Carbow barcoded cell IDs read out by spontaneous Raman measurement. i. Decoding and spatial visualization of barcoded beads in live cells with SRS microscopy. Scale bars, 10 μm.

References

    1. Krutzik PO; Nolan GP, Fluorescent cell barcoding in flow cytometry allows high-throughput drug screening and signaling profiling. Nat Methods 2006, 3 (5), 361–8. - PubMed
    1. Nitta N; Sugimura T; Isozaki A; Mikami H; Hiraki K; Sakuma S; Iino T; Arai F; Endo T; Fujiwaki Y, Intelligent image-activated cell sorting. Cell 2018, 175 (1), 266–276. e13. - PubMed
    1. Chen KH; Boettiger AN; Moffitt JR; Wang S; Zhuang X, Spatially resolved, highly multiplexed RNA profiling in single cells. Science 2015, 348 (6233). - PMC - PubMed
    1. Su JH; Zheng P; Kinrot SS; Bintu B; Zhuang X, Genome-Scale Imaging of the 3D Organization and Transcriptional Activity of Chromatin. Cell 2020, 182 (6), 1641–1659 e26. - PMC - PubMed
    1. Zhuang X, Spatially resolved single-cell genomics and transcriptomics by imaging. Nature Methods 2021, 18 (1), 18–22. - PMC - PubMed

Publication types

LinkOut - more resources