. 2022 May 9;114(5):753-760.
doi: 10.1093/jnci/djac017.

Impacts of an Opioid Safety Initiative on US Veterans Undergoing Cancer Treatment

Affiliations

Impacts of an Opioid Safety Initiative on US Veterans Undergoing Cancer Treatment

Lucas K Vitzthum et al. J Natl Cancer Inst. .

Abstract

Background: There is limited research on how the opioid epidemic and consequent risk reduction policies have affected pain management among cancer patients. The purpose of this study was to analyze how the Opioid Safety Initiative (OSI) implemented at the Veterans Health Administration affected opioid prescribing patterns and opioid-related toxicity.

Methods: We performed an interrupted time series analysis of 42 064 opioid-naïve patients treated at the Veterans Health Administration for prostate, lung, breast, and colorectal cancer from 2011 to 2016. Segmented regression was used to evaluate the impact of the OSI on the incidence of any new opioid prescriptions, high-risk prescriptions, persistent use, and pain-related emergency department (ED) visits. We compared the cumulative incidence of adverse opioid events including an opioid-related admission or diagnosis of misuse before and after the OSI. All statistical tests were 2-sided.

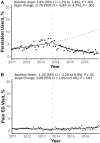
Results: The incidence of new opioid prescriptions was 26.7% (95% confidence interval [CI] = 25.0% to 28.4%) in 2011 and increased to 50.6% (95% CI = 48.3% to 53.0%) by 2013 before OSI implementation (monthly rate of change: +3.3%, 95% CI = 1.3% to 4.2%, P < .001). After the OSI, there was a decrease in the monthly rate of change for new prescriptions (-3.4%, 95% CI = -3.9 to -2.9%, P < .001). The implementation of the OSI was associated with a decrease in the monthly rate of change of concomitant benzodiazepines and opioid prescriptions (-2.5%, 95% CI = -3.2% to -1.8%, P < .001), no statistically significant change in high-dose opioids (-1.2%, 95% CI = -3.2% to 0.9%, P = .26), a decrease in persistent opioid use (-5.7%, 95% CI = -6.8% to -4.7%, P < .001), and an increase in pain-related ED visits (+3.0%, 95% CI = 1.0% to 5.0%, P = .003). The OSI was associated with a decreased incidence of opioid-related admissions (3-year cumulative incidence: 0.9% [95% CI = 0.7% to 1.0%] vs 0.5% [95% CI = 0.4% to 0.6%], P < .001) and no statistically significant change in the incidence of opioid misuse (3-year cumulative incidence: 1.2% [95% CI = 1.0% to 1.3%] vs 1.2% [95% CI = 1.1% to 1.4%], P = .77).

Conclusions: The OSI was associated with a relative decline in the rate of new, persistent, and certain high-risk opioid prescribing as well as a slight increase in the rate of pain-related ED visits. Further research on patient-centered outcomes is required to optimize opioid prescribing policies for patients with cancer.


Figures

Figure 1.
Figure 1.
Opioid prescribing patterns over time. Prescribing patterns over time are shown for (A) any opioid prescription, (B) high-dose (≥100 morphine milligram equivalent) opioid prescription, and (C) concomitant opioid and benzodiazepine prescriptions. The percent change in slope per month is given with the 95% confidence interval (CI) and P value. Two-sided P values are derived from a Poisson regression model. The solid lines represent fit from segmented regression. The dotted line represents counterfactual without intervention. The vertical dashed line indicates the time of intervention. Rx = prescription.
Figure 2.
Figure 2.
Rates of change in primary and secondary endpoints before and after the Opioid Safety Initiative. The bar graph indicates monthly rate of change on segmented regression for any opioid prescription, high-dose opioid prescription, concomitant opioid and benzodiazepine prescriptions, persistent opioid use, and pain-related emergency department visits. Two-sided P values are derived from a Poisson regression model.
Figure 3.
Figure 3.
Box plot showing the rates of new opioid prescriptions by facility per year. The median (horizontal line), standard error of the mean (wedge), interquartile range (box), and upper and lower limits (whiskers) are shown. The dashed black line represents the mean prescription rate per quarter across facilities. Rx = prescription.
Figure 4.
Figure 4.
Longer-term opioid and opioid outcomes over time, including (A) persistent use at 2 years and (B) pain-related emergency department (ED) visits. The percent change in value per month is given with the 95% confidence interval (CI) and P value. Two-sided P values are derived from a Poisson regression model. The solid lines represent fit from segmented regression. The dotted line represents counterfactual without intervention. The vertical dashed line indicates the time of intervention.
Figure 5.
Figure 5.
Cumulative incidence of (A) diagnosis of opioid misuse or dependence and (B) opioid-related admissions over time (years). Note: The gray and black curves are nearly overlaid in panel A because the cumulative incidence was highly similar between the 2 groups. Log-rank test was used to calculate 2-sided P values. OSI = opioid safety initiative.

References

    1. Hedegaard H, Minino AM, Warner M. Drug overdose deaths in the United States, 1999-2018. 2020. https://www.cdc.gov/nchs/data/databriefs/db356-h.pdf. Accessed March 1, 2021. - PubMed
    1. Guy GP, Zhang K, Bohm MK, et al. Vital signs: changes in opioid prescribing in the United States, 2006–2015. MMWR Morb Mortal Wkly Rep. 2017;66(26):697–704. doi: 10.15585/mmwr.mm6626a4. - DOI - PMC - PubMed
    1. Gellad WF, Good CB, Shulkin DJ. Addressing the opioid epidemic in the United States: lessons from the Department of Veterans Affairs. JAMA Intern Med. 2017;177(5):611–612. doi: 10.1001/jamainternmed.2017.0147. - DOI - PubMed
    1. Bohnert ASB, Guy GP, Losby JL. Opioid prescribing in the United States before and after the centers for disease control and prevention’s 2016 opioid guideline. Ann Intern Med. 2018;169(6):367–375. doi: 10.7326/M18-1243. - DOI - PMC - PubMed
    1. Paice JA. A delicate balance: risks vs benefits of opioids in cancer pain. Pain. 2020;161(3):459–460. doi: 10.1097/j.pain.0000000000001773. - DOI - PubMed

Publication types

Substances