. 2022 Jan 25;22(1):39.
doi: 10.1186/s12935-022-02468-3.

Green tea-derived theabrownin induces cellular senescence and apoptosis of hepatocellular carcinoma through p53 signaling activation and bypassed JNK signaling suppression

Affiliations

Green tea-derived theabrownin induces cellular senescence and apoptosis of hepatocellular carcinoma through p53 signaling activation and bypassed JNK signaling suppression

Jiaan Xu et al. Cancer Cell Int. .

Abstract

Background: Theabrownin (TB) is a bioactive component of tea and has been reported to exert effects against many human cancers, but its efficacy and mechanism on hepatocellular carcinoma (HCC) with different p53 genotypes remains unclarified.

Methods: MTT assay, DAPI staining, flow cytometry and SA-β-gal staining were applied to evaluate the effects of TB on HCC cells. Quantitative real time PCR (qPCR) and Western blot (WB) were conducted to explore the molecular mechanism of TB. A xenograft model of zebrafish was established to evaluate the anti-tumor effect of TB.

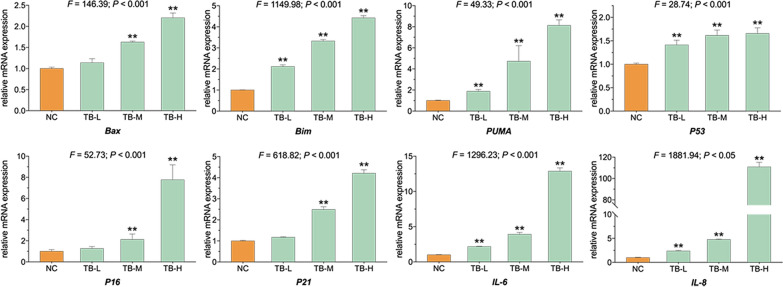
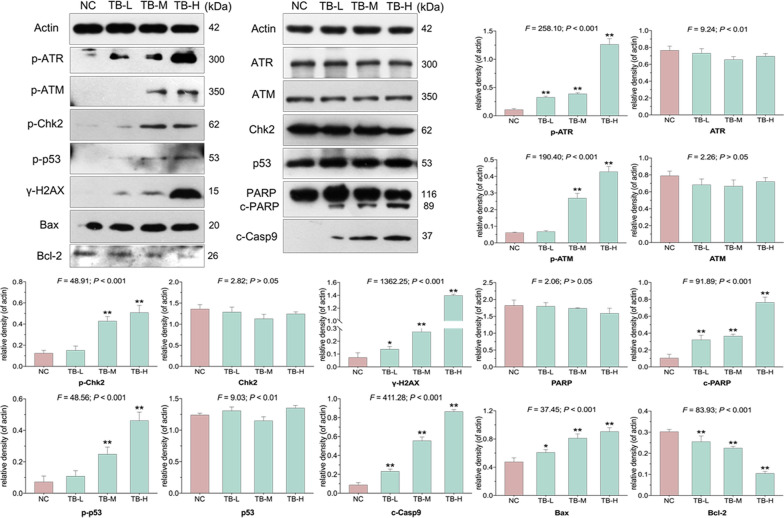
Results: MTT assays showed that TB significantly inhibited the proliferation of SK-Hep-1, HepG2, and Huh7 cells in a dose-dependent manner, of which SK-Hep-1 was the most sensitive one with the lowest IC50 values. The animal data showed that TB remarkably suppressed SK-Hep-1 tumor growth in xenograft model of zebrafish. The cellular data showed TB's pro-apoptotic and pro-senescent effect on SK-Hep-1 cells. The molecular results revealed the mechanism of TB that p53 signaling pathway (p-ATM, p-ATR, γ-H2AX, p-Chk2, and p-p53) was activated with up-regulation of downstream senescent genes (P16, P21, IL-6 and IL-8) as well as apoptotic genes (Bim, Bax and PUMA) and proteins (Bax, c-Casp9 and c-PARP). The p53-mediated mechanism was verified by using p53-siRNA. Moreover, by using JNK-siRNA, we found JNK as a bypass regulator in TB's mechanism.

Conclusions: To sum up, TB exerted tumor-inhibitory, pro-senescent and pro-apoptotic effects on SK-Hep-1 cells through ATM-Chk2-p53 signaling axis in accompany with JNK bypass regulation. This is the first report on the pro-senescent effect and multi-target (p53 and JNK) mechanism of TB on HCC cells, providing new insights into the underlying mechanisms of TB's anti-HCC efficacy.

Keywords: Apoptosis; Cellular senescence; Hepatocellular carcinoma; JNK; SK-Hep-1; Theabrownin; p53.


Conflict of interest statement

Author Jin Zhang was employed by the company Theabio Co., Ltd. The remaining authors declare that the research was conducted in the absence of any commercial or financial relationships that could be construed as a potential conflict of interest.

Figures

Fig. 1
Fig. 1
a Inhibitory rate of TB on SK-Hep-1, HepG2, and Huh7 cells at 24 h. b IC50 of TB on SK-Hep-1 cells at 24 and 48 h. c Morphological observation (light microscope) of SK-Hep1 cells with TB treatment for 24 h. Scale bar: 100 μm
Fig. 2
Fig. 2
a The mortality and adverse events of larval zebrafish with TB treatment. b Observation of SK-Hep-1 xenograft zebrafish with Cis-platin or TB treatment. c Data of fluorescence intensity and inhibitory effect of Cis-platin or TB. The fluorescent area (red) represents the HCC tumor mass. Values were presented as the mean ± SD (n = 30). **p < 0.01 vs. model (0 µg/ml)
Fig. 3
Fig. 3
a Representative images of DAPI staining of SK-Hep-1 cells with TB treatment for 24 h. Scale bar: 50 μm. b Flow cytometry analysis on SK-Hep-1 cell apoptosis with TB treatment for 24 h. Values were presented as the mean ± SD (n = 3). *p < 0.05 and **p < 0.01 vs. normal control
Fig. 4
Fig. 4
Representative images of SA-β-gal staining of SK-Hep-1 cells with TB treatment for 48 h. Scale bar: 200 μm. Values were presented as the mean ± SD (n =5). **p < 0.01. vs. normal control
Fig. 5
Fig. 5
Relative mRNA expression of target genes in SK-Hep-1 cells with TB treatment for 24 h. Values are presented as mean ± SD (n = 3). **p < 0.01 vs. normal control
Fig. 6
Fig. 6
Expression and phosphorylation of targeted proteins in SK-Hep-1 cells with TB treatment for 24 h. Values represent mean ± SD (n = 3). *p < 0.05 and **p < 0.01 vs. normal control
Fig. 7
Fig. 7
a Apoptotic morphology of SK-Hep-1 cells with p53-siRNA and TB (100 µg/ml) treatment by DAPI staining. Scale bar: 50 μm. Values are presented as mean ± SD (n = 5). **p < 0.01 vs. siNC group, ##p < 0.01 vs. siNC group plus TB treatment. b Inhibitory rate of TB (100 µg/ml) with nontargeting control siRNA or p53-siRNA treatments on SK-Hep-1 cells at 24 h. Values were presented as the mean ± SD (n = 5). ##p < 0.01 vs. siNC group plus TB treatment. c Relative mRNA expression of SK-Hep-1 cells with p53-siRNA and TB (100 µg/ml) treatments for 24 h. Values are presented as mean ± SD (n = 3). *p < 0.05 and **p < 0.01 vs. siNC group, #p < 0.05 and ##p < 0.01 vs. siNC group plus TB treatment. d Relative protein expression of SK-Hep-1 cells with p53-siRNA and TB (100 µg/ml) treatments for 24 h. Values are presented as mean ± SD (n = 3). *p < 0.05 and **p < 0.01 vs. siNC group, ##p < 0.01 vs. siNC group plus TB treatment. e Relative mRNA expression of SK-Hep-1 cells with JNK-siRNA and TB (100 µg/ml) treatments for 24 h. Values are presented as mean ± SD (n = 3). *p < 0.05 and **p < 0.01 vs. siNC group, #p < 0.05 and ##p < 0.01 vs. siNC group plus TB treatment. siNC, nontargeting control siRNA-treated group; sip53, p53-siRNA-treated group; siJNK, JNK-siRNA-treated group
Fig. 8
Fig. 8
Schematic diagram of the mechanism of TB on SK-Hep-1 cells

References

    1. Bray F, Ferlay J, Soerjomataram I, Siegel RL, Torre LA, Jemal A. Global cancer statistics 2018: GLOBOCAN estimates of incidence and mortality worldwide for 36 cancers in 185 countries. CA Cancer J Clin. 2018;68(6):394–424. doi: 10.3322/caac.21492. - DOI - PubMed
    1. Petrick JL, Florio AA, Znaor A, Ruggieri D, Laversanne M, Alvarez CS, Ferlay J, Valery PC, Bray F, McGlynn KA. International trends in hepatocellular carcinoma incidence, 1978-2012. Int J Cancer. 2020;147(2):317–30. - PMC - PubMed
    1. Akinyemiju T, Abera S, Ahmed M, Alam N, Alemayohu MA, Allen C, Al-Raddadi R, Alvis-Guzman N, Amoako Y, Artaman A, et al. The burden of primary liver cancer and underlying etiologies from 1990 to 2015 at the global, regional, and national level: results from the Global Burden of Disease Study 2015. JAMA Oncol. 2017;3(12):1683–91. - PMC - PubMed
    1. Singh S, Singh PP, Roberts LR, Sanchez W. Chemopreventive strategies in hepatocellular carcinoma. Nat Rev Gastroenterol Hepatol. 2014;11(1):45–54. - PMC - PubMed
    1. McGlynn KA, Petrick JL, El-Serag HB. Epidemiology of hepatocellular carcinoma. Hepatology. 2021 doi: 10.1002/hep.31288.. - DOI - PMC - PubMed