. 2022 Jan 25;41(1):36.
doi: 10.1186/s13046-021-02200-5.

The essential roles of m6A RNA modification to stimulate ENO1-dependent glycolysis and tumorigenesis in lung adenocarcinoma

Affiliations

The essential roles of m6A RNA modification to stimulate ENO1-dependent glycolysis and tumorigenesis in lung adenocarcinoma

Lifang Ma et al. J Exp Clin Cancer Res. .

Abstract

Background: Lung adenocarcinoma (LUAD) is the most common subtype of lung cancer. Patient prognosis is poor, and the existing therapeutic strategies for LUAD are far from satisfactory. Recently, targeting N6-methyladenosine (m6A) modification of RNA has been suggested as a potential strategy to impede tumor progression. However, the roles of m6A modification in LUAD tumorigenesis is unknown.

Methods: Global m6A levels and expressions of m6A writers, erasers and readers were evaluated by RNA methylation assay, dot blot, immunoblotting, immunohistochemistry and ELISA in human LUAD, mouse models and cell lines. Cell viability, 3D-spheroid generation, in vivo LUAD formation, experiments in cell- and patient-derived xenograft mice and survival analysis were conducted to explore the impact of m6A on LUAD. The RNA-protein interactions, translation, putative m6A sites and glycolysis were explored in the investigation of the mechanism underlying how m6A stimulates tumorigenesis.

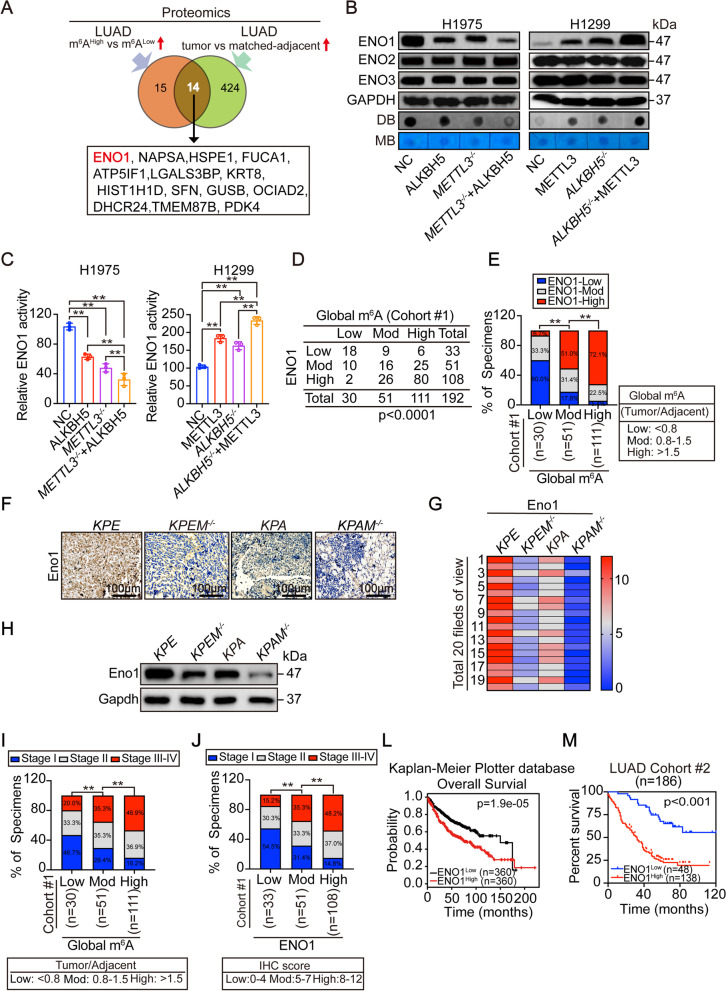
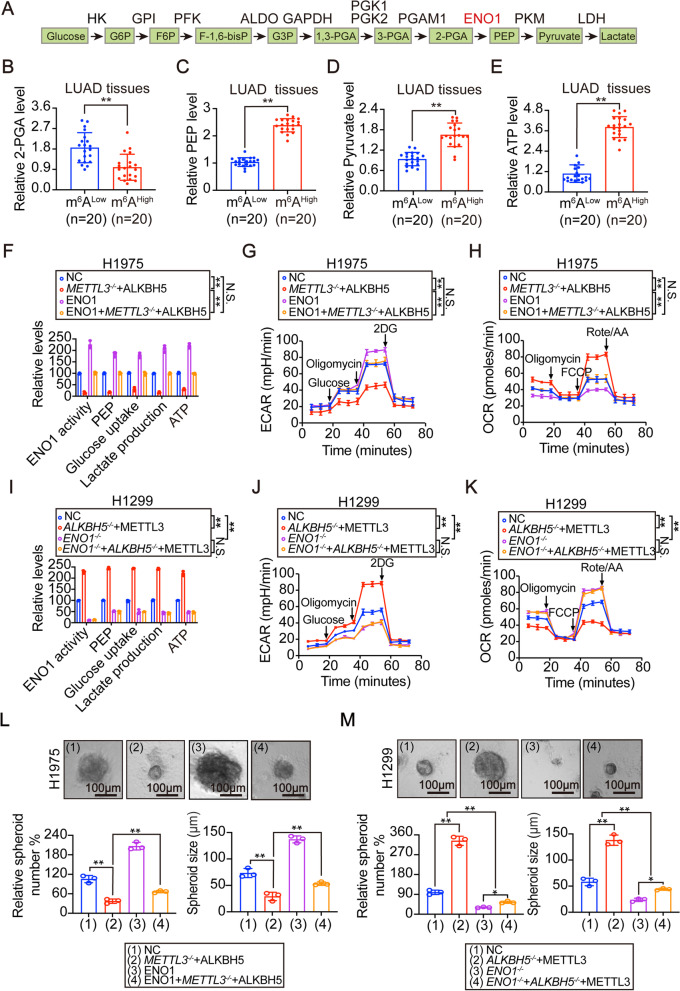
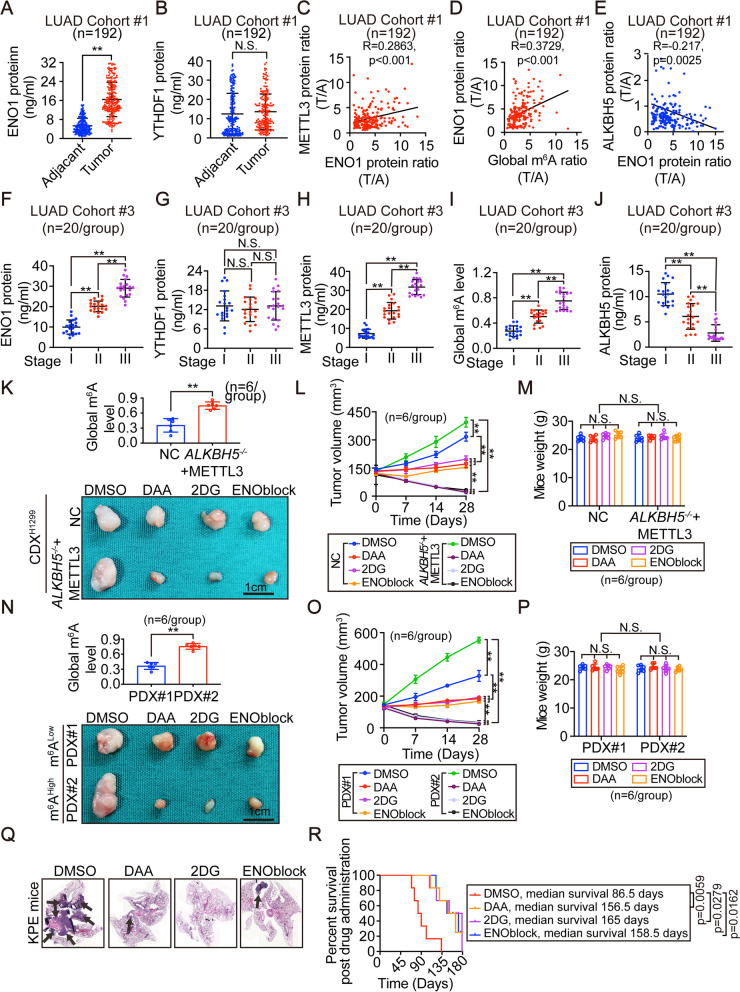
Results: The elevation of global m6A level in most human LUAD specimens resulted from the combined upregulation of m6A writer methyltransferase 3 (METTL3) and downregulation of eraser alkB homolog 5 (ALKBH5). Elevated global m6A level was associated with a poor overall survival in LUAD patients. Reducing m6A levels by knocking out METTL3 and overexpressing ALKBH5 suppressed 3D-spheroid generation in LUAD cells and intra-pulmonary tumor formation in mice. Mechanistically, m6A-dependent stimulation of glycolysis and tumorigenesis occurred via enolase 1 (ENO1). ENO1 mRNA was m6A methylated at 359 A, which facilitated it's binding with the m6A reader YTH N6-methyladenosine RNA binding protein 1 (YTHDF1) and resulted in enhanced translation of ENO1. ENO1 positively correlated with METTL3 and global m6A levels, and negatively correlated with ALKBH5 in human LUAD. In addition, m6A-dependent elevation of ENO1 was associated with LUAD progression. In preclinical models, tumors with a higher global m6A level showed a more sensitive response to the inhibition of pan-methylation, glycolysis and ENO activity in LUAD.

Conclusions: The m6A-dependent stimulation of glycolysis and tumorigenesis in LUAD is at least partially orchestrated by the upregulation of METTL3, downregulation of ALKBH5, and stimulation of YTHDF1-mediated ENO1 translation. Blocking this mechanism may represent a potential treatment strategy for m6A-dependent LUAD.

Keywords: ALKBH5; METTL3; RNA-protein interaction; YTHDF1; lung cancer; translation.


Conflict of interest statement

The authors declare no potential conflicts of interest.

Figures

Fig. 1
Fig. 1
Global m6A was modulated by METTL3 and ALKBH5 in LUAD.(A) Global m6A levels were measured by m6A methylation assay in tumor and matched-adjacent tissues from LUAD patients. (B) The percentage of LUAD in cohort #1 with distinct tumor/adjacent ratio of global m6A, as indicated. (C-D) METTL3 (C) and ALKBH5 (D) protein levels in tumor and matched-adjacent tissues from LUAD patients, as measured by ELISA. (E) IB of METTL3 and ALKBH5 in tumor and matched-adjacent tissues from 12 LUAD patients. (F-G) Correlation between global m6A and METTL3 (F), and between global m6A and ALKBH5 (G) in LUAD patients. The global m6A and protein levels were calculated as the ratios between tumor and matched-adjacent tissues. (H) The percentage of cases with different METTL3 and ALKBH5 expressions, as indicated, in LUAD with high global m6A levels. (I) The global m6A levels in different groups with indicated METTL3 and ALKBH5 expression from LUAD with high global m6A levels. (J) Global m6A levels in control and H1975 cells with separate or combined METTL3 knockout and ALKBH5 overexpression. (K) Global m6A levels in control and H1299 cells with separate or combined METTL3 overexpression and ALKBH5 knockout. (L-M) Percentage (L) and overall survival (M) of LUAD patients with different METTL3 and ALKBH5 expression, as indicated in cohort #2. Statistical analysis was performed using t-test (A, C, D), spearman rank-correlation analysis (F, G), one-way ANOVA (I-K) and log-rank test (M). Data are presented as means ± SEMs from indicated samples or three independent experiments. **p < 0.01, indicates statistical significance
Fig. 2
Fig. 2
The roles of METTL3 and ALKBH5 in LUAD tumorigenesis.(A) Schematic presentation of the construction of KP-based mice models and the principle timeframe for the experiments. (B) Tumor occurrence time in different KP-based mice models, as indicated. Mice were monitored from the 6th to 14th weeks post infection. (C) Representative images of H&E staining for lung bearing tumors in indicated KP-based mice models. Black arrow indicates tumor foci. (D-E) Number of tumors (D) and overall survival (E) in indicated KP-based mice models (n=6/group). (F-G) Representative images of lungs bearing tumors (F) and numbers of tumors in lung (G) from mice following tail injection of LLC cells with distinct modulations, as indicated. n=6/group, black arrow indicates tumor. (H-J) Images of xenografts that generated by H1975 cells under different modulations (H). The tumor weights (I) and volume (J) were also examined (n=8/group). Statistical analysis was performed using one-way ANOVA (B, D, G, I), log-rank test (E) and two-way ANOVA (J). Data are presented as means ± SEMs from indicated samples. **p < 0.01 and *p<0.05 indicates statistical significance
Fig. 3
Fig. 3
Association between m6A and ENO1 and the link with clinical outcome. (A) Venn diagram of proteomics showing candidates that were elevated in LUAD and upregulated by m6A. (B) ENO family expression and m6A levels in H1975 and H1299 cells with indicated treatment, as measured by IB and dot blot, respectively. (C) ENO1 activity in H1975 and H1299 cells with different treatments, as indicated. (D) Correlation between global m6A and ENO1 in LUAD. (E) The percentage of LUAD expressing different levels of ENO1 in those with different tumor/adjacent global m6A ratios. (F-H) IHC (F), heatmap (G) and IB (H) showing Eno1 expression in spontaneous LUAD from indicated KP-based mice. In panel G, the average levels of Eno1 in 20 fields of view are shown. Scale bar, 100 μm. (I-J) The percentage of patients at different stages in cohort #1 with different levels of global m6A (I) and ENO1 (J). (L-M) Overall survival of LUAD patients with high and low levels of ENO1, as analyzed from the data from Kaplan-Meier Plotter database (L) and our own (M) by log-rank test. Statistical analysis was performed using one-way ANOVA (C) and Chi-squared test (E, I, J). Data are presented as means ± SEMs from three independent experiments (C). **p < 0.01 indicates statistical significance
Fig. 4
Fig. 4
M6A-dependent regulation of glycolysis and 3D-spheroid formation via ENO1.Schematic representation of glycolysis processes. (B-E) The 2-PGA (B), PEP (C), Pyruvate (D) and ATP (E) levels in LUAD tissues with low or high global m6A levels. (F-H) ENO1 activity (F), PEP (F), glucose uptake (F), lactate production (F), ATP (F), ECAR (G) and OCR (H) in the presence or absence of METTL3 knockout and ALKBH5 overexpression, with or without ENO1 compensation in H1975 cells, as indicated. (I-K) ENO1 activity (I), PEP (I), glucose uptake (I), lactate production (I), ATP (I), ECAR (J) and OCR (K) in control and ENO1-/- H1299 cells with or without ALKBH5 knockout and METTL3 overexpression. (L) 3D-spheroid formation that generated from H1975 cells with or without METTL3 knockout and ALKBH5 overexpression, in the presence or absence of compensation for ENO1. Scale bar, 100 μm. (M) 3D-spheroid formation that generated from control and ENO1-/-H1299 cells with or without ALKBH5 knockout and METTL3 overexpression. Scale bar, 100 μm. Statistical analysis was performed using t test (B-E), one-way ANOVA (F, I, L, M) and two-way ANOVA (G, H, J, K). Data are presented as means ± SEMs from indicated samples or three independent experiments. **p < 0.01 indicates statistical significance and N.S. indicates no significance
Fig. 5
Fig. 5
M6A methylation of ENO1 mRNA was critical for its translation and glycolysis.(A) Representative IB images of ENO1 in H1650 and H1975 cells treated with DMSO or DAA (100 μM, 24h). (B) Polysome profiling in H1975 cells with or without combined METTL3 knockout and ALKBH5 overexpression. (C) Ribosome-associated ENO1 mRNA in H1975 cells with or without combined METTL3 knockout and ALKBH5 overexpression. (D) Polysome profiling in H1299 cells with or without combined ALKBH5 knockout and METTL3 overexpression. (E) Ribosome-associated ENO1 mRNA in H1299 cells with or without combined ALKBH5 knockout and METTL3 overexpression. (F) Prediction and verification of potential m6A sites within ENO1 mRNA, as predicted by SRAMP online software and verified by RIP experiments using anti-m6A antibodies. (G) ENO1 protein expression and translation efficiency in ENO1-/- H1299 cells that reconstituted with WT or Mut ENO1 (359A to 359G), with or without combined ALKBH5 knockout and METTL3 overexpression. (H) Schematic presentation of the construction of the pmir-GLO-ENO1 reporter containing ENO1 partialORF region with or without 359A mutation. (I) Translation efficiency of ENO1-LUC fusion mRNA, as calculated by the ratios between luciferase activities and mRNA levels in H1299 cells with or without combined ALKBH5 knockout and METTL3 overexpression. (J-L) ENO1 activity (J), PEP (J), glucose uptake (J), lactate production (J), ATP (J), ECAR (K) and OCR (L) in ENO1-/- H1299 cells reconstituted with WT or Mut ENO1 (359A to 359G), with or without combined ALKBH5 knockout and METTL3 overexpression. (M-O) Representative images (M), number (N) and size (O) of 3D-spheroids that generated by ENO1-/- H1299 cells reconstituted with WT or Mut ENO1 (359A to 359G), with or without combined ALKBH5 knockout and METTL3 overexpression. Scale bar, 100 μm. Statistical analysis was performed using t test (C, E), one-way ANOVA (G, I, J, N, O) and two-way ANOVA (K, L). Data are presented as means ± SEMs from three independent experiments. **p < 0.01, *p<0.05 indicates statistical significance and N.S. indicates no significance
Fig. 6
Fig. 6
M6A reader YTHDF1 was essential for m6A to stimulate ENO1 translation and function.(A) Association of m6A readers, as indicated, with ENO1 partial ORF region with or without artificially m6A-methylated 359A, as measured by IB following RNA pull-down experiment. (B) YTHDF1 interaction with ENO1 mRNA, as measured by PAR-CLIP experiment using anti-HA antibodies in H1299 cells expressing HA-tagged YTHDF1 with or without YTH-domain, and treated with or without combined ALKBH5 knockout and METTL3 overexpression. RNA labeled with biotin was visualized by the chemiluminescent nucleic acid detection module. ENO1 mRNA levels in the pulled down products were verified by qPCR. (C) Association between YTHDF1 and ENO1 mRNA in H1975 cells with or without combined METTL3 knockout and ALKBH5 overexpression, and in H1299 cells with or without combined ALKBH5 knockout and METTL3 overexpression, as measured by RIP experiments using anti-YTHDF1 and IgG antibodies. (D) Translation efficiency of ENO1-LUC fusion mRNA in H1975 cells transfected with WT or Mut pmir-GLO-ENO1 reporter, and overexpressed with or without YTHDF1. (E) Translation efficiency of ENO1-LUC fusion mRNA in WT and YTHDF1-KO H1299 cells with or without combined ALKBH5 knockout and METTL3 overexpression. (F-G) Polysome-associated ENO1 mRNA (F) and translation efficiency of endogenous ENO1 mRNA (G) in WT and YTHDF1-KO H1299 cells with or without combined ALKBH5 knockout and METTL3 overexpression. (H) The recruitment of EIF3E at ENO1 mRNA in H1975 cells with or without YTHDF1 overexpression, as measured by RIP using anti-EIF3E and control IgG antibodies. (I-J) ENO1 activity (I), PEP (I), glucose uptake (I), lactate production (I), ATP (I), ECAR (J) and OCR (J) in WT and YTHDF1-KO H1299 cells with or without combined ALKBH5 knockout and METTL3 overexpression. (K-M) Representative images (K), numbers (L) and size (M) of 3D-spheroids that generated by WT and YTHDF1-KO H1299 cells with or without combined ALKBH5 knockout and METTL3 overexpression. Scale bar, 100 μm. Statistical analysis was performed using t test (B, C, H), one-way ANOVA (D-G, I, L, M) and two-way ANOVA (J). Data are presented as means ± SEMs from three independent experiments. **p < 0.01, *p<0.05 indicates statistical significance and N.S. indicates no significance
Fig. 7
Fig. 7
Clinical and translation significance of the study.(A-B) ENO1 and YTHDF1 protein expression in adjacent and matched-tumor tissues from LUAD patients of cohort #1 (n=192). (C-E) Correlations between METTL3 and ENO1 (C), ENO1 and global m6A (D), and between ALKBH5 and ENO1 (E) in cohort #1. The protein and m6A levels were calculated as the ratios between that from tumor and matched-adjacent tissues. (F-J) ENO1 (F), YTHDF1 (G), METTL3 (H), global m6A level (I) and ALKBH5 (J) in LUAD with indicated tumor stages from cohort #3 (n=20/group). (K-M) CDX that generated by H1299 cells with or without combined ALKBH5 knockout and METTL3 overexpression followed by administrating mice with DMSO, DAA (50mg/kg), 2DG (1000mg/kg) or ENOblock (20mg/kg). The global m6A levels (K), representative images of xenografts (K), tumor volume (L) and mice weights (M) were graphed and shown (n=6/group). Scale bar, 1cm. (N-P) PDX mice models with high and low global m6A levels were administrated with DMSO, DAA (50mg/kg), 2DG (1000mg/kg) or ENOblock (20mg/kg). The global m6A levels (N), representative images of xenografts (N), tumor volume (O) and mice weight (P) were graphed and shown. (n=6/group). Scale bar, 1cm. (Q-R) Representative H&E images of spontaneous LUAD in KPE mice following being infected with AVV5 expressing Cre and administrated with DMSO, DAA (25mg/kg), 2-DG (500mg/kg) or ENOblock (10mg/kg), as indicated (Q). The overall survival curves for KPE mice with established LUAD following drug administration are also shown in panel P R (n=6/group). Statistical analysis was performed using t test (A, B, K, N), spearman rank-correlation analysis (C-E), one-way ANOVA (F-J, M, P), two-way ANOVA (L, O) and log-rank tests (R). Data are presented as means ± SEMs from indicated samples. **p < 0.01 indicates statistical significance and N.S. indicates no significance
Fig. 8
Fig. 8
Schematic presentation of the study.Briefly, elevated-global m6A levels that determined by upregulated-METTL3 and downregulated-ALKBH5 facilitate m6A methylation of mRNA, such as ENO1 in LUAD. M6A reader YTHDF1 is prone to interact with m6A-methylated ENO1 mRNA, by which leads to a stimulation of ENO1 translation. Increased ENO1 in turn causes reinforcement in glycolysis and tumor growth in LUAD

References

    1. Sung H, Ferlay J, Siegel RL, Laversanne M, Soerjomataram I, Jemal A, et al. Global Cancer Statistics 2020: GLOBOCAN Estimates of Incidence and Mortality Worldwide for 36 Cancers in 185 Countries. CA Cancer J Clin. 2021;71:209–49. - PubMed
    1. Wang L, Li X, Ren Y, Geng H, Zhang Q, Cao L, et al. Cancer-associated fibroblasts contribute to cisplatin resistance by modulating ANXA3 in lung cancer cells. Cancer Sci. 2019;110:1609–20. - PMC - PubMed
    1. Li R, Liu J, Fang Z, Liang Z, Chen X. Identification of Mutations Related to Cisplatin-Resistance and Prognosis of Patients With Lung Adenocarcinoma. Front Pharmacol. 2020;11:572627. - PMC - PubMed
    1. Huang H, Weng H, Chen J. The Biogenesis and Precise Control of RNA m(6)A Methylation. Trends Genet. 2020;36:44–52. - PMC - PubMed
    1. Wang M, Liu J, Zhao Y, He R, Xu X, Guo X, et al. Upregulation of METTL14 mediates the elevation of PERP mRNA N(6) adenosine methylation promoting the growth and metastasis of pancreatic cancer. Mol Cancer. 2020;19:130. - PMC - PubMed