. 2022 Apr 1;12(4):1002-1021.
doi: 10.1158/2159-8290.CD-21-0910.

Targeting S100A9-ALDH1A1-Retinoic Acid Signaling to Suppress Brain Relapse in EGFR-Mutant Lung Cancer

Affiliations

Targeting S100A9-ALDH1A1-Retinoic Acid Signaling to Suppress Brain Relapse in EGFR-Mutant Lung Cancer

Anup Kumar Biswas et al. Cancer Discov. .

Abstract

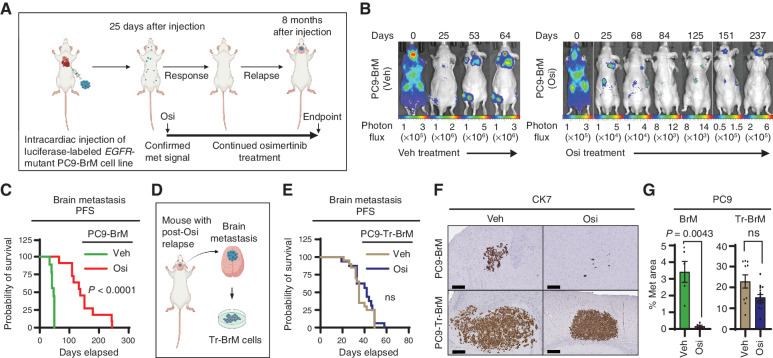
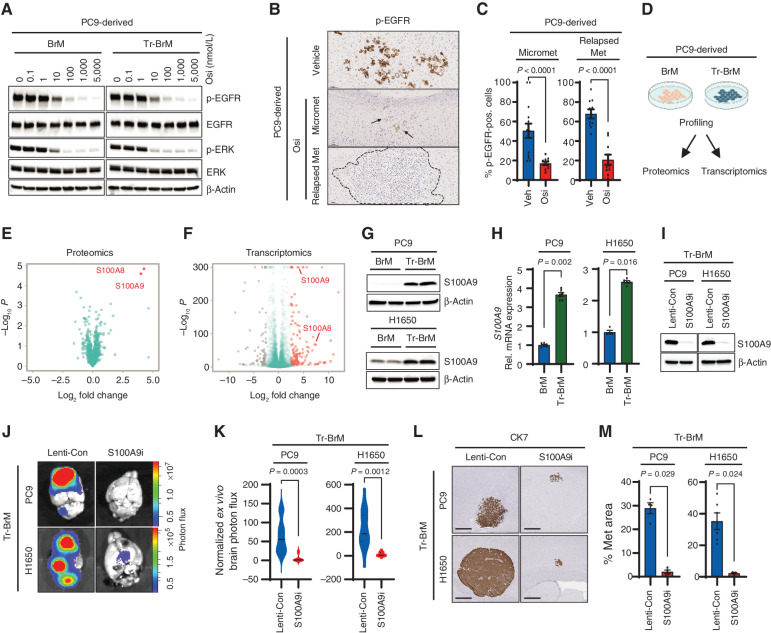
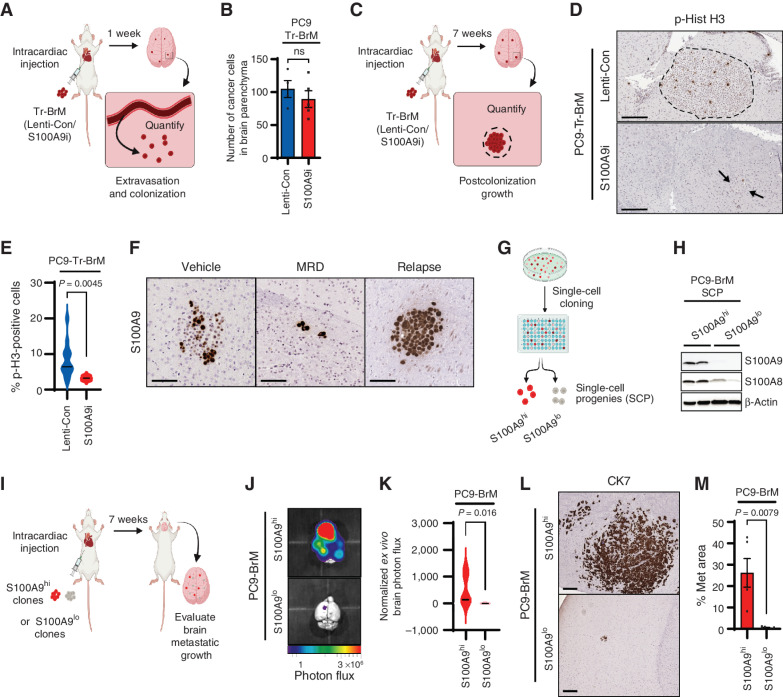
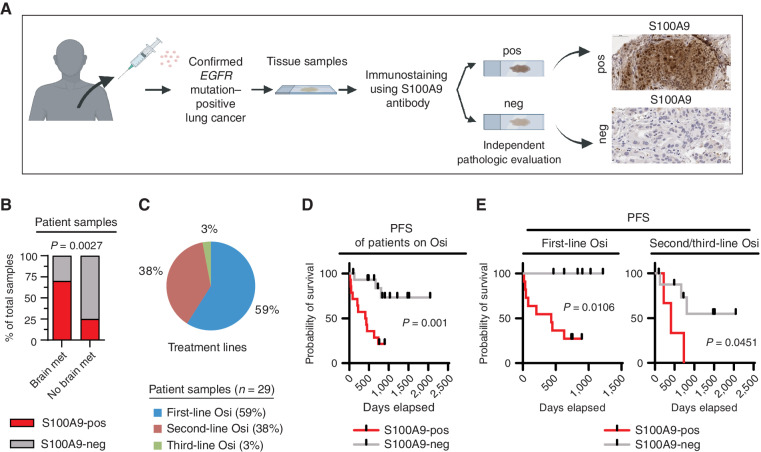
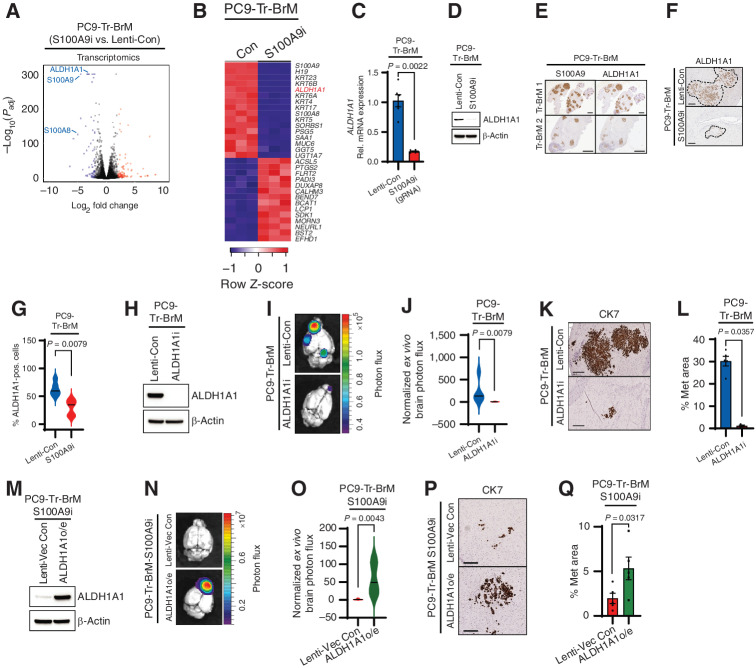
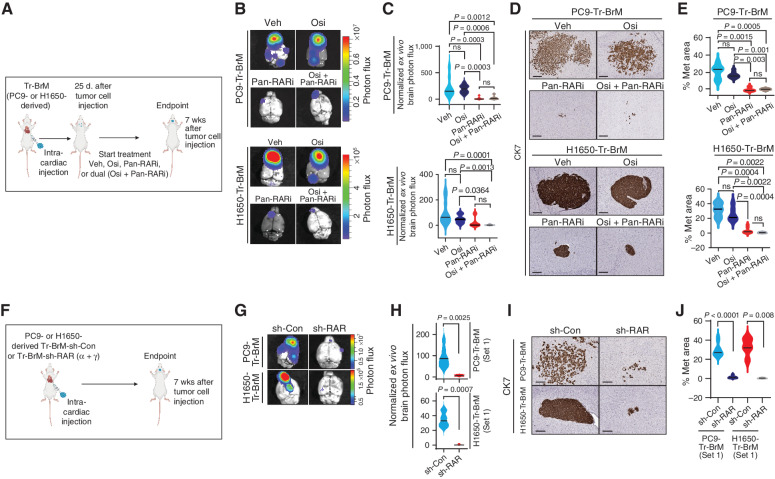
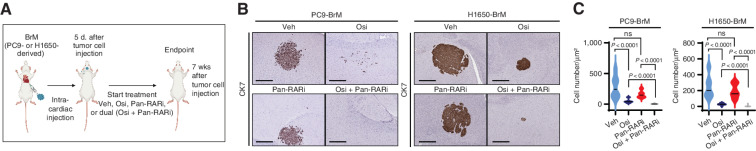
The epidermal growth factor receptor (EGFR) tyrosine kinase inhibitor (TKI) osimertinib has significantly prolonged progression-free survival (PFS) in patients with EGFR-mutant lung cancer, including those with brain metastases. However, despite striking initial responses, osimertinib-treated patients eventually develop lethal metastatic relapse, often to the brain. Although osimertinib-refractory brain relapse is a major clinical challenge, its underlying mechanisms remain poorly understood. Using metastatic models of EGFR-mutant lung cancer, we show that cancer cells expressing high intracellular S100A9 escape osimertinib and initiate brain relapses. Mechanistically, S100A9 upregulates ALDH1A1 expression and activates the retinoic acid (RA) signaling pathway in osimertinib-refractory cancer cells. We demonstrate that the genetic repression of S100A9, ALDH1A1, or RA receptors (RAR) in cancer cells, or treatment with a pan-RAR antagonist, dramatically reduces brain metastasis. Importantly, S100A9 expression in cancer cells correlates with poor PFS in osimertinib-treated patients. Our study, therefore, identifies a novel, therapeutically targetable S100A9-ALDH1A1-RA axis that drives brain relapse.

Significance: Treatment with the EGFR TKI osimertinib prolongs the survival of patients with EGFR-mutant lung cancer; however, patients develop metastatic relapses, often to the brain. We identified a novel intracellular S100A9-ALDH1A1-RA signaling pathway that drives lethal brain relapse and can be targeted by pan-RAR antagonists to prevent cancer progression and prolong patient survival. This article is highlighted in the In This Issue feature, p. 873.


Figures

Figure 1. Fatal brain relapse in the osimertinib-treated, PC9-derived metastatic lung cancer mouse model. A, Schematic representation of the in vivo treatment model derived from the PC9-BrM cell line for metastatic EGFR-mutant lung cancer. Luciferase-labeled human EGFR-mutant PC9-BrM cells were injected into the arterial circulation of immunodeficient mice via intracardiac injection to generate metastases, which were detected by bioluminescence imaging. At 25 days after tumor cell injection, after confirmation of metastatic (met) signal, mice were administered long-term treatment with either vehicle or osimertinib (Osi) at 5 mg/kg body weight/day by oral gavage 5 days per week until the endpoint indicated in B and C, which averaged to 8 months after tumor cell injection. Periods of response to osimertinib and subsequent relapse were detected by bioluminescence imaging. B, Representative images for longitudinal monitoring of metastatic progression with vehicle (Veh) or osimertinib treatment by weekly bioluminescence imaging, with progressive development of osimertinib-refractory brain relapse in mice. Vehicle-treated mice developed bone, brain, and lymph node metastases and were euthanized when weight loss was >20% or when the body-conditioning score (BCS) reached 2. Osimertinib-treated mice were monitored for the emergence and progression of osimertinib-refractory metastasis in the brain and euthanized when either weight loss was >20%, the BCS reached 2, or mice developed paralysis or seizure-like symptoms due to brain metastasis. Days represent days after initial tumor cell injection. Photon-flux scales are indicated below the images. C, Kaplan–Meier plot for brain metastasis PFS of mice from the experiment described in A and B. Data were analyzed using the log-rank test: χ2  =  19.33, degrees of freedom (d.f.)  =  1, P < 0.0001, n = 10 for vehicle-treated mice and 10 for osimertinib-treated mice. D, Schematic representation of the experimental design to derive osimertinib treatment–refractory Tr-BrM cells from relapsed brain metastases from the mice described in A–C that were injected with PC9-BrM cells and treated long-term with osimertinib. E, Kaplan–Meier plot for brain metastasis PFS of mice injected with PC9-Tr-BrM cells followed by treatment with either vehicle or osimertinib. Data were analyzed using the log-rank test: χ2  =  1.325, d.f.  =  1, P value not significant (ns), n = 20 for vehicle-treated mice and 17 for osimertinib-treated mice. F, Representative images of human CK7 IHC on brain sections from mice injected with either PC9-BrM cells (top) or PC9-Tr-BrM cells (bottom) and treated with either vehicle (left) or osimertinib (right). Mice were euthanized at 7 weeks after tumor cell injection. Scale bars, 200 μm. G, Quantitative analysis of the percentage of CK7-immunostained brain sections covered by metastasis that are represented in F. Data are presented as mean values ± SEM. P values were determined by a two-tailed, unpaired Mann–Whitney test: n = 10 for vehicle-treated mice bearing PC9-BrM or PC9-Tr-BrM metastases and n = 11 for osimertinib-treated mice bearing PC9-BrM or PC9-Tr-BrM metastases.
Figure 1.
Fatal brain relapse in the osimertinib-treated, PC9-derived metastatic lung cancer mouse model. A, Schematic representation of the in vivo treatment model derived from the PC9-BrM cell line for metastatic EGFR-mutant lung cancer. Luciferase-labeled human EGFR-mutant PC9-BrM cells were injected into the arterial circulation of immunodeficient mice via intracardiac injection to generate metastases, which were detected by bioluminescence imaging. At 25 days after tumor cell injection, after confirmation of metastatic (met) signal, mice were administered long-term treatment with either vehicle or osimertinib (Osi) at 5 mg/kg body weight/day by oral gavage 5 days per week until the endpoint indicated in B and C, which averaged to 8 months after tumor cell injection. Periods of response to osimertinib and subsequent relapse were detected by bioluminescence imaging. B, Representative images for longitudinal monitoring of metastatic progression with vehicle (Veh) or osimertinib treatment by weekly bioluminescence imaging, with progressive development of osimertinib-refractory brain relapse in mice. Vehicle-treated mice developed bone, brain, and lymph node metastases and were euthanized when weight loss was >20% or when the body-conditioning score (BCS) reached 2. Osimertinib-treated mice were monitored for the emergence and progression of osimertinib-refractory metastasis in the brain and euthanized when either weight loss was >20%, the BCS reached 2, or mice developed paralysis or seizure-like symptoms due to brain metastasis. Days represent days after initial tumor cell injection. Photon-flux scales are indicated below the images. C, Kaplan–Meier plot for brain metastasis PFS of mice from the experiment described in A and B. Data were analyzed using the log-rank test: χ2  =  19.33, degrees of freedom (d.f.)  =  1, P < 0.0001, n = 10 for vehicle-treated mice and 10 for osimertinib-treated mice. D, Schematic representation of the experimental design to derive osimertinib treatment–refractory Tr-BrM cells from relapsed brain metastases from the mice described in A–C that were injected with PC9-BrM cells and treated long-term with osimertinib. E, Kaplan–Meier plot for brain metastasis PFS of mice injected with PC9-Tr-BrM cells followed by treatment with either vehicle or osimertinib. Data were analyzed using the log-rank test: χ2  =  1.325, d.f.  =  1, P value not significant (ns), n = 20 for vehicle-treated mice and 17 for osimertinib-treated mice. F, Representative images of human CK7 IHC on brain sections from mice injected with either PC9-BrM cells (top) or PC9-Tr-BrM cells (bottom) and treated with either vehicle (left) or osimertinib (right). Mice were euthanized at 7 weeks after tumor cell injection. Scale bars, 200 μm. G, Quantitative analysis of the percentage of CK7-immunostained brain sections covered by metastasis that are represented in F. Data are presented as mean values ± SEM. P values were determined by a two-tailed, unpaired Mann–Whitney test: n = 10 for vehicle-treated mice bearing PC9-BrM or PC9-Tr-BrM metastases and n = 11 for osimertinib-treated mice bearing PC9-BrM or PC9-Tr-BrM metastases.
Figure 2. S100A9 is a key mediator of brain relapse in osimertinib-refractory lung cancer cells. A, Immunoblot analysis for inhibition of EGFR pathway activation in PC9-BrM and PC9-Tr-BrM cells treated with the indicated doses of osimertinib (Osi) and collected 6 hours after treatment. Antibodies against phospho-EGFR (Tyr1068), phospho-ERK (Thr202/Tyr204), total EGFR, total ERK, and β-actin (loading control) were used. Data are representative of three independent experiments. B, Brain sections from mice injected with PC9-BrM cells described in Fig. 1A and B were immunostained using an antibody against phospho-EGFR. PC9-BrM cells were injected into the arterial circulation of immunodeficient mice via intracardiac injection to generate metastases. Treatment was administered starting 25 days after tumor cell injection with either vehicle or osimertinib at 5 mg/kg body weight/day by oral gavage 5 days per week and continued until endpoint. The endpoint for vehicle-treated mice was 2 months after tumor cell injection (Vehicle). The endpoint for osimertinib-treated mice was 4 months after tumor cell injection for micrometastases (Micromet) and 8 months after tumor cell injection for relapsed metastatic lesion (Relapsed Met). For the osimertinib treatment group, mice were administered osimertinib by oral gavage. At 6 hours after treatment, mice were euthanized, and brain tissues were subsequently processed for histologic analysis. Representative images of IHC staining for phospho-EGFR in brain sections are shown. Arrows point to and dotted line surrounds the location of metastatic cells in the brain. Scale bars, 100 μm. C, The p-EGFR–immunostained brain sections described in B were quantitated using automated QuPath software to count p-EGFR–positive (pos.) cancer cells that were identified by setting a threshold for signal intensity (1+). Data are presented as mean values ± SEM. P values (indicated in the figures) were determined by a two-tailed, unpaired Mann–Whitney test: n = 10 for vehicle-treated mice, 14 for osimertinib-treated mice with micrometastases, and 10 for osimertinib-treated mice with relapsed metastases. Veh, vehicle. D, Schematic representation of the strategies used to compare PC9-BrM and PC9-Tr-BrM cells for differentially expressed proteins by quantitative label-free mass spectrometry and for differentially expressed genes by transcriptomics. E, Volcano plot shows the differentially expressed proteins between PC9-Tr-BrM and PC9-BrM cells identified by quantitative label-free mass spectrometry. Proteins with higher abundance in PC9-Tr-BrM cells compared with PC9-BrM cells have log2 fold changes with positive values and are labeled in red. N = 3 replicates per group. Data points referring to the top significantly differentially expressed proteins (S100A9 and S100A8) are labeled. F, Volcano plot of RNA-seq–based transcriptomic analysis shows the differentially expressed genes between PC9-Tr-BrM cells and PC9-BrM cells. Genes with significantly higher expression in PC9-Tr-BrM cells compared with PC9-BrM cells have log2 fold changes with positive values and are depicted in red. Genes with significantly lower expression in PC9-Tr-BrM cells compared with PC9-BrM cells have log2 fold changes with negative values and are depicted in gray. N = 3 replicates per group. Data points referring to the top significantly differentially expressed genes (S100A9 and S100A8) are labeled. G, Immunoblot analyses of lysates from BrM and Tr-BrM cells from both PC9- and H1650-derived models using antibodies against S100A9 and β-actin (loading control). The data are representative of three independent experiments. H, S100A9 expression was determined by qRT--PCR analysis of PC9- and H1650-derived BrM and Tr-BrM cells. GAPDH was measured as an internal control. Data are presented as mean values ± SEM. P values were determined by a two-tailed, unpaired Mann–Whitney test: n = 6 for PC9-BrM, n = 6 for PC9-Tr-BrM, n = 4 for H1650-BrM, and n = 5 for H1650-Tr-BrM. Rel., relative. I, Immunoblot analyses of lysates from PC9- and H1650-derived Tr-BrM cells infected with viruses expressing either a control gRNA (Lenti-Con) or an S100A9-specific gRNA (referred to as “S100A9i” throughout the figures). The indicated antibodies were used to confirm the loss of S100A9 protein expression following CRISPR/dCas9-mediated gene repression. β-Actin served as a protein loading control. Data are representative of three independent experiments. Figure 2. (Continued) J, Ex vivo photon flux of brains from mice injected with PC9- or H1650-derived Tr-BrM cells expressing either Lenti-Con or S100A9i was determined by bioluminescence imaging. Mice were collected at 7 weeks after tumor cell injection. The photon-flux scale is indicated on the right side. K, Violin plots depicting normalized photon flux of brains imaged ex vivo from the mice described in J. The normalized photon flux for brain tissue was calculated by dividing the photon flux from brain collected ex vivo by the total photon flux at day 0 (i.e., the day of injection) and multiplying that value by 100. Data are presented as mean values ± SEM. P values were determined by a two--tailed, unpaired Mann–Whitney test. For PC9 Tr-BrM, n = 10 for Lenti-Con and n = 9 for S100A9i. For H1650-Tr-BrM, n = 6 for Lenti-Con and n = 7 for S100A9i. L, Representative images of CK7 IHC on brain sections from mice injected with either PC9-derived Tr-BrM Lenti-Con–expressing (left) or S100A9i-expressing (right) cells in the top row, or H1650-derived Tr-BrM Lenti-Con–expressing (left) or S100A9i-expressing (right) cells in the bottom row. Brains were harvested from mice 7 weeks after tumor cell injection. Scale bars, 500 μm. M, Quantitative analysis of the percentage of brain sections covered by metastasis from the experiment described in L. Data are presented as mean values ± SEM. P values were determined by a two-tailed, unpaired Mann–Whitney test. For PC9-Tr-BrM, n = 4 for Lenti-Con and n = 4 for S100A9i. For H1650-Tr-BrM, n = 6 for Lenti-Con and n = 3 for S100A9i.
Figure 2.
S100A9 is a key mediator of brain relapse in osimertinib-refractory lung cancer cells. A, Immunoblot analysis for inhibition of EGFR pathway activation in PC9-BrM and PC9-Tr-BrM cells treated with the indicated doses of osimertinib (Osi) and collected 6 hours after treatment. Antibodies against phospho-EGFR (Tyr1068), phospho-ERK (Thr202/Tyr204), total EGFR, total ERK, and β-actin (loading control) were used. Data are representative of three independent experiments. B, Brain sections from mice injected with PC9-BrM cells described in Fig. 1A and B were immunostained using an antibody against phospho-EGFR. PC9-BrM cells were injected into the arterial circulation of immunodeficient mice via intracardiac injection to generate metastases. Treatment was administered starting 25 days after tumor cell injection with either vehicle or osimertinib at 5 mg/kg body weight/day by oral gavage 5 days per week and continued until endpoint. The endpoint for vehicle-treated mice was 2 months after tumor cell injection (Vehicle). The endpoint for osimertinib-treated mice was 4 months after tumor cell injection for micrometastases (Micromet) and 8 months after tumor cell injection for relapsed metastatic lesion (Relapsed Met). For the osimertinib treatment group, mice were administered osimertinib by oral gavage. At 6 hours after treatment, mice were euthanized, and brain tissues were subsequently processed for histologic analysis. Representative images of IHC staining for phospho-EGFR in brain sections are shown. Arrows point to and dotted line surrounds the location of metastatic cells in the brain. Scale bars, 100 μm. C, The p-EGFR–immunostained brain sections described in B were quantitated using automated QuPath software to count p-EGFR–positive (pos.) cancer cells that were identified by setting a threshold for signal intensity (1+). Data are presented as mean values ± SEM. P values (indicated in the figures) were determined by a two-tailed, unpaired Mann–Whitney test: n = 10 for vehicle-treated mice, 14 for osimertinib-treated mice with micrometastases, and 10 for osimertinib-treated mice with relapsed metastases. Veh, vehicle. D, Schematic representation of the strategies used to compare PC9-BrM and PC9-Tr-BrM cells for differentially expressed proteins by quantitative label-free mass spectrometry and for differentially expressed genes by transcriptomics. E, Volcano plot shows the differentially expressed proteins between PC9-Tr-BrM and PC9-BrM cells identified by quantitative label-free mass spectrometry. Proteins with higher abundance in PC9-Tr-BrM cells compared with PC9-BrM cells have log2 fold changes with positive values and are labeled in red. N = 3 replicates per group. Data points referring to the top significantly differentially expressed proteins (S100A9 and S100A8) are labeled. F, Volcano plot of RNA-seq–based transcriptomic analysis shows the differentially expressed genes between PC9-Tr-BrM cells and PC9-BrM cells. Genes with significantly higher expression in PC9-Tr-BrM cells compared with PC9-BrM cells have log2 fold changes with positive values and are depicted in red. Genes with significantly lower expression in PC9-Tr-BrM cells compared with PC9-BrM cells have log2 fold changes with negative values and are depicted in gray. N = 3 replicates per group. Data points referring to the top significantly differentially expressed genes (S100A9 and S100A8) are labeled. G, Immunoblot analyses of lysates from BrM and Tr-BrM cells from both PC9- and H1650-derived models using antibodies against S100A9 and β-actin (loading control). The data are representative of three independent experiments. H, S100A9 expression was determined by qRT--PCR analysis of PC9- and H1650-derived BrM and Tr-BrM cells. GAPDH was measured as an internal control. Data are presented as mean values ± SEM. P values were determined by a two-tailed, unpaired Mann–Whitney test: n = 6 for PC9-BrM, n = 6 for PC9-Tr-BrM, n = 4 for H1650-BrM, and n = 5 for H1650-Tr-BrM. Rel., relative. I, Immunoblot analyses of lysates from PC9- and H1650-derived Tr-BrM cells infected with viruses expressing either a control gRNA (Lenti-Con) or an S100A9-specific gRNA (referred to as “S100A9i” throughout the figures). The indicated antibodies were used to confirm the loss of S100A9 protein expression following CRISPR/dCas9-mediated gene repression. β-Actin served as a protein loading control. Data are representative of three independent experiments. J,Ex vivo photon flux of brains from mice injected with PC9- or H1650-derived Tr-BrM cells expressing either Lenti-Con or S100A9i was determined by bioluminescence imaging. Mice were collected at 7 weeks after tumor cell injection. The photon-flux scale is indicated on the right side. K, Violin plots depicting normalized photon flux of brains imaged ex vivo from the mice described in J. The normalized photon flux for brain tissue was calculated by dividing the photon flux from brain collected ex vivo by the total photon flux at day 0 (i.e., the day of injection) and multiplying that value by 100. Data are presented as mean values ± SEM. P values were determined by a two--tailed, unpaired Mann–Whitney test. For PC9 Tr-BrM, n = 10 for Lenti-Con and n = 9 for S100A9i. For H1650-Tr-BrM, n = 6 for Lenti-Con and n = 7 for S100A9i. L, Representative images of CK7 IHC on brain sections from mice injected with either PC9-derived Tr-BrM Lenti-Con–expressing (left) or S100A9i-expressing (right) cells in the top row, or H1650-derived Tr-BrM Lenti-Con–expressing (left) or S100A9i-expressing (right) cells in the bottom row. Brains were harvested from mice 7 weeks after tumor cell injection. Scale bars, 500 μm. M, Quantitative analysis of the percentage of brain sections covered by metastasis from the experiment described in L. Data are presented as mean values ± SEM. P values were determined by a two-tailed, unpaired Mann–Whitney test. For PC9-Tr-BrM, n = 4 for Lenti-Con and n = 4 for S100A9i. For H1650-Tr-BrM, n = 6 for Lenti-Con and n = 3 for S100A9i.
Figure 3. S100A9-proficient cells promote postcolonization growth in the brain. A, Schematic representation of the experimental design to quantify seeding in the brain. PC9-Tr-BrM cells expressing either lenti-control (Lenti-Con) or S100A9i were injected into the arterial circulation of immunodeficient mice via intracardiac injection. Seven days later, brains were isolated, sectioned, and analyzed by IHC for human CK7. CK7-immunostained cancer cells were then counted to compare seeding of cancer cells in the brain parenchyma between experimental groups. B, Quantitative analysis of the experiment described in A. Tumor cells were counted in 10 sections of 20 μm each per brain. Data are presented as mean values ± SEM. The P value was determined by a two--tailed, unpaired Mann–Whitney test. N = 4 for Lenti-Con; n = 5 for S100A9i. ns, P value not significant. C, Schematic representation of the experimental design to analyze postcolonization growth in the brain. PC9-Tr-BrM cells expressing either Lenti-Con or S100A9i were injected into the arterial circulation of immunodeficient mice via intracardiac injection. At 7 weeks after injection, brain tissues were collected, and sections were analyzed by immunostaining for phospho-histone H3 (Ser10) to compare the number of mitotically active cancer cells between the experimental groups. D, Representative images of phospho-histone H3 (p-Hist H3) IHC on brain sections from the experiment described in C. Arrows point to and dotted line surrounds the location of metastatic cells in the brain. Scale bars, 100 μm. E, Quantitative analysis of the phospho-histone H3–positive cells within brain sections from the experiment described in C and represented in D. Immunostained sections were counted using the QuPath software, where positively stained cells are identified by setting a threshold for signal intensity (3+). Data are presented as mean values ± SEM. P values were determined by a two-tailed, unpaired Mann–Whitney test: n = 12 for Lenti-Con and n = 6 for S100A9i. F, Representative images of brain sections stained with an antibody against human S100A9. PC9-BrM cells were injected into the arterial circulation of immunodeficient mice via intracardiac injection. After metastatic signal was detected by bioluminescence imaging, treatment was started 25 days after tumor cell injection with either vehicle or osimertinib at 5 mg/kg body weight/day by oral gavage 5 days per week. Brain tissues were collected 2 months after tumor cell injection in the vehicle treatment group (Vehicle) 3 months after tumor cell injection in the osimertinib treatment group (minimal residual disease, or MRD) and 8 months after tumor cell injection in the osimertinib-treated relapse group (Relapse). Scale bars, 100 μm. Data are representative of 10 mice/group analyzed at each time point. G, Schematic representation of single-cell cloning from PC9-BrM cells. S100A9 high- and low-expressing single-cell progenies (SCP) are labeled as S100A9hi and S100A9lo, respectively. H, Immunoblot analysis of lysates from PC9-BrM–derived SCPs using antibodies against S100A8, S100A9, and β-actin (loading control). The data are representative of three independent experiments. I, Schematic representation of the brain metastasis assay to compare the ability of S100A9hi and S100A9lo SCPs to grow in the brain and generate metastases. J, Ex vivo photon flux of brains from mice injected with PC9-BrM–derived S100A9hi and S100A9lo SCPs was determined by bioluminescence imaging. Brains were collected from mice 7 weeks after tumor cell injection. Photon-flux scale is indicated below the images. K, Violin plots depicting normalized photon flux of brains imaged ex vivo from mice described in J. The normalized photon flux for brain tissue was calculated by dividing the photon flux from brain collected ex vivo by the total photon flux at day 0 (i.e., the day of injection) and multiplying that value by 100. Data are presented as mean values ± SEM. P values were determined by a two--tailed, unpaired Mann–Whitney test. N = 5 for S100A9hi; n = 4 for S100A9lo. L, Representative images of CK7 IHC on brain sections from mice injected with PC9-BrM–derived S100A9hi and S100A9lo SCPs. Brains were harvested from mice 7 weeks after tumor cell injection. Scale bars, 200 μm. M, Quantitative analysis of the percentage of CK7-immunostained brain sections covered by metastasis (Met area) in the experiment described in L. Data are presented as mean values ± SEM. P values were determined by a two-tailed, unpaired Mann–Whitney test: n = 5 for S100A9hi and n = 5 for S100A9lo.
Figure 3.
S100A9-proficient cells promote postcolonization growth in the brain. A, Schematic representation of the experimental design to quantify seeding in the brain. PC9-Tr-BrM cells expressing either lenti-control (Lenti-Con) or S100A9i were injected into the arterial circulation of immunodeficient mice via intracardiac injection. Seven days later, brains were isolated, sectioned, and analyzed by IHC for human CK7. CK7-immunostained cancer cells were then counted to compare seeding of cancer cells in the brain parenchyma between experimental groups. B, Quantitative analysis of the experiment described in A. Tumor cells were counted in 10 sections of 20 μm each per brain. Data are presented as mean values ± SEM. The P value was determined by a two--tailed, unpaired Mann–Whitney test. N = 4 for Lenti-Con; n = 5 for S100A9i. ns, P value not significant. C, Schematic representation of the experimental design to analyze postcolonization growth in the brain. PC9-Tr-BrM cells expressing either Lenti-Con or S100A9i were injected into the arterial circulation of immunodeficient mice via intracardiac injection. At 7 weeks after injection, brain tissues were collected, and sections were analyzed by immunostaining for phospho-histone H3 (Ser10) to compare the number of mitotically active cancer cells between the experimental groups. D, Representative images of phospho-histone H3 (p-Hist H3) IHC on brain sections from the experiment described in C. Arrows point to and dotted line surrounds the location of metastatic cells in the brain. Scale bars, 100 μm. E, Quantitative analysis of the phospho-histone H3–positive cells within brain sections from the experiment described in C and represented in D. Immunostained sections were counted using the QuPath software, where positively stained cells are identified by setting a threshold for signal intensity (3+). Data are presented as mean values ± SEM. P values were determined by a two-tailed, unpaired Mann–Whitney test: n = 12 for Lenti-Con and n = 6 for S100A9i. F, Representative images of brain sections stained with an antibody against human S100A9. PC9-BrM cells were injected into the arterial circulation of immunodeficient mice via intracardiac injection. After metastatic signal was detected by bioluminescence imaging, treatment was started 25 days after tumor cell injection with either vehicle or osimertinib at 5 mg/kg body weight/day by oral gavage 5 days per week. Brain tissues were collected 2 months after tumor cell injection in the vehicle treatment group (Vehicle) 3 months after tumor cell injection in the osimertinib treatment group (minimal residual disease, or MRD) and 8 months after tumor cell injection in the osimertinib-treated relapse group (Relapse). Scale bars, 100 μm. Data are representative of 10 mice/group analyzed at each time point. G, Schematic representation of single-cell cloning from PC9-BrM cells. S100A9 high- and low-expressing single-cell progenies (SCP) are labeled as S100A9hi and S100A9lo, respectively. H, Immunoblot analysis of lysates from PC9-BrM–derived SCPs using antibodies against S100A8, S100A9, and β-actin (loading control). The data are representative of three independent experiments. I, Schematic representation of the brain metastasis assay to compare the ability of S100A9hi and S100A9lo SCPs to grow in the brain and generate metastases. J,Ex vivo photon flux of brains from mice injected with PC9-BrM–derived S100A9hi and S100A9lo SCPs was determined by bioluminescence imaging. Brains were collected from mice 7 weeks after tumor cell injection. Photon-flux scale is indicated below the images. K, Violin plots depicting normalized photon flux of brains imaged ex vivo from mice described in J. The normalized photon flux for brain tissue was calculated by dividing the photon flux from brain collected ex vivo by the total photon flux at day 0 (i.e., the day of injection) and multiplying that value by 100. Data are presented as mean values ± SEM. P values were determined by a two--tailed, unpaired Mann–Whitney test. N = 5 for S100A9hi; n = 4 for S100A9lo. L, Representative images of CK7 IHC on brain sections from mice injected with PC9-BrM–derived S100A9hi and S100A9lo SCPs. Brains were harvested from mice 7 weeks after tumor cell injection. Scale bars, 200 μm. M, Quantitative analysis of the percentage of CK7-immunostained brain sections covered by metastasis (Met area) in the experiment described in L. Data are presented as mean values ± SEM. P values were determined by a two-tailed, unpaired Mann–Whitney test: n = 5 for S100A9hi and n = 5 for S100A9lo.
Figure 4. High S100A9 expression is associated with brain metastasis and shorter PFS in patients with osimertinib-treated lung cancer. A, Schematic representation of the analysis of patient samples for S100A9 expression in cancer cells. S100A9 immunostaining was performed on tissue specimens (biopsies/resected material) from 29 patients with lung cancer with a validated EGFR mutation that were obtained prior to osimertinib treatment. The immunostained samples were scored by independent pathologists as either S100A9-positive (any percentage of clear, positive intracellular S100A9 staining in cancer cells) or S100A9-negative (no detectable S100A9 staining in cancer cells). neg, S100A9-negative; pos, S100A9-positive. B, Graphical representation of the association between S100A9 expression in the patient tissue specimens described in A and the development of brain metastasis (met) for 26 patients with a clinical annotation for the presence or absence of brain metastasis at diagnosis (three of 29 patients had unknown brain metastasis status at diagnosis). The P value was determined by a χ2 test: n = 10 samples from patients with brain metastasis and n = 16 samples from patients without brain metastasis. C, Distribution of patients on first-, second-, and third-line osimertinib (Osi) treatment from the 29-patient cohort described in A. D, Kaplan–Meier plot for the PFS of osimertinib-treated patients from the combined cohort described in A. Data were analyzed using the log-rank test: χ2  =  10.74, degrees of freedom (d.f.)  =  1, P = 0.0001, n = 29 patients. Patients who had not progressed at the time of analysis were censored. E, Kaplan–Meier plot for PFS of the osimertinib-treated patients described in A and C. Data were analyzed using the log-rank test. For first-line osimertinib-treated patients: χ2  =  6.011, d.f.  =  1, P = 0.0106, n = 17; for second- and third-line osimertinib-treated patients: χ2  =  4.015, d.f.  =  1, P = 0.0451, n = 12. Patients who had not progressed at the time of analysis were censored.
Figure 4.
High S100A9 expression is associated with brain metastasis and shorter PFS in patients with osimertinib-treated lung cancer. A, Schematic representation of the analysis of patient samples for S100A9 expression in cancer cells. S100A9 immunostaining was performed on tissue specimens (biopsies/resected material) from 29 patients with lung cancer with a validated EGFR mutation that were obtained prior to osimertinib treatment. The immunostained samples were scored by independent pathologists as either S100A9-positive (any percentage of clear, positive intracellular S100A9 staining in cancer cells) or S100A9-negative (no detectable S100A9 staining in cancer cells). neg, S100A9-negative; pos, S100A9-positive. B, Graphical representation of the association between S100A9 expression in the patient tissue specimens described in A and the development of brain metastasis (met) for 26 patients with a clinical annotation for the presence or absence of brain metastasis at diagnosis (three of 29 patients had unknown brain metastasis status at diagnosis). The P value was determined by a χ2 test: n = 10 samples from patients with brain metastasis and n = 16 samples from patients without brain metastasis. C, Distribution of patients on first-, second-, and third-line osimertinib (Osi) treatment from the 29-patient cohort described in A. D, Kaplan–Meier plot for the PFS of osimertinib-treated patients from the combined cohort described in A. Data were analyzed using the log-rank test: χ2  =  10.74, degrees of freedom (d.f.)  =  1, P = 0.0001, n = 29 patients. Patients who had not progressed at the time of analysis were censored. E, Kaplan–Meier plot for PFS of the osimertinib-treated patients described in A and C. Data were analyzed using the log-rank test. For first-line osimertinib-treated patients: χ2  =  6.011, d.f.  =  1, P = 0.0106, n = 17; for second- and third-line osimertinib-treated patients: χ2  =  4.015, d.f.  =  1, P = 0.0451, n = 12. Patients who had not progressed at the time of analysis were censored.
Figure 5. S100A9 promotes brain relapse through ALDH1A1. A, Volcano plot shows the significantly differentially expressed genes between PC9-Tr-BrM cells expressing either Lenti-Con or S100A9i gRNAs as identified by RNA-seq analysis. Genes with significantly higher expression in PC9-Tr-BrM-S100A9i cells compared with PC9-Tr-BrM-Lenti-Con cells have log2 fold changes with positive values and are depicted in red. Genes with significantly lower expression in PC9-Tr-BrM-S100A9i cells compared with PC9-Tr-BrM-Lenti-Con cells have log2 fold changes with negative values and are depicted in blue. N = 3 per group. Genes with an adjusted P value of less than 1.0 × 10⁻⁴ and an absolute value of the log2 fold change of greater than 2.4 were considered significant. B, Heat map of the top significantly upregulated and downregulated genes in PC9-Tr-BrM–derived S100A9i-expressing cells versus Lenti-Con–expressing cells (Con). Normalized gene expression above the row mean is indicated by progressively darker shades of red, and normalized gene expression below the row mean is indicated by progressively darker shades of blue. Genes with an adjusted P value of less than 1.0 × 10⁻⁴ and an absolute value of the log2 fold change of greater than 2.4 were considered significant. C, ALDH1A1 expression was determined by qRT--PCR analysis in PC9-derived Tr-BrM cells expressing either Lenti-Con or S100A9i. GAPDH was measured as an internal control. Data are presented as mean values ± SEM. The P value was determined by a two-tailed, unpaired Mann–Whitney test: n = 6 for Lenti-Con and n = 6 for S100A9i. D, Immunoblot analysis of lysates from PC9-Tr-BrM cells expressing either Lenti-Con or S100A9i using antibodies against ALDH1A1 and β-actin (loading control). The data are representative of three independent experiments. Rel., relative. E, Representative images of serial brain sections stained with an antibody against S100A9 (left) and ALDH1A1 (right) taken from two different mice (designated “Tr-BrM 1” and “Tr-BrM 2”) injected with PC9-Tr-BrM cells. Brains were collected at 7 weeks after tumor cell injection. Images are representative of eight mice analyzed per group. Scale bars, 2,000 μm. F, Representative images of brain sections stained with an antibody against ALDH1A1 taken from mice injected with PC9-Tr-BrM cells expressing either Lenti-Con or S100A9i and collected 7 weeks after tumor cell injection. Scale bars, 200 μm. G, Quantitative analysis of the ALDH1A1-positive cells (pos.) shown in F. Immunostained sections were counted using the QuPath software, where positively stained cells were identified by setting a threshold for signal intensity (1+). Data are presented as mean values ± SEM. The P value was determined by a two--tailed, unpaired Mann–Whitney test: n = 5 for Lenti-Con and n = 5 for S100A9i. H, Immunoblot analysis of lysates from PC9-Tr-BrM cells expressing either Lenti-Con or ALDH1A1i using antibodies against ALDH1A1 and β-actin (loading control). The data are representative of three independent experiments. I, Ex vivo photon flux of brains from mice injected with PC9-Tr-BrM–derived cells expressing either Lenti-Con or ALDH1A1i was determined by bioluminescence imaging. Brains were collected from mice 7 weeks after tumor cell injection. Photon-flux scale is indicated on the right side. J, Violin plots depicting normalized photon flux of brains imaged ex vivo from the mice described in I. The normalized photon flux for brain tissue was calculated by dividing the photon flux from brain collected ex vivo by the total photon flux at day 0 (i.e., the day of injection) and multiplying that value by 100. Data are presented as mean values ± SEM. The P value was determined by a two--tailed, unpaired Mann–Whitney test: n = 5 for Lenti-Con and n = 5 for ALDH1A1i. K, Representative images from CK7 IHC on brain sections from mice injected with PC9-Tr-BrM-Lenti-Con cells (top) or PC9-Tr-BrM-ALDH1A1i cells (bottom). Brains were harvested from mice 7 weeks after tumor cell injection. Scale bars, 200 μm. L, Quantitative analysis of the percentage of CK7-immunostained brain sections covered by metastasis from the experiment described in K. Data are presented as mean values ± SEM. The P value was determined by a two-tailed, unpaired Mann–Whitney test: n = 5 for Lenti-Con and n = 3 for ALDH1A1i. M, Immunoblot analysis of lysates from PC9-Tr-BrM-S100A9i cells expressing either lenti-vector control (Lenti-Vec Con) or ALDH1A1 (“ALDH1A1o/e” denotes ALDH1A1 overexpression) using antibodies against ALDH1A1 and β-actin (loading control). Data are representative of three independent experiments. N, Ex vivo photon flux of brains from mice injected with PC9-Tr-BrM-S100A9i cells expressing either Lenti-Vec Con or ALDH1A1 was determined by bioluminescence imaging. Brains were collected from mice 7 weeks after tumor cell injection. The photon-flux scale is indicated on the right. O, Violin plots depicting normalized photon flux of brains imaged ex vivo from the mice described in N. The normalized photon flux for brain tissue was calculated by dividing the photon flux from brain collected ex vivo by the total photon flux at day 0 (i.e., the day of injection) and multiplying that value by 100. Data are presented as mean values ± SEM. The P value was determined by a two--tailed, unpaired Mann–Whitney test: n = 6 for Lenti-Vec Con; n = 5 for ALDH1A1o/e. P, Representative images of CK7 IHC on brain sections from mice injected with PC9-Tr-BrM S100A9i cells expressing either Lenti-Vec Con (top) or ALDH1A1 (bottom). Brains were harvested from mice 7 weeks after tumor cell injection. Scale bars, 200 μm. Q, Quantitative analysis of the percentage of CK7-immunostained brain sections covered by metastasis (Met) from the experiment described in P. Data are presented as mean values ± SEM. The P value was determined by a two-tailed, unpaired Mann–Whitney test: n = 5 for Lenti-Vec Con and n = 6 for ALDH1A1o/e.
Figure 5.
S100A9 promotes brain relapse through ALDH1A1. A, Volcano plot shows the significantly differentially expressed genes between PC9-Tr-BrM cells expressing either Lenti-Con or S100A9i gRNAs as identified by RNA-seq analysis. Genes with significantly higher expression in PC9-Tr-BrM-S100A9i cells compared with PC9-Tr-BrM-Lenti-Con cells have log2 fold changes with positive values and are depicted in red. Genes with significantly lower expression in PC9-Tr-BrM-S100A9i cells compared with PC9-Tr-BrM-Lenti-Con cells have log2 fold changes with negative values and are depicted in blue. N = 3 per group. Genes with an adjusted P value of less than 1.0 × 10⁻⁴ and an absolute value of the log2 fold change of greater than 2.4 were considered significant. B, Heat map of the top significantly upregulated and downregulated genes in PC9-Tr-BrM–derived S100A9i-expressing cells versus Lenti-Con–expressing cells (Con). Normalized gene expression above the row mean is indicated by progressively darker shades of red, and normalized gene expression below the row mean is indicated by progressively darker shades of blue. Genes with an adjusted P value of less than 1.0 × 10⁻⁴ and an absolute value of the log2 fold change of greater than 2.4 were considered significant. C,ALDH1A1 expression was determined by qRT--PCR analysis in PC9-derived Tr-BrM cells expressing either Lenti-Con or S100A9i. GAPDH was measured as an internal control. Data are presented as mean values ± SEM. The P value was determined by a two-tailed, unpaired Mann–Whitney test: n = 6 for Lenti-Con and n = 6 for S100A9i. D, Immunoblot analysis of lysates from PC9-Tr-BrM cells expressing either Lenti-Con or S100A9i using antibodies against ALDH1A1 and β-actin (loading control). The data are representative of three independent experiments. Rel., relative. E, Representative images of serial brain sections stained with an antibody against S100A9 (left) and ALDH1A1 (right) taken from two different mice (designated “Tr-BrM 1” and “Tr-BrM 2”) injected with PC9-Tr-BrM cells. Brains were collected at 7 weeks after tumor cell injection. Images are representative of eight mice analyzed per group. Scale bars, 2,000 μm. F, Representative images of brain sections stained with an antibody against ALDH1A1 taken from mice injected with PC9-Tr-BrM cells expressing either Lenti-Con or S100A9i and collected 7 weeks after tumor cell injection. Scale bars, 200 μm. G, Quantitative analysis of the ALDH1A1-positive cells (pos.) shown in F. Immunostained sections were counted using the QuPath software, where positively stained cells were identified by setting a threshold for signal intensity (1+). Data are presented as mean values ± SEM. The P value was determined by a two--tailed, unpaired Mann–Whitney test: n = 5 for Lenti-Con and n = 5 for S100A9i. H, Immunoblot analysis of lysates from PC9-Tr-BrM cells expressing either Lenti-Con or ALDH1A1i using antibodies against ALDH1A1 and β-actin (loading control). The data are representative of three independent experiments. I,Ex vivo photon flux of brains from mice injected with PC9-Tr-BrM–derived cells expressing either Lenti-Con or ALDH1A1i was determined by bioluminescence imaging. Brains were collected from mice 7 weeks after tumor cell injection. Photon-flux scale is indicated on the right side. J, Violin plots depicting normalized photon flux of brains imaged ex vivo from the mice described in I. The normalized photon flux for brain tissue was calculated by dividing the photon flux from brain collected ex vivo by the total photon flux at day 0 (i.e., the day of injection) and multiplying that value by 100. Data are presented as mean values ± SEM. The P value was determined by a two--tailed, unpaired Mann–Whitney test: n = 5 for Lenti-Con and n = 5 for ALDH1A1i. K, Representative images from CK7 IHC on brain sections from mice injected with PC9-Tr-BrM-Lenti-Con cells (top) or PC9-Tr-BrM-ALDH1A1i cells (bottom). Brains were harvested from mice 7 weeks after tumor cell injection. Scale bars, 200 μm. L, Quantitative analysis of the percentage of CK7-immunostained brain sections covered by metastasis from the experiment described in K. Data are presented as mean values ± SEM. The P value was determined by a two-tailed, unpaired Mann–Whitney test: n = 5 for Lenti-Con and n = 3 for ALDH1A1i. M, Immunoblot analysis of lysates from PC9-Tr-BrM-S100A9i cells expressing either lenti-vector control (Lenti-Vec Con) or ALDH1A1 (“ALDH1A1o/e” denotes ALDH1A1 overexpression) using antibodies against ALDH1A1 and β-actin (loading control). Data are representative of three independent experiments. N,Ex vivo photon flux of brains from mice injected with PC9-Tr-BrM-S100A9i cells expressing either Lenti-Vec Con or ALDH1A1 was determined by bioluminescence imaging. Brains were collected from mice 7 weeks after tumor cell injection. The photon-flux scale is indicated on the right. O, Violin plots depicting normalized photon flux of brains imaged ex vivo from the mice described in N. The normalized photon flux for brain tissue was calculated by dividing the photon flux from brain collected ex vivo by the total photon flux at day 0 (i.e., the day of injection) and multiplying that value by 100. Data are presented as mean values ± SEM. The P value was determined by a two--tailed, unpaired Mann–Whitney test: n = 6 for Lenti-Vec Con; n = 5 for ALDH1A1o/e. P, Representative images of CK7 IHC on brain sections from mice injected with PC9-Tr-BrM S100A9i cells expressing either Lenti-Vec Con (top) or ALDH1A1 (bottom). Brains were harvested from mice 7 weeks after tumor cell injection. Scale bars, 200 μm. Q, Quantitative analysis of the percentage of CK7-immunostained brain sections covered by metastasis (Met) from the experiment described in P. Data are presented as mean values ± SEM. The P value was determined by a two-tailed, unpaired Mann–Whitney test: n = 5 for Lenti-Vec Con and n = 6 for ALDH1A1o/e.
Figure 6. Osimertinib-refractory cancer cells are sensitive to pan-RAR inhibition. A, Schematic representation of the treatment of PC9- and H1650-derived Tr-BrM cells with vehicle, osimertinib alone, a pan-RAR antagonist (AGN194310) alone, or AGN194310 in combination with osimertinib. At 25 days after tumor cell injection, after confirmation of metastatic signal, mice were administered long-term treatment with either (i) vehicle (Veh), (ii) AGN194310 (Pan-RARi; 0.5 mg/kg body weight/day), (iii) osimertinib (Osi; 5 mg/kg body weight/day), or (iv) AGN194310 (0.5 mg/kg body weight/day) plus osimertinib (5 mg/kg body weight/day) by oral gavage 5 days per week until the endpoint (7 weeks after tumor cell injection). B, Ex vivo photon flux of posttreatment brains from the experiment described in A was determined at endpoint by bioluminescence imaging. The photon-flux scale is indicated on the right. C, Violin plots depicting normalized photon flux of brains imaged ex vivo from the mice described in B. The normalized photon flux for brain tissue was calculated by dividing the photon flux from brain collected ex vivo by the total photon flux at day 0 (i.e., the day of injection) and multiplying that value by 100. Data are presented as mean values ± SEM. P values were determined by a two--tailed, unpaired Mann–Whitney test. For PC9-Tr-BrM mice: n = 8 for vehicle; n = 8 for osimertinib; n = 7 for pan-RARi; and n = 7 for osimertinib plus pan-RARi. For H1650-Tr-BrM mice: n = 12 for vehicle; n = 8 for osimertinib; n = 10 for pan-RARi; and n = 6 for osimertinib plus pan-RARi. ns, P value not significant. D, Representative images of CK7 IHC on posttreatment brain sections collected at endpoint from the experiment described in A. Scale bars, 200 μm for top (PC9-Tr-BrM) and 100 μm for bottom (H1650-Tr-BrM). E, Quantitative analysis of the percentage of CK7-immunostained brain sections covered by metastasis (Met) shown in D. Data are presented as mean values ± SEM. P values were determined by a two-tailed, unpaired Mann–Whitney test. For PC9-Tr-BrM mice: n = 11 for vehicle; n = 9 for osimertinib; n = 4 for pan-RARi; and n = 5 for osimertinib plus pan-RARi. For H1650-Tr-BrM mice: n = 6 for vehicle; n = 6 for osimertinib; n = 9 for pan-RARi; and n = 6 for osimertinib plus pan-RARi. F, Schematic representation of the experiment testing the effect of RAR gene knockdown on brain metastasis development. Mice were injected with either PC9- or H1650-derived Tr-BrM cells with one of two sets of shRNA-mediated stable dual knockdown of RARα and RARγ (sh-RARα + γ), or control shRNA (sh-Con), via intracardiac injection. Experiments involving shRNA set #1 are shown in G–J, whereas experiments involving shRNA set #2 are shown in Supplementary Fig. S6L–S6O. Mice were euthanized 7 weeks after tumor cell injection, and brains were collected for analysis. G, Ex vivo photon flux of posttreatment brains from the experiment described in F was determined at endpoint by bioluminescence imaging. The photon-flux scale is indicated on the right. H, Violin plots depicting normalized photon flux of brains imaged ex vivo from the mice represented in G. The normalized photon flux for brain tissue was calculated by dividing the photon flux from brain collected ex vivo by the total photon flux at day 0 (i.e., the day of injection) and multiplying that value by 100. Data are presented as mean values ± SEM. P values were determined by a two--tailed, unpaired Mann–Whitney test. For PC9-Tr-BrM: n = 7 for sh-Con; n = 5 for sh-RAR. For H1650-Tr-BrM: n = 8 for sh-Con; n = 6 for sh-RAR. I, Representative images of CK7 IHC on posttreatment brain sections collected at endpoint from the experiment described in F. Scale bars, 100 μm for all images. J, Quantitative analysis of the percentage of CK7-immunostained brain sections covered by metastasis shown in I. Data are presented as mean values ± SEM. P values were determined by a two-tailed, unpaired Mann–Whitney test. For PC9-Tr-BrM: n = 10 for sh-Con; n = 10 for sh-RAR. For H1650-Tr-BrM: n = 5 for sh-Con; n = 5 for sh-RAR.
Figure 6.
Osimertinib-refractory cancer cells are sensitive to pan-RAR inhibition. A, Schematic representation of the treatment of PC9- and H1650-derived Tr-BrM cells with vehicle, osimertinib alone, a pan-RAR antagonist (AGN194310) alone, or AGN194310 in combination with osimertinib. At 25 days after tumor cell injection, after confirmation of metastatic signal, mice were administered long-term treatment with either (i) vehicle (Veh), (ii) AGN194310 (Pan-RARi; 0.5 mg/kg body weight/day), (iii) osimertinib (Osi; 5 mg/kg body weight/day), or (iv) AGN194310 (0.5 mg/kg body weight/day) plus osimertinib (5 mg/kg body weight/day) by oral gavage 5 days per week until the endpoint (7 weeks after tumor cell injection). B,Ex vivo photon flux of posttreatment brains from the experiment described in A was determined at endpoint by bioluminescence imaging. The photon-flux scale is indicated on the right. C, Violin plots depicting normalized photon flux of brains imaged ex vivo from the mice described in B. The normalized photon flux for brain tissue was calculated by dividing the photon flux from brain collected ex vivo by the total photon flux at day 0 (i.e., the day of injection) and multiplying that value by 100. Data are presented as mean values ± SEM. P values were determined by a two--tailed, unpaired Mann–Whitney test. For PC9-Tr-BrM mice: n = 8 for vehicle; n = 8 for osimertinib; n = 7 for pan-RARi; and n = 7 for osimertinib plus pan-RARi. For H1650-Tr-BrM mice: n = 12 for vehicle; n = 8 for osimertinib; n = 10 for pan-RARi; and n = 6 for osimertinib plus pan-RARi. ns, P value not significant. D, Representative images of CK7 IHC on posttreatment brain sections collected at endpoint from the experiment described in A. Scale bars, 200 μm for top (PC9-Tr-BrM) and 100 μm for bottom (H1650-Tr-BrM). E, Quantitative analysis of the percentage of CK7-immunostained brain sections covered by metastasis (Met) shown in D. Data are presented as mean values ± SEM. P values were determined by a two-tailed, unpaired Mann–Whitney test. For PC9-Tr-BrM mice: n = 11 for vehicle; n = 9 for osimertinib; n = 4 for pan-RARi; and n = 5 for osimertinib plus pan-RARi. For H1650-Tr-BrM mice: n = 6 for vehicle; n = 6 for osimertinib; n = 9 for pan-RARi; and n = 6 for osimertinib plus pan-RARi. F, Schematic representation of the experiment testing the effect of RAR gene knockdown on brain metastasis development. Mice were injected with either PC9- or H1650-derived Tr-BrM cells with one of two sets of shRNA-mediated stable dual knockdown of RARα and RARγ (sh-RARα + γ), or control shRNA (sh-Con), via intracardiac injection. Experiments involving shRNA set #1 are shown in G–J, whereas experiments involving shRNA set #2 are shown in Supplementary Fig. S6L–S6O. Mice were euthanized 7 weeks after tumor cell injection, and brains were collected for analysis. G,Ex vivo photon flux of posttreatment brains from the experiment described in F was determined at endpoint by bioluminescence imaging. The photon-flux scale is indicated on the right. H, Violin plots depicting normalized photon flux of brains imaged ex vivo from the mice represented in G. The normalized photon flux for brain tissue was calculated by dividing the photon flux from brain collected ex vivo by the total photon flux at day 0 (i.e., the day of injection) and multiplying that value by 100. Data are presented as mean values ± SEM. P values were determined by a two--tailed, unpaired Mann–Whitney test. For PC9-Tr-BrM: n = 7 for sh-Con; n = 5 for sh-RAR. For H1650-Tr-BrM: n = 8 for sh-Con; n = 6 for sh-RAR. I, Representative images of CK7 IHC on posttreatment brain sections collected at endpoint from the experiment described in F. Scale bars, 100 μm for all images. J, Quantitative analysis of the percentage of CK7-immunostained brain sections covered by metastasis shown in I. Data are presented as mean values ± SEM. P values were determined by a two-tailed, unpaired Mann–Whitney test. For PC9-Tr-BrM: n = 10 for sh-Con; n = 10 for sh-RAR. For H1650-Tr-BrM: n = 5 for sh-Con; n = 5 for sh-RAR.
Figure 7. The combination of osimertinib and pan-RAR antagonism reduces residual cancer cells in the brain. A, Schematic representation of the experimental treatment protocol for the prevention trial. Osimertinib-sensitive PC9- or H1650-BrM cells were injected into mice via intracardiac injections. At 5 days after tumor cell injection, mice were administered treatment with either (i) vehicle (Veh), (ii) AGN194310 (Pan-RARi; 0.5 mg/kg body weight/day), (iii) osimertinib (Osi; 5 mg/kg body weight/day), or (iv) AGN194310 (0.5 mg/kg body weight/day) plus osimertinib (5 mg/kg body weight/day) by oral gavage 5 days per week until the endpoint (7 weeks after tumor cell injection). B, Representative images of CK7 IHC on posttreatment brain sections at endpoint from the experiment described in A. Scale bars, 500 μm for PC9-BrM and 100 μm for H1650-BrM. C, Quantitative analysis of the CK7-immunostained brain metastatic cancer cell number per μm2 represented in B. Data are presented as the mean number of cancer cells per μm2 of the brain tissue section ± SEM. P values were determined by a two-tailed, unpaired Mann–Whitney test. For PC9-BrM: n = 12 for vehicle; n = 16 for osimertinib; n = 10 for pan-RARi; and n = 10 for osimertinib plus pan-RARi. For H1650-BrM: n = 17 for vehicle; n = 12 for osimertinib; n = 10 for pan-RARi; and n = 14 for osimertinib plus pan-RARi. ns, P value not significant.
Figure 7.
The combination of osimertinib and pan-RAR antagonism reduces residual cancer cells in the brain. A, Schematic representation of the experimental treatment protocol for the prevention trial. Osimertinib-sensitive PC9- or H1650-BrM cells were injected into mice via intracardiac injections. At 5 days after tumor cell injection, mice were administered treatment with either (i) vehicle (Veh), (ii) AGN194310 (Pan-RARi; 0.5 mg/kg body weight/day), (iii) osimertinib (Osi; 5 mg/kg body weight/day), or (iv) AGN194310 (0.5 mg/kg body weight/day) plus osimertinib (5 mg/kg body weight/day) by oral gavage 5 days per week until the endpoint (7 weeks after tumor cell injection). B, Representative images of CK7 IHC on posttreatment brain sections at endpoint from the experiment described in A. Scale bars, 500 μm for PC9-BrM and 100 μm for H1650-BrM. C, Quantitative analysis of the CK7-immunostained brain metastatic cancer cell number per μm2 represented in B. Data are presented as the mean number of cancer cells per μm2 of the brain tissue section ± SEM. P values were determined by a two-tailed, unpaired Mann–Whitney test. For PC9-BrM: n = 12 for vehicle; n = 16 for osimertinib; n = 10 for pan-RARi; and n = 10 for osimertinib plus pan-RARi. For H1650-BrM: n = 17 for vehicle; n = 12 for osimertinib; n = 10 for pan-RARi; and n = 14 for osimertinib plus pan-RARi. ns, P value not significant.

Comment in

  • Cancer Discov. 12:873.
  • Cancer Discov. 12:873.

References

    1. Sung H, Ferlay J, Siegel RL, Laversanne M, Soerjomataram I, Jemal Aet al. . Global cancer statistics 2020: GLOBOCAN estimates of incidence and mortality worldwide for 36 cancers in 185 countries. CA Cancer J Clin 2021;71:209–49. - PubMed
    1. Shi Y, Au JS, Thongprasert S, Srinivasan S, Tsai CM, Khoa MTet al. . A prospective, molecular epidemiology study of EGFR mutations in Asian patients with advanced non-small-cell lung cancer of adenocarcinoma histology (PIONEER). J Thorac Oncol 2014;9:154–62. - PMC - PubMed
    1. Midha A, Dearden S, McCormack R. EGFR mutation incidence in non-small-cell lung cancer of adenocarcinoma histology: a systematic review and global map by ethnicity (mutMapII). Am J Cancer Res 2015;5:2892–911. - PMC - PubMed
    1. Du X, Yang B, An Q, Assaraf YG, Cao X, Xia J. Acquired resistance to third-generation EGFR-TKIs and emerging next-generation EGFR inhibitors. Innovation 2021;2:1–17. - PMC - PubMed
    1. Rosell R, Moran T, Queralt C, Porta R, Cardenal F, Camps Cet al. . Screening for epidermal growth factor receptor mutations in lung cancer. N Engl J Med 2009;361:958–67. - PubMed

Publication types

MeSH terms