. 2022 Mar 15;82(6):1140-1152.
doi: 10.1158/0008-5472.CAN-21-2997.

ATR Inhibitor AZD6738 (Ceralasertib) Exerts Antitumor Activity as a Monotherapy and in Combination with Chemotherapy and the PARP Inhibitor Olaparib

Affiliations

ATR Inhibitor AZD6738 (Ceralasertib) Exerts Antitumor Activity as a Monotherapy and in Combination with Chemotherapy and the PARP Inhibitor Olaparib

Zena Wilson et al. Cancer Res. .

Abstract

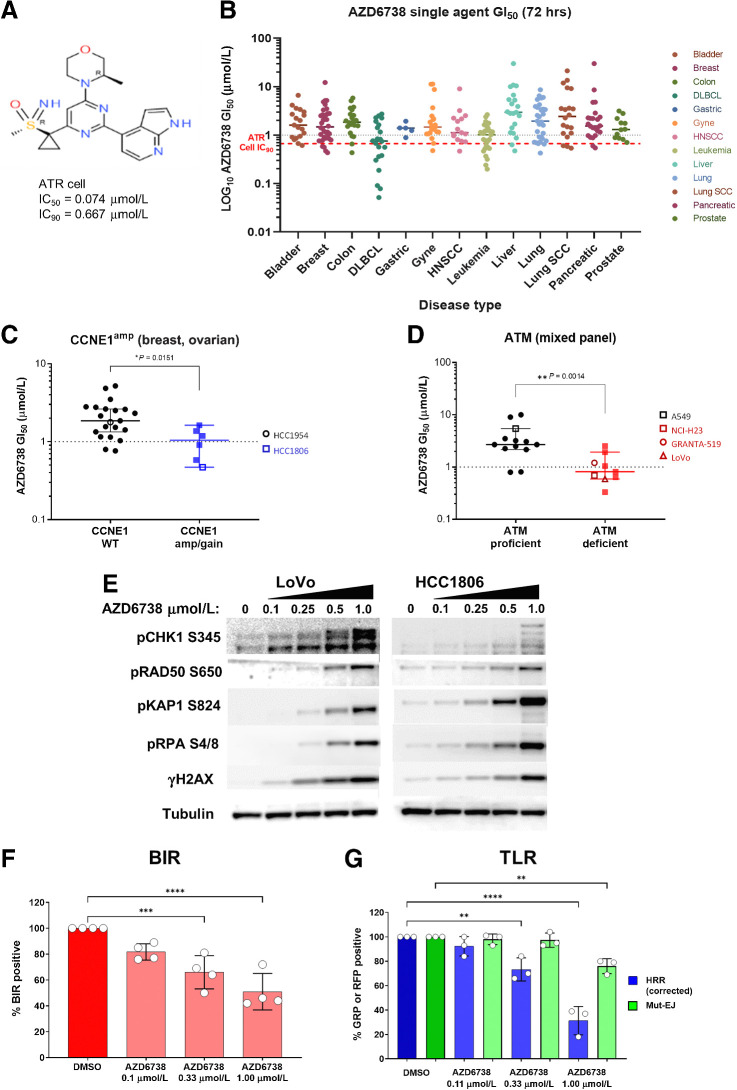
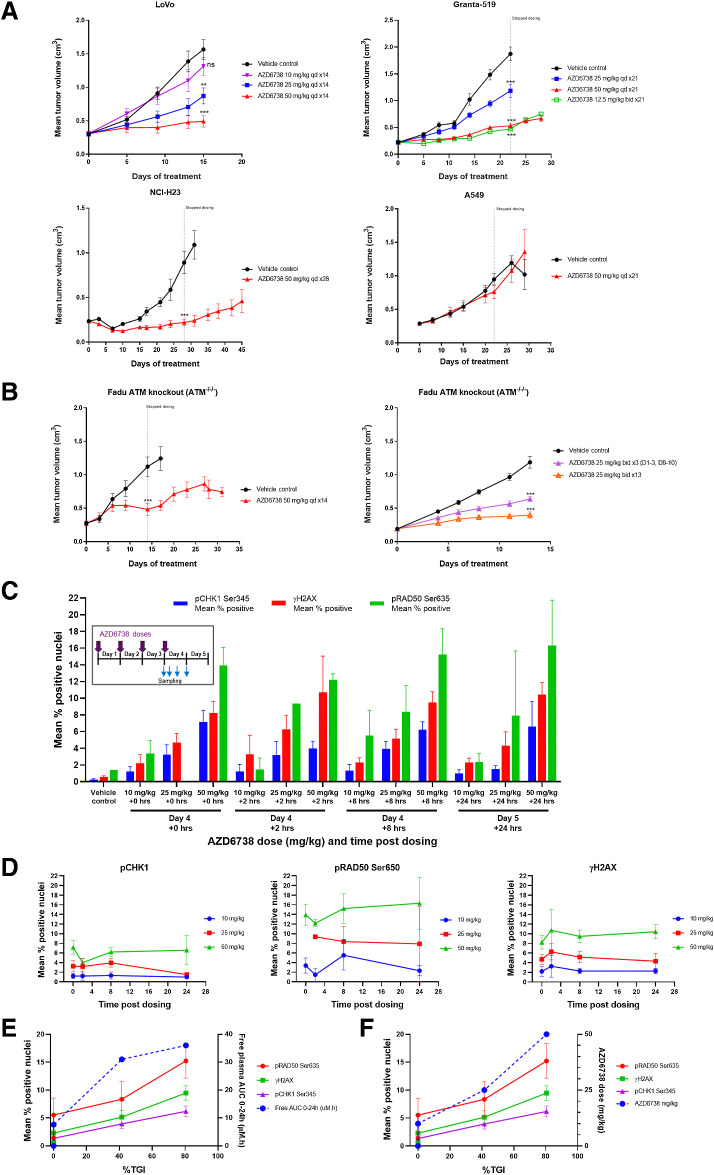
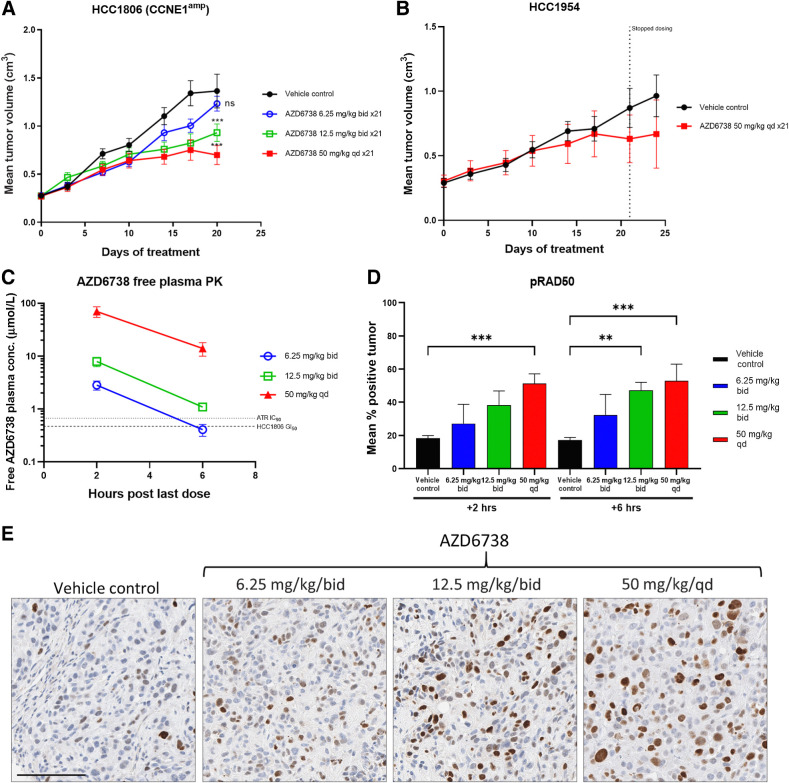
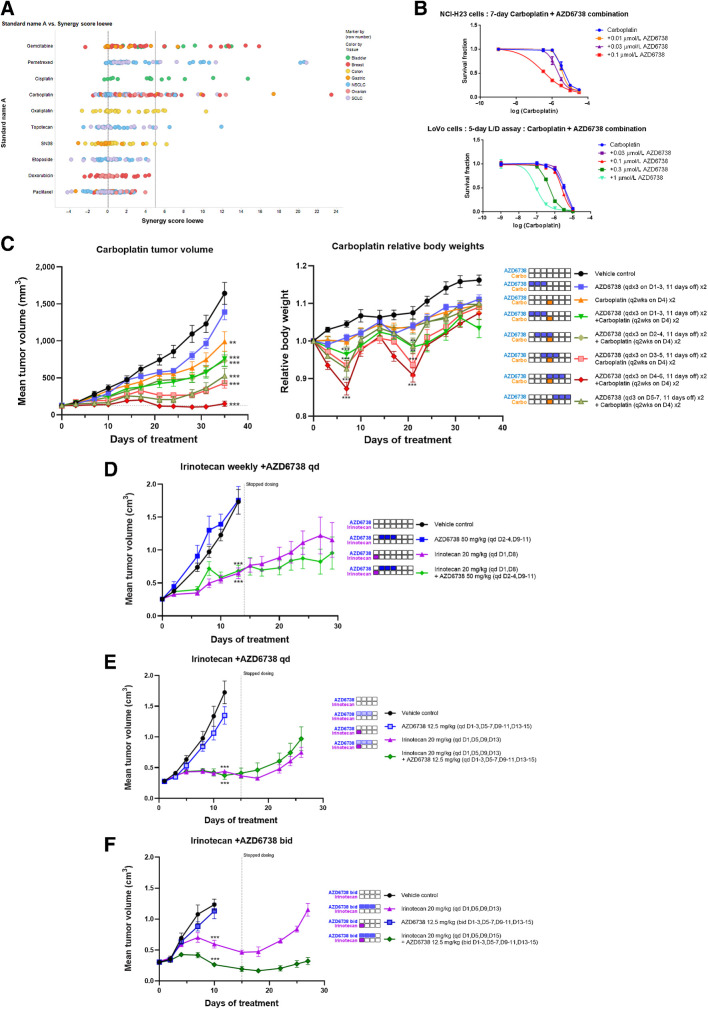
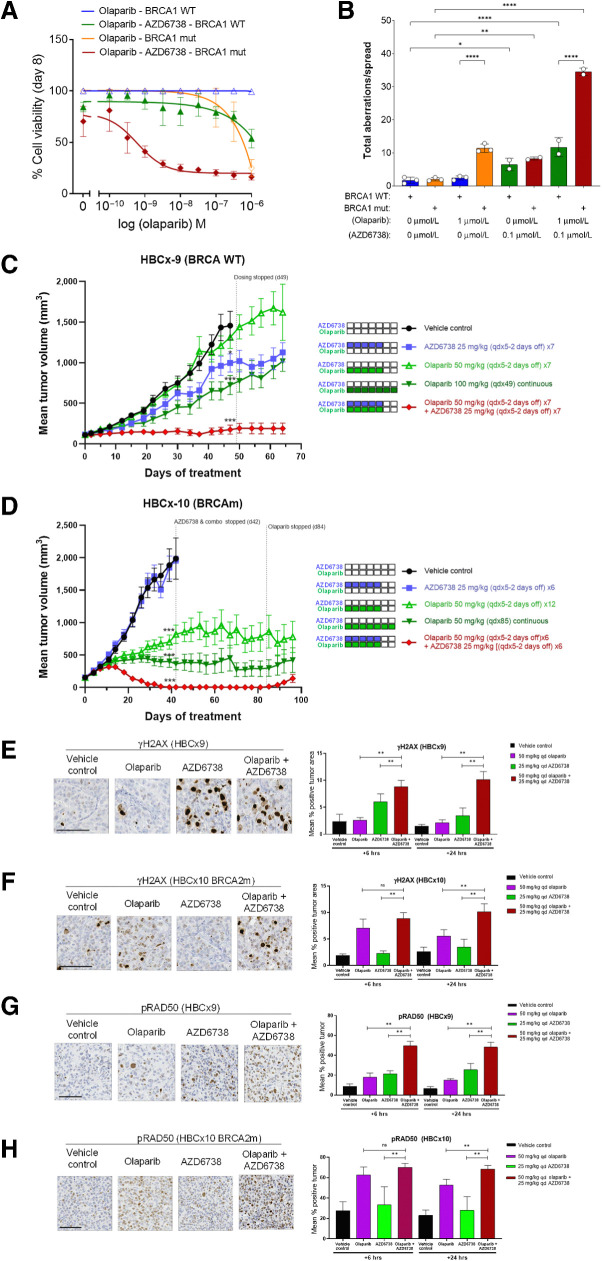
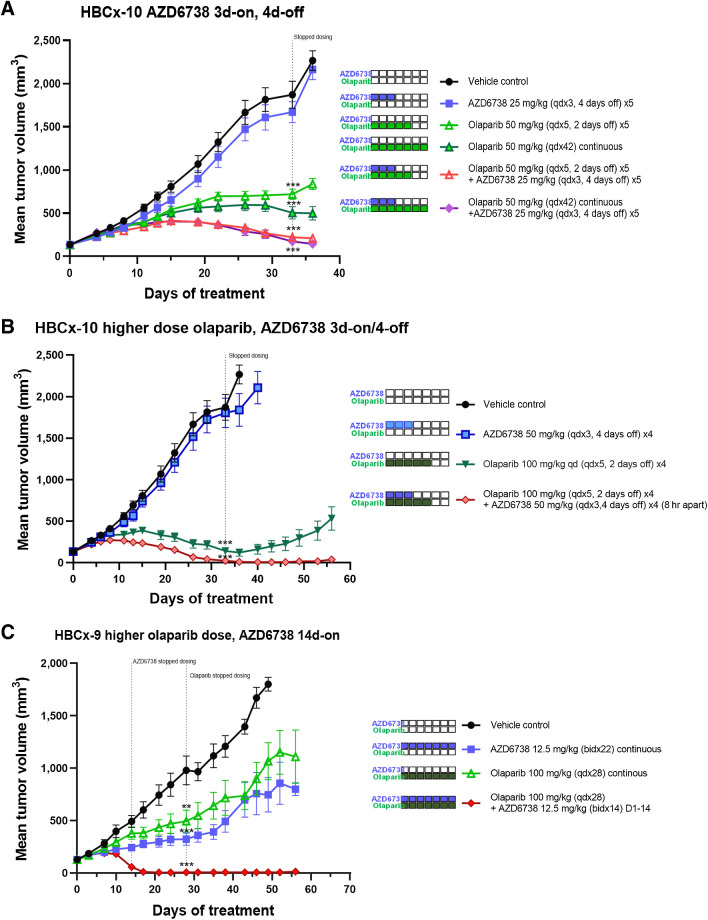
AZD6738 (ceralasertib) is a potent and selective orally bioavailable inhibitor of ataxia telangiectasia and Rad3-related (ATR) kinase. ATR is activated in response to stalled DNA replication forks to promote G2-M cell-cycle checkpoints and fork restart. Here, we found AZD6738 modulated CHK1 phosphorylation and induced ATM-dependent signaling (pRAD50) and the DNA damage marker γH2AX. AZD6738 inhibited break-induced replication and homologous recombination repair. In vitro sensitivity to AZD6738 was elevated in, but not exclusive to, cells with defects in the ATM pathway or that harbor putative drivers of replication stress such as CCNE1 amplification. This translated to in vivo antitumor activity, with tumor control requiring continuous dosing and free plasma exposures, which correlated with induction of pCHK1, pRAD50, and γH2AX. AZD6738 showed combinatorial efficacy with agents associated with replication fork stalling and collapse such as carboplatin and irinotecan and the PARP inhibitor olaparib. These combinations required optimization of dose and schedules in vivo and showed superior antitumor activity at lower doses compared with that required for monotherapy. Tumor regressions required at least 2 days of daily dosing of AZD6738 concurrent with carboplatin, while twice daily dosing was required following irinotecan. In a BRCA2-mutant patient-derived triple-negative breast cancer (TNBC) xenograft model, complete tumor regression was achieved with 3 to5 days of daily AZD6738 per week concurrent with olaparib. Increasing olaparib dosage or AZD6738 dosing to twice daily allowed complete tumor regression even in a BRCA wild-type TNBC xenograft model. These preclinical data provide rationale for clinical evaluation of AZD6738 as a monotherapy or combinatorial agent.

Significance: This detailed preclinical investigation, including pharmacokinetics/pharmacodynamics and dose-schedule optimizations, of AZD6738/ceralasertib alone and in combination with chemotherapy or PARP inhibitors can inform ongoing clinical efforts to treat cancer with ATR inhibitors.


Figures

Figure 1. In vitro activity of AZD6738 (ceralasertib). A, Chemical structure of AZD6738. B, Scatter plots of the GI50 values for all cell lines. Selected cell lines grouped by C and D, CCNE1 amplification (C) or ATM signaling status classification (D). Each cell line is labeled by a dot and the median GI50 ± 95% CI. E, Western blot of CHK1 pSer345, ATM signaling (RAD50 pSer635, KAP1 pSer824), replication stress (RPA pSer4/8), and γH2AX 24 hours after AZD6738 treatment at the indicated concentrations of AZD6738 in LoVo (MRE11Adel) and HCC1806 (CCNE1amp) cell line. F, AZD6738 inhibition of BIR in A549-BIR assay reporter cells. G, AZD6738 inhibition of HRR but not mutagenic end-joining (mut-EJ) repair in 293T-TLR assay reporter cells. **, P ≤ 0.01; ***, P ≤ 0.001; ****, P ≤ 0.0001.
Figure 1.
In vitro activity of AZD6738 (ceralasertib). A, Chemical structure of AZD6738. B, Scatter plots of the GI50 values for all cell lines. Selected cell lines grouped by C and D, CCNE1 amplification (C) or ATM signaling status classification (D). Each cell line is labeled by a dot and the median GI50 ± 95% CI. E, Western blot of CHK1 pSer345, ATM signaling (RAD50 pSer635, KAP1 pSer824), replication stress (RPA pSer4/8), and γH2AX 24 hours after AZD6738 treatment at the indicated concentrations of AZD6738 in LoVo (MRE11Adel) and HCC1806 (CCNE1amp) cell line. F, AZD6738 inhibition of BIR in A549-BIR assay reporter cells. G, AZD6738 inhibition of HRR but not mutagenic end-joining (mut-EJ) repair in 293T-TLR assay reporter cells. **, P ≤ 0.01; ***, P ≤ 0.001; ****, P ≤ 0.0001.
Figure 2. Antitumor in vivo efficacy of AZD6738 across multiple ATM-deficient cell line xenograft models. A and B, LoVo (MRE11A), Granta-519, NCI-H23, 549 (ATM-proficient control; A) and FaDu ATM knockout (B). AZD6738 was dosed at the indicated duration and doses either once daily (qd) or twice daily (bid). Mean tumor volume ± SEM is shown. C, LoVo xenograft IHC pharmacodynamics for CHK1 Ser345, γH2AX, and pRAD50 Ser645 biomarkers. AZD6738 was dosed at the indicated doses once daily for 3 to 4 days and tumor harvested at time 0 (day 4, before the 4th dose) or 2, 8, or 24 hours after fourth daily dose. Mean percentage of positive staining nuclei plus SD is shown. D, Change in expression for each biomarker. E, Free plasma AUC versus %TGI for each biomarker at 8 hours. F, AZD6738 dose versus %TGI for each biomarker at 8 hours. ns, nonsignificant; **, P ≤ 0.01; ***, P ≤ 0.001.
Figure 2.
Antitumor in vivo efficacy of AZD6738 across multiple ATM-deficient cell line xenograft models. A and B, LoVo (MRE11A), Granta-519, NCI-H23, 549 (ATM-proficient control; A) and FaDu ATM knockout (B). AZD6738 was dosed at the indicated duration and doses either once daily (qd) or twice daily (bid). Mean tumor volume ± SEM is shown. C, LoVo xenograft IHC pharmacodynamics for CHK1 Ser345, γH2AX, and pRAD50 Ser645 biomarkers. AZD6738 was dosed at the indicated doses once daily for 3 to 4 days and tumor harvested at time 0 (day 4, before the 4th dose) or 2, 8, or 24 hours after fourth daily dose. Mean percentage of positive staining nuclei plus SD is shown. D, Change in expression for each biomarker. E, Free plasma AUC versus %TGI for each biomarker at 8 hours. F, AZD6738 dose versus %TGI for each biomarker at 8 hours. ns, nonsignificant; **, P ≤ 0.01; ***, P ≤ 0.001.
Figure 3. Antitumor in vivo efficacy breast cancer cell line xenograft models. A and B, HCC1806 harboring cyclin E amplification (A) and WT control HCC1954 xenografts (B). AZD6738 was dosed at the indicated duration and doses either once daily (qd) or twice daily (bid). Mean tumor volume ± SEM are shown. End-of-efficacy (day 21) plasma pharmacokinetics (PK) and tumor pharmacodynamics were assessed for HCC1806. C, Free plasma AZD6738 concentration (PK) plotted against dose at 2 or 6 hours after last AZD6738 dose. D, Pharmacodynamics IHC quantification of percentage of tumor cells positive for pRAD50 Ser635 at 2 or 6 hours post last AZD6738 or vehicle dose. Mean percentage of positive staining nuclei plus SD is shown. E, Representative images of the IHC pRAD50 expression 2 hours post last dose. ns, nonsignificant; **, P ≤ 0.01; ***, P ≤ 0.001.
Figure 3.
Antitumor in vivo efficacy breast cancer cell line xenograft models. A and B, HCC1806 harboring cyclin E amplification (A) and WT control HCC1954 xenografts (B). AZD6738 was dosed at the indicated duration and doses either once daily (qd) or twice daily (bid). Mean tumor volume ± SEM are shown. End-of-efficacy (day 21) plasma pharmacokinetics (PK) and tumor pharmacodynamics were assessed for HCC1806. C, Free plasma AZD6738 concentration (PK) plotted against dose at 2 or 6 hours after last AZD6738 dose. D, Pharmacodynamics IHC quantification of percentage of tumor cells positive for pRAD50 Ser635 at 2 or 6 hours post last AZD6738 or vehicle dose. Mean percentage of positive staining nuclei plus SD is shown. E, Representative images of the IHC pRAD50 expression 2 hours post last dose. ns, nonsignificant; **, P ≤ 0.01; ***, P ≤ 0.001.
Figure 4. AZD6738 in combination with DNA-damaging chemotherapy. A, Dot plots of in vitro cell line screen with AZD6738 in combination with the indicated DNA damaging chemotherapies. Combination synergy scores (Loewe) were calculated for each cell line and combination where values greater than 5 are considered overall synergistic and values between 1 and 5 overall additive. Each cell line is labeled by a dot. B, Representative example of carboplatin GI50 curve shifts by fixed concentration of AZD6738 in NCI-H23 and LoVo cells in vitro. Efficacy in vivo for carboplatin in combination with AZD6738 in human breast cancer PDX model HBCx-9 at the indicated doses and schedules. C, Antitumor combination efficacy and relative body weight losses are dependent on sequence of AZD6738 administration relative to carboplatin. Dosing on days after carboplatin is required for efficacy. Mean tumor volume ± SEM is shown. Body weight loss for combination with carboplatin is also dependent on sequence of administration, with animals with dosing on days after carboplatin experiencing more, but recoverable body weight losses. Mean body weights at time of treatment relative to starting weights are shown. Statistical differences were assessed on day 7 and day 21 nadir's only. D–F, Efficacy in vivo for irinotecan in combination with AZD6738 in human colorectal cell line xenograft Colo205 using AZD6738 (D) was dosed after irinotecan, low-dose AZD6738 was dosed once daily concurrently with irinotecan (E), or low-dose AZD6738 (F) was dosed twice daily concurrently after twice weekly irinotecan. Mean tumor volume ± SEM is shown. **, P ≤ 0.01; ***, P ≤ 0.001.
Figure 4.
AZD6738 in combination with DNA-damaging chemotherapy. A, Dot plots of in vitro cell line screen with AZD6738 in combination with the indicated DNA damaging chemotherapies. Combination synergy scores (Loewe) were calculated for each cell line and combination where values greater than 5 are considered overall synergistic and values between 1 and 5 overall additive. Each cell line is labeled by a dot. B, Representative example of carboplatin GI50 curve shifts by fixed concentration of AZD6738 in NCI-H23 and LoVo cells in vitro. Efficacy in vivo for carboplatin in combination with AZD6738 in human breast cancer PDX model HBCx-9 at the indicated doses and schedules. C, Antitumor combination efficacy and relative body weight losses are dependent on sequence of AZD6738 administration relative to carboplatin. Dosing on days after carboplatin is required for efficacy. Mean tumor volume ± SEM is shown. Body weight loss for combination with carboplatin is also dependent on sequence of administration, with animals with dosing on days after carboplatin experiencing more, but recoverable body weight losses. Mean body weights at time of treatment relative to starting weights are shown. Statistical differences were assessed on day 7 and day 21 nadir's only. D–F, Efficacy in vivo for irinotecan in combination with AZD6738 in human colorectal cell line xenograft Colo205 using AZD6738 (D) was dosed after irinotecan, low-dose AZD6738 was dosed once daily concurrently with irinotecan (E), or low-dose AZD6738 (F) was dosed twice daily concurrently after twice weekly irinotecan. Mean tumor volume ± SEM is shown. **, P ≤ 0.01; ***, P ≤ 0.001.
Figure 5. AZD6738 combination with the PARP inhibitor olaparib. A, AZD6738 potentiates the activity of olaparib and shows synergistic growth inhibition of BRCA1-mutant (Δ11q) UWB1.289 cells preferentially over UWB1.289+BRCA1–complemented cells. Representative growth inhibition plots are shown. B, Metaphase spreads for AZD6738 and olaparib combination shows a synergistic increase in chromosomal aberrations in UWB1.289 compared with UWB1.289+BRCA1–complemented cells. C and D, In vivo efficacy of olaparib in combination with AZD6738 in TNBC PDX models using 50 mg/kg once daily olaparib plus 25 mg/kg AZD6738 on 5 days-on/2 days-off weekly schedule (×6) in HBCx-9 BRCA WT (C) or HBCx-10 BRCA2-mutant model (D). Mean tumor volume ± SEM is shown. Olaparib and AZD6738 combination pharmacodynamics by IHC in HBCx-9 WT and HBCx-10 BRCA2-mutant models. E–H, Representative images at 6 hours post last dose (left) and quantification (% positive cells; right) for γH2AX in HBCx-9 (E) or HBCx-10 (F), and pRAD50 pSer635 in HBCx-9 (G) or HBCx-10 (H) models. Scale bars, 100 μm. *, P ≤ 0.05; **, P ≤ 0.01; ***, P ≤ 0.001; ****, P ≤ 0.0001.
Figure 5.
AZD6738 combination with the PARP inhibitor olaparib. A, AZD6738 potentiates the activity of olaparib and shows synergistic growth inhibition of BRCA1-mutant (Δ11q) UWB1.289 cells preferentially over UWB1.289+BRCA1–complemented cells. Representative growth inhibition plots are shown. B, Metaphase spreads for AZD6738 and olaparib combination shows a synergistic increase in chromosomal aberrations in UWB1.289 compared with UWB1.289+BRCA1–complemented cells. C and D,In vivo efficacy of olaparib in combination with AZD6738 in TNBC PDX models using 50 mg/kg once daily olaparib plus 25 mg/kg AZD6738 on 5 days-on/2 days-off weekly schedule (×6) in HBCx-9 BRCA WT (C) or HBCx-10 BRCA2-mutant model (D). Mean tumor volume ± SEM is shown. Olaparib and AZD6738 combination pharmacodynamics by IHC in HBCx-9 WT and HBCx-10 BRCA2-mutant models. E–H, Representative images at 6 hours post last dose (left) and quantification (% positive cells; right) for γH2AX in HBCx-9 (E) or HBCx-10 (F), and pRAD50 pSer635 in HBCx-9 (G) or HBCx-10 (H) models. Scale bars, 100 μm. *, P ≤ 0.05; **, P ≤ 0.01; ***, P ≤ 0.001; ****, P ≤ 0.0001.
Figure 6. AZD6738 combination with the PARP inhibitor olaparib efficacy using alternative dose schedules. A, HBCx-10 BRCA-mutant TNBC PDX efficacy when AZD6738 is dosed 3 days-on/4 days-off in combination with low-dose olaparib either on a 5 days-on/2 days-off or continuous daily dosing backbone. B, HBCx-10 BRCA-mutant TNBC PDX when AZD6738 is dosed on 3 days-on/4 days-off in combination with high-dose olaparib on a 5 days-on/2 days-off schedule. C, HBCx-9 BRCA WT TNBC PDX model efficacy when low-dose AZD6738 is dosed twice daily in combination with high-dose olaparib on continuous daily schedule. Mean tumor volume ± SEM is shown. **, P ≤ 0.01; ***, P ≤ 0.001.
Figure 6.
AZD6738 combination with the PARP inhibitor olaparib efficacy using alternative dose schedules. A, HBCx-10 BRCA-mutant TNBC PDX efficacy when AZD6738 is dosed 3 days-on/4 days-off in combination with low-dose olaparib either on a 5 days-on/2 days-off or continuous daily dosing backbone. B, HBCx-10 BRCA-mutant TNBC PDX when AZD6738 is dosed on 3 days-on/4 days-off in combination with high-dose olaparib on a 5 days-on/2 days-off schedule. C, HBCx-9 BRCA WT TNBC PDX model efficacy when low-dose AZD6738 is dosed twice daily in combination with high-dose olaparib on continuous daily schedule. Mean tumor volume ± SEM is shown. **, P ≤ 0.01; ***, P ≤ 0.001.

References

    1. Cimprich KA, Cortez D. ATR: an essential regulator of genome integrity. Nat Rev Mol Cell Biol 2008;9:616–27. - PMC - PubMed
    1. Forment JV, O'Connor MJ. Targeting the replication stress response in cancer. Pharmacol Ther 2018;188:155–67. - PubMed
    1. Foote KM, Lau A, Nissink JW. Drugging ATR: progress in the development of specific inhibitors for the treatment of cancer. Future Med Chem 2015;7:873–91. - PubMed
    1. Sundar R, Brown J, Ingles Russo A, Yap TA. Targeting ATR in cancer medicine. Curr Probl Cancer 2017;41:302–15. - PubMed
    1. Barnieh FM, Loadman PM, Falconer RA. Progress towards a clinically successful ATR inhibitor for cancer therapy. Curr Res Pharmacol Drug Discov 2021;2:100017. - PMC - PubMed

Publication types

MeSH terms