. 2022 Jan 25;13(1):494.
doi: 10.1038/s41467-022-28062-9.

Characterization of the COPD alveolar niche using single-cell RNA sequencing

Affiliations

Characterization of the COPD alveolar niche using single-cell RNA sequencing

Maor Sauler et al. Nat Commun. .

Abstract

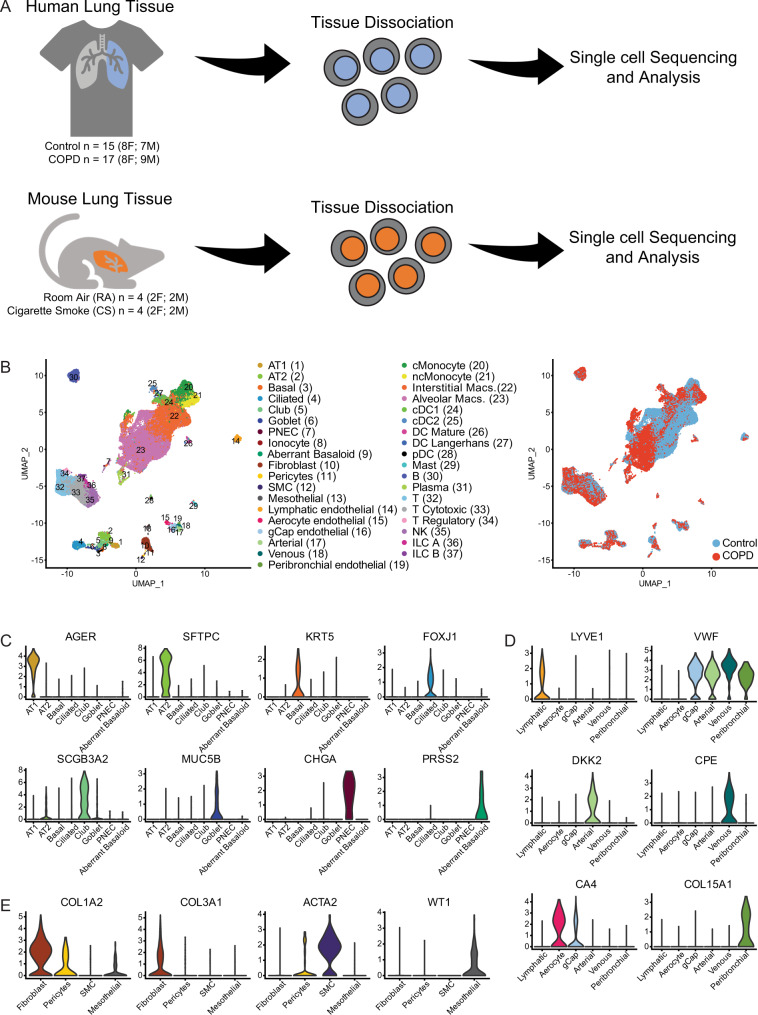
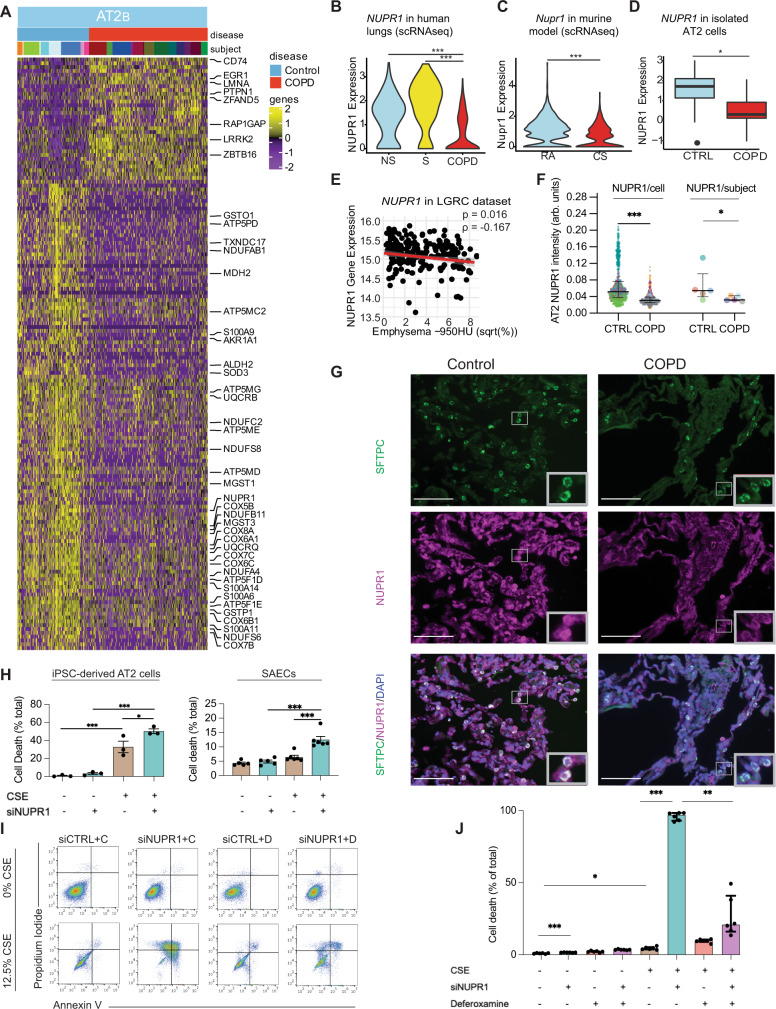
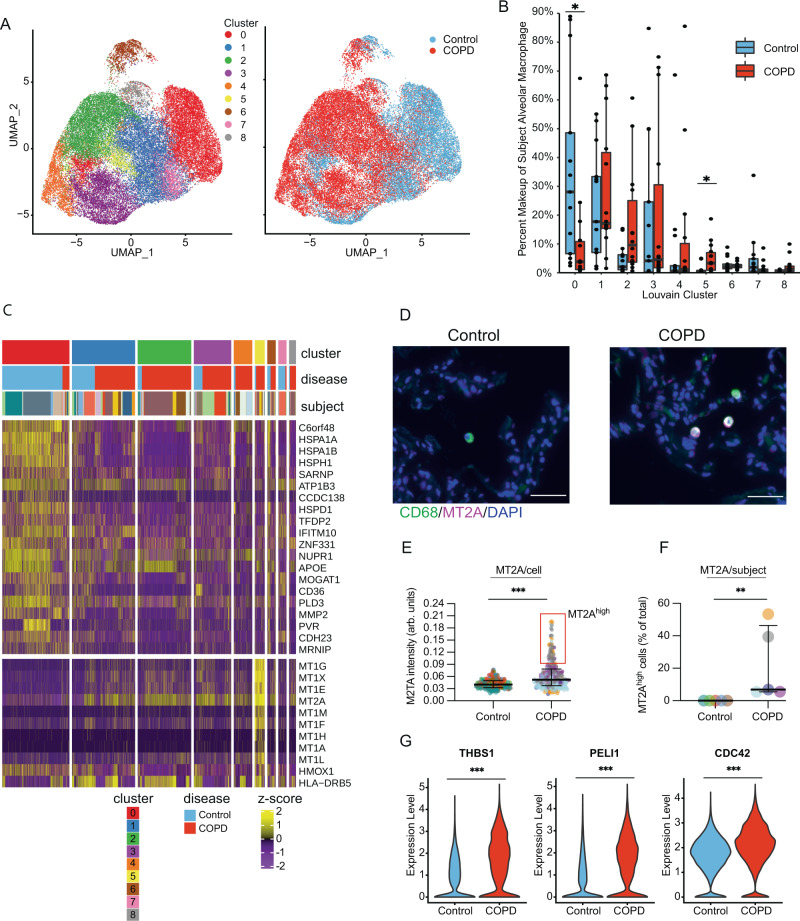
Chronic obstructive pulmonary disease (COPD) is a leading cause of death worldwide, however our understanding of cell specific mechanisms underlying COPD pathobiology remains incomplete. Here, we analyze single-cell RNA sequencing profiles of explanted lung tissue from subjects with advanced COPD or control lungs, and we validate findings using single-cell RNA sequencing of lungs from mice exposed to 10 months of cigarette smoke, RNA sequencing of isolated human alveolar epithelial cells, functional in vitro models, and in situ hybridization and immunostaining of human lung tissue samples. We identify a subpopulation of alveolar epithelial type II cells with transcriptional evidence for aberrant cellular metabolism and reduced cellular stress tolerance in COPD. Using transcriptomic network analyses, we predict capillary endothelial cells are inflamed in COPD, particularly through increased CXCL-motif chemokine signaling. Finally, we detect a high-metallothionein expressing macrophage subpopulation enriched in advanced COPD. Collectively, these findings highlight cell-specific mechanisms involved in the pathobiology of advanced COPD.


Conflict of interest statement

N.K. reports personal fees from Biogen Idec, Boehringer Ingelheim, Third Rock, Samumed, Numedii, Astra Zeneca, Life Max, Tervnce, RohBar, and Pliant. Equity in Pliant. Collaboration with Miragen, Astra Zeneca. Grant from Veracyte, all outside the submitted work; In addition, N.K. has a patent New Therapies in Pulmonary Fibrosis, and a patent for Peripheral Blood Gene Expression licensed to Biotech. L.E.N. reports grants from Humacyte Inc., outside the submitted work. E.A.A. and S.G.C. report personal fees from Novartis Institutes of BioMedical Research, outside the submitted work. K.H.J. and P.N.T. are employed by Intomics. The remaining authors declare no competing interests.

Figures

Fig. 1
Fig. 1. Profiling of cell types in COPD using scRNAseq data.
A Overview of project design. Tissue from 17 lungs with advanced COPD and 15 control donor lungs were dissociated into single-cell suspensions. Individual cells were barcoded and sequenced for analysis. Similarly, lung tissue from 2 male (M) and 2 female (F) mice exposed to 10 months of cigarette smoke (CS) and 2 M and 2 F mice exposed only to room air (RA) were dissociated into single-cell suspensions, barcoded, and sequenced for analysis. B Uniform Manifold Approximation and Projection (UMAP) representation of 111,540 single cells grouped into 37 distinct cell types (left) with identification of COPD and control cells (right). Violin plots of normalized expression values for canonical cell-specific marker genes for C epithelial, D endothelial, and E stromal cells. AT1 alveolar epithelial type I cells, AT2 alveolar epithelial type II cells, PNEC pulmonary neuroendocrine cells, SMC smooth muscle cells, gCap general capillary, cMonocyte classical monocytes, ncMonocyte non-classical monocyte, Macs. macrophages, DC dendritic cells, cDC conventional dendritic cells, pDC plasmacytoid dendritic cells, NK natural killer cells, ILC innate lymphoid cells.
Fig. 2
Fig. 2. COPD epithelial cells and the importance of AT2B cells in COPD pathogenesis.
A UMAP of epithelial cells from COPD and control donor lungs. Samples are color labelled by cell type (left) and disease category (right). Alveolar type II (AT2) cells can be distinguished as two clusters denoted as AT2S and AT2B. B Distribution of subject-specific epithelial cell types as a fraction of the total number of epithelial cells as assessed by single-cell RNA sequencing (scRNAseq) of 17 lungs with advanced COPD and 15 control donor lungs. Boxes represent median and interquartile ranges (IQRs), whiskers are 1.5 × IQR, and dots represent subjects outside the IQR range. C Dot plot of z-scores for marker gene expression values. Dot size reflects percentage of cells with gene expression; color corresponds to the magnitude of gene expression. D Immunofluorescence staining for pro-surfactant protein C (SFTPC) (green), in situ hybridization for HHIP mRNA(purple), and DAPI (blue) in normal human lung tissue samples. Bar = 100 μm. Original magnification ×20. Results are representative of 5 different samples. E Pearson coefficients of genes correlated with HHIP expression in isolated AT2 cells (x-axis) and fold change of differentially expressed genes between AT2B and AT2S cells in our scRNAseq dataset (y-axis) (P < 0.05 using two-sided Wilcoxon rank-sum test with Bonferroni correction). F Number of differentially expressed genes between control and COPD across epithelial cell types (P < 0.05 using two-sided Wilcoxon rank-sum test with Bonferroni correction. G Plot of negative log adjusted P-values for cell-type-specific enrichment for GWAS-identified genes with polymorphisms associated with lung function (continuous FEV1/FVC) (x-axis) and presence of COPD (FEV1/FVC < 70) (y-axis).
Fig. 3
Fig. 3. Aberrant AT2B cellular stress response in COPD.
A Heatmap of z-scores for differentially expressed genes between control and COPD for AT2B cells (P < 0.05, two-sided Wilcoxon rank-sum test with Bonferroni correction). Each column represents expression values for an individual cell. Columns are hierarchically ordered by disease phenotype and subject, in which disease category and individual subject are represented by unique colors. z-scores were calculated across all epithelial cells. B NUPR1 expression in AT2B cells from human subjects as assessed by single-cell RNA sequencing (scRNAseq) from former smokers with COPD (n = 17), non-smokers without COPD (NS) (n = 11), and former/current smokers without COPD (S) (n = 4). P = 2.57 × 10−8 (COPD vs. S) and P = 3.33 × 10−14 (COPD vs. NS). C Nupr1 expression in AT2 cells from mice exposed to room air (RA) or cigarette smoke (CS) as assessed by scRNAseq (n = 4/group). P = 5.18 × 10−25. D NUPR1 expression in fluorescence-activated cell sorted (FACS) AT2 cells from control (CTRL) (n = 16) and COPD (n = 10) subjects. Boxes represent median and interquartile ranges (IQRs), whiskers are 1.5 × IQR, and dots represent subjects. P = 0.0356. E Two-sided unadjusted Spearman correlation of NUPR1 expression with the square root (sqrt) of radiographic emphysema in lung tissue samples from the LGRC cohort (n = 208). F Quantification of NUPR1 immunostaining in SFTPC+ AT2 cells in lung tissue from CTRL and COPD lung tissue samples (n = 5/group). Each color represents an individual subject. Shown is NUPR1 intensity per AT2 cell (P < 1.00 × 10−15) and mean AT2 NUPR1 intensity per subject (P = 0.0317) (n = 744 control cells and 662 COPD cells from 5 subjects per group). G Sample immunostaining for NUPR1 (purple), SFTPC (green), and DAPI (blue). Bar = 100 μm. Original magnification ×20. Images representative of 5 control and 5 COPD samples. H Percent cell death in induced pluripotent stem cell (iPSC)-derived AT2 cells grown at air-liquid interface and small airway epithelial cells (SAECs) treated with NUPR1 silencing RNA (siNUPR1) vs. silencing control RNA (siCTRL) and exposed to 0% or 12.5% cigarette smoke extract (CSE) (n = 3/group for iPSC-derived AT2 cells, 5/group for SAECs exposed to 0% CSE, and 6/group for SAECs exposed to 12.5% CSE). I, J Flow cytometric detection of propidium iodide (PI) and Annexin V and quantification of cell death (Annexin V+ and/or PI+) in A549 cells exposed to 0% or 12.5% CSE, treated with siNUPR1 vs. siCTRL and deferoxamine mesylate (D) vs. vehicle control (C) (n = 6/group). *P < 0.05, **P < 0.005, ***P < 0.0001 using a two-sided Wilcoxon rank-sum test with Bonferroni correction (B, C), unadjusted two-sided Wilcoxon rank-sum test (D, F), or two-way ANOVA with Tukey post-hoc test (H, J). Data are presented as median ± interquartile range (F, H, J).
Fig. 4
Fig. 4. COPD endothelial cell types demonstrate universal and cell-type-specific transcriptional aberrations.
A UMAPs of all vascular endothelial (VE) and lymphatic endothelial cells from control and COPD subjects. UMAPs are color labelled by cell type (top) and disease status (bottom). B UpSet plot visualizing the properties of intersecting and unique sets of differentially expressed (DE) genes between COPD and control amongst endothelial (two-sided Wilcoxon rank-sum test, unadjusted P < 0.001, minimal fold change > 0.5). C Heatmap of corresponding differentially expressed genes between COPD and control amongst six subtypes of endothelial cells. Each column represents expression values for an individual cell. Columns are hierarchically ordered by endothelial subtype, disease phenotype, and then subject. Gray row (top): expression values for marker genes are unity normalized between 0 and 1 across all endothelial subtypes. Orange row (middle): z-scores of differentially expressed genes in three or more endothelial cell types between control and COPD. Yellow row (middle): z-scores of differentially expressed genes in both aerocyte and gCap cells between control and COPD. Blue and green row (bottom): z-scores of differentially expressed genes unique to aerocytes (blue) or gCap (green). Unity normalization and z-score calculations were performed using all endothelial subtypes.
Fig. 5
Fig. 5. Alveolar niche networks and pathway centrality analyses.
A Network plots of the alveolar niche in control (left) and COPD (right). Each node represents a cell population and each internodal edge reflects ligand–receptor interactions between cell types. The edge weight (thickness) between nodes reflects the sum of individual edge weights (nondirected) which are based on the product of ligand–receptor gene expression values, while the size of the node reflects measurements of Kleinberg centrality which prioritizes cell types responsible for incoming (authority) and outgoing (hub) cell–cell signaling. Individual cell types are labelled by color and number. B Centrality analysis of the alveolar connectome for CXCL signaling between control and COPD. Dot size is proportional to the Kleinberg scores for each cell type within CXCL signaling. Panel shows outgoing edge weights and Kleinberg hub scores (left) and incoming edge weights and Kleinberg authority scores (right). Individual cell types are color labelled as in panel A, and numbers shown identify cell types with the largest Kleinberg centrality score. ***P < 0.0001 using a two-sided Durbin test to compare control and COPD across cell types. C Differential circos plots for outgoing gCap CXCL signaling from human and mouse connectomes. Edge thickness is proportional to perturbation scores, defined as the product of the absolute values of the log-fold change for both the receptor and ligand. CXCL differential network analysis limited to edges in which both ligand and receptor expression are increased. D Immunofluorescence staining for PRX (green), NOSTRIN (green or aqua), in situ hybridization for CXCL12 mRNA (red), and DAPI (blue) in normal and COPD human lung tissue samples. Bar = 100 μm. Original magnification ×20. Images representative of 5 control and 5 COPD samples.
Fig. 6
Fig. 6. Changes in alveolar macrophage population composition in COPD.
A UMAPs of control and COPD alveolar macrophage cells color labelled by Louvain cluster (left) and disease status (right). B Percent makeup of alveolar macrophage across all nine Louvain clusters per subject, as assessed by single-cell RNA sequencing (scRNAseq) from 14 lungs with advanced COPD and 13 control donor lungs. Boxes represent median and interquartile ranges (IQRs), whiskers are 1.5 × IQR, and dots represent subjects. P = 0.0281(cluster-0) and 0.0231 (cluster-5). C Heatmap of the distribution of z-scores of marker genes for cluster-0 and cluster-5 alveolar macrophages (*P < 0.05, two-sided Wilcoxon rank-sum test with Bonferroni correction). Columns represent expression values from individual cells and are hierarchically ordered by macrophages cluster, disease status, and subject. D Sample immunofluorescence images of MT2A (purple) in CD68+ cells (green) in control and COPD lung tissue samples (arrows). Arrows point to colocalization of MT2A and CD68 (white). Scale bar = 50 µm. Original magnification of cropped image = ×20. Images representative of 5 control and 5 COPD samples. E Quantification of MT2A immunofluorescence staining in CD68 + cells (n = 233 control cells and 277 COPD cells from 5 subjects/group). Each color represents a different patient. Data are presented as median ± interquartile range. P = 1.39 × 10−13. F Quantification of the percent of MT2Ahigh cells per patient (n = 5/group). Data are presented as median ± interquartile range. P = 0.00794. G Violin plots of THBS1, PELI1, and CDC42 expression in alveolar macrophages in control and COPD subjects. P = 1.57 × 10−31 (THBS1), 2.63 × 10−28 (PELI1), and 5.77 × 10−13 (CDC42). *P < 0.05, **P < 0.005, ***P < 0.0001 using Wilcoxon rank-sum test adjusted for FDR (B), unadjusted two-sided Wilcoxon rank-sum test (E, F), and two-sided Wilcoxon rank-sum with Bonferroni correction (G).

References

    1. Hogg JC, et al. The nature of small-airway obstruction in chronic obstructive pulmonary disease. N. Engl. J. Med. 2004;350:2645–2653. - PubMed
    1. Silverman EK. Genetics of COPD. Annu. Rev. Physiol. 2020;82:413–431. - PMC - PubMed
    1. Tuder RM, Petrache I. Pathogenesis of chronic obstructive pulmonary disease. J. Clin. Invest. 2012;122:2749–2755. - PMC - PubMed
    1. Barnes PJ, et al. Chronic obstructive pulmonary disease. Nat. Rev. Dis. Primers. 2015;1:15076. - PubMed
    1. Kusko RL, et al. Integrated genomics reveals convergent transcriptomic networks underlying chronic obstructive pulmonary disease and idiopathic pulmonary fibrosis. Am. J. Respir. Crit. Care Med. 2016;194:948–960. - PMC - PubMed

Publication types

MeSH terms