. 2022 Jan 25;13(1):477.
doi: 10.1038/s41467-022-27976-8.

PHOSPHATE STARVATION RESPONSE transcription factors enable arbuscular mycorrhiza symbiosis

Affiliations

PHOSPHATE STARVATION RESPONSE transcription factors enable arbuscular mycorrhiza symbiosis

Debatosh Das et al. Nat Commun. .

Abstract

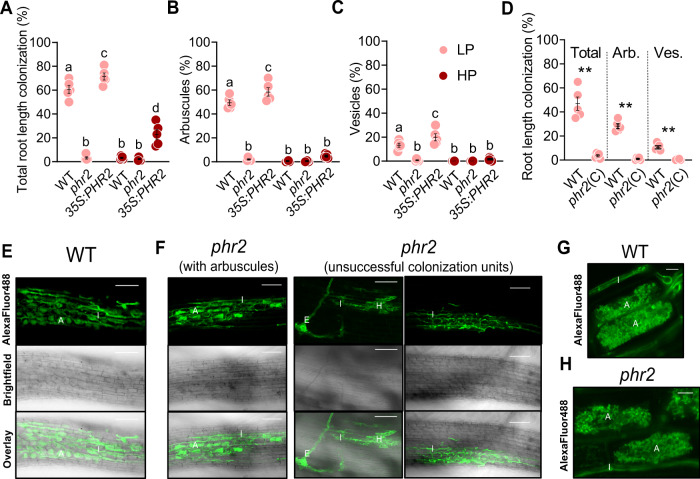
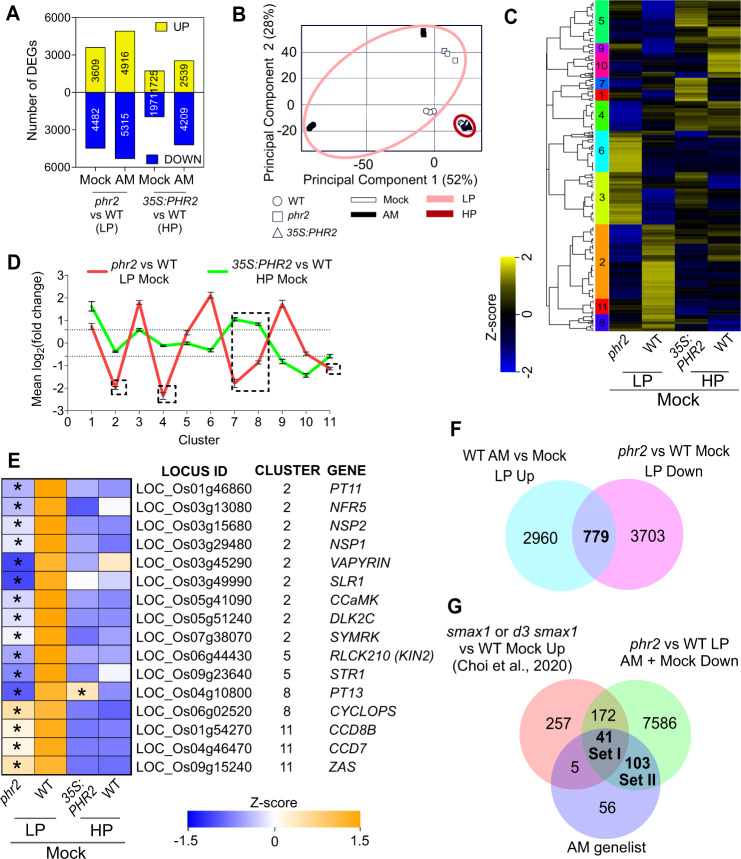
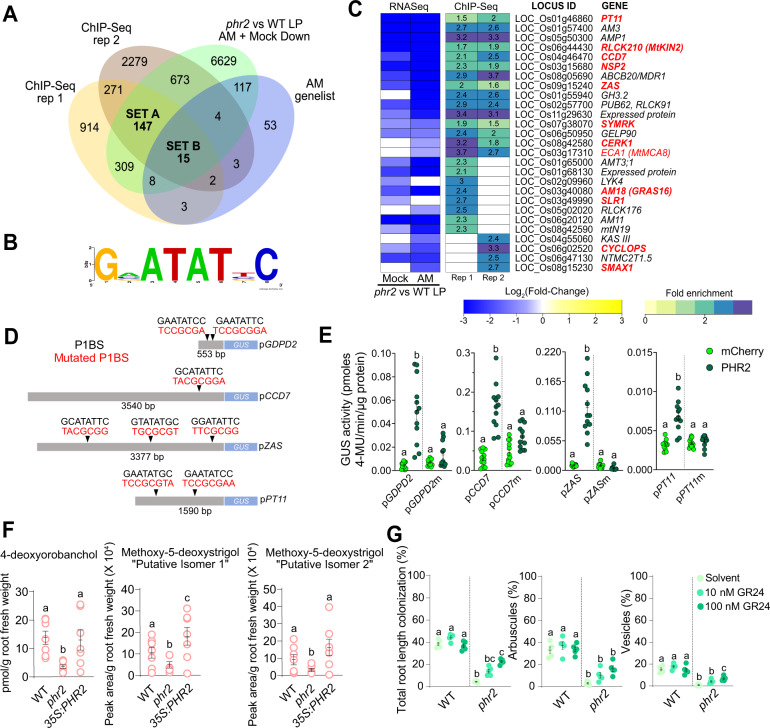
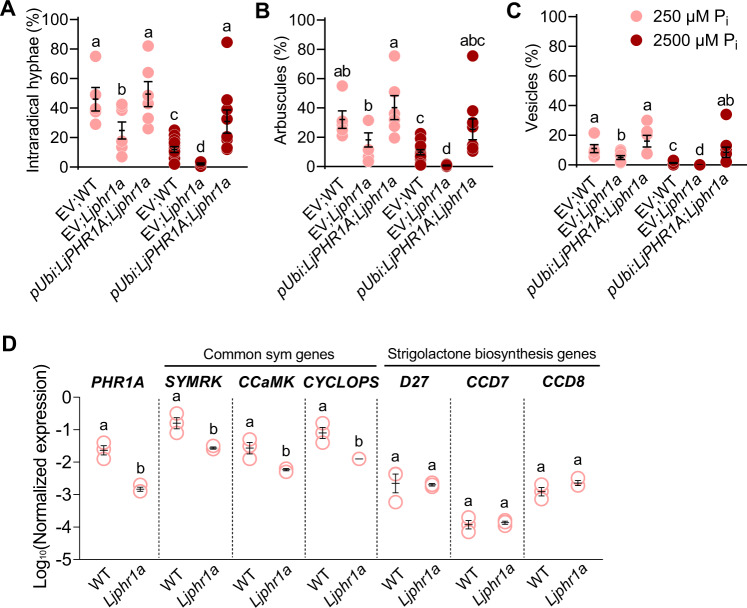
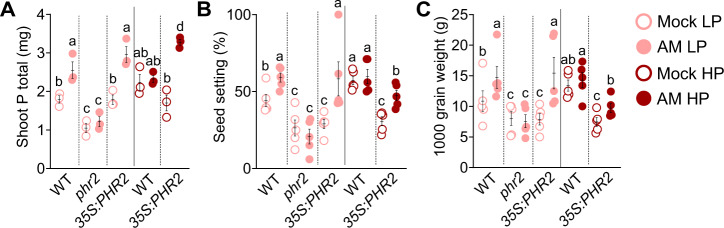
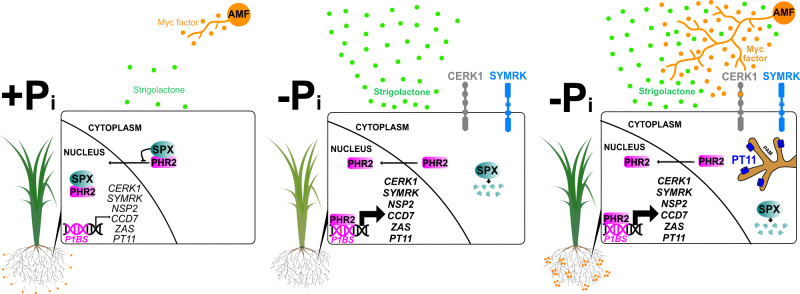
Arbuscular mycorrhiza (AM) is a widespread symbiosis between roots of the majority of land plants and Glomeromycotina fungi. AM is important for ecosystem health and functioning as the fungi critically support plant performance by providing essential mineral nutrients, particularly the poorly accessible phosphate, in exchange for organic carbon. AM fungi colonize the inside of roots and this is promoted at low but inhibited at high plant phosphate status, while the mechanistic basis for this phosphate-dependence remained obscure. Here we demonstrate that a major transcriptional regulator of phosphate starvation responses in rice PHOSPHATE STARVATION RESPONSE 2 (PHR2) regulates AM. Root colonization of phr2 mutants is drastically reduced, and PHR2 is required for root colonization, mycorrhizal phosphate uptake, and yield increase in field soil. PHR2 promotes AM by targeting genes required for pre-contact signaling, root colonization, and AM function. Thus, this important symbiosis is directly wired to the PHR2-controlled plant phosphate starvation response.


Conflict of interest statement

The authors declare no competing interests.

Figures

Fig. 1
Fig. 1. Effect of PHR2 mutation and overexpression on root colonization by AM fungi.
Percent root length colonization (RLC) total (A), arbuscules (B), and vesicles (C) of the indicated genotypes inoculated with R. irregularis (AMF) for 7 weeks at low phosphate (25 µM Pi, LP) or high phosphate (500 µM Pi, HP). D Percent RLC of the indicated genotypes inoculated with AMF for 7 weeks at LP. Arb.: Arbuscules; Ves.: Vesicles. Confocal images of AMF in roots of wild type (E) and phr2 (F). Arbuscule phenotype in wild type (G) and phr2 (H) roots. E, extraradical hypha; H, hyphopodium; I, intraradical hypha; A, arbuscule. Scale-bars: E, F: 100 μm and G, H: 10 μm. Statistics: Individual data points and mean ± SE are shown. AC N = 5 independent plants; Brown-Forsythe and Welch’s One-Way ANOVA test with Games–Howell’s multiple comparisons test. Different letters indicate statistical differences. D N = 5 independent plants; Mann–Whitney test (two-tailed) between phr2(C) and wild type for Total (p = 0.0079), arbuscules (p = 0.0079) and vesicles (p = 0.0079). Asterisks indicate significance of difference: ** p ≤ 0.01. EH The phenotype was observed in 11 (6 + 5) independent plants in two independent experiments.
Fig. 2
Fig. 2. The PHR2-dependent transcriptome of non-colonized roots contains genes required for AM development.
A Number of up- and downregulated differentially expressed genes (DEGs) in phr2 vs WT (LP) and 35S:PHR2 vs WT (HP) for mock or R. irregularis-inoculated plants. B PCA plot for the transcriptome of indicated samples. C Hierarchical clustering of combined DEGs from mock-inoculated roots using normalized counts. Colored bars on the left of the heatmap depict individual clusters (based on the dendrogram). Z-scores represent scaled normalized counts. D Mean log2FC of phr2 vs WT (LP) and 35S:PHR2 vs WT (HP) for clusters obtained in (C). Dotted lines indicate mean log2FC values of −0.585 and 0.585 (used as a cut-off for selecting DEGs). Dashed boxes highlight the mean log2FC of clusters with overall reduced transcript accumulation in phr2 vs WT. E Z-scores for a subset of genes from (C) previously reported being functionally required in AM. Asterisks indicate that the gene is a DEG in the phr2 vs WT (LP) or 35S:PHR2 vs WT (HP) comparisons. F Venn diagram showing overlap of DEGs with increased transcript accumulation in wild type ‘AM vs Mock’ and DEGs with reduced transcript accumulation in ‘phr2 vs WT’ in Mock at LP. G Venn diagram showing the intersection of DEGs with reduced transcript accumulation in the ‘phr2 vs WT’ comparison for mock and AMF-inoculated samples with AM genelist (Supplementary Data 4) and DEGs upregulated in either smax1 (vs WT) or d3 smax1 (vs WT) Mock. Statistics: Mean ± SE are shown in (D) where N = Number of genes in each cluster as obtained in (C). Error bars represent the SE of the mean.
Fig. 3
Fig. 3. PHR2 targets important AM symbiosis genes.
A Overlap of PHR2 ChIP-Seq targets with RNASeq DEGs displaying reduced expression in Mock and AM roots of phr2 vs WT roots grown at LP and with AM genelist (Supplementary Data 4). B Consensus PHR2-binding motif for Set A + Set B genes based on ‘RSAT Plants’ oligo-analysis. C Fold change of RNAseq-based transcript accumulation in Mock and AM roots of phr2 vs WT grown at LP (left) and ChIP-Seq fold enrichment for PHR2 binding (right) for the 27 genes hit in at least one ChIP-Seq replicate and overlapping with phr2 vs WT down and AM genelist. Genes with assigned functional roles in AM, based on mutant phenotypes are displayed in red (bold for mutants, regular font for RNAi lines). D Illustration of promoters used in transactivation assays with positions of PHR1 binding site (P1BS) elements (black) and mutated P1BS elements (red). E PHR2 transactivates the promoters of GDPD2, CCD7, ZAS, and PT11 (553, 3540, 3377, and 1590 bp upstream of ATG, respectively) in a P1BS element-dependent manner in Nicotiana benthamiana leaves. promoter:GUS fusions were co-transformed with 35S:PHR2 or 35S:mCherry (negative control). ‘m’ indicates that all P1BS elements in the promoter were mutated. Individual dots show GUS activity in protein extracts from leaf disks from four independent plants. GUS: β-glucuronidase. F Quantity of 4-deoxyorobanchol and two isomers of methoxy-5-deoxystrigol in the root exudates of WT, phr2, and 35S:PHR2 grown at LP. G Percent root length colonization total (left), arbuscules (middle), and vesicles (right) of the indicated genotypes inoculated with R. irregularis for 6 weeks at low phosphate (25 µM Pi) and treated with 0.02% acetone solvent or the synthetic SL analog rac-GR24. Statistics: Individual data points and mean ± SE are shown. E N = 11–12 biological replicates representing independent Agrobacterium infiltrations, one per leaf into 3 leaves of 4 individual plants; Kruskal–Wallis test with Dunn’s posthoc comparison. F N = 6–7 independent plants; Brown–Forsythe and Welch’s One-Way ANOVA test with Games–Howell’s multiple comparisons test. G N = 5 independent plants; Brown–Forsythe and Welch’s One-Way ANOVA test with Games–Howell’s multiple comparisons test.
Fig. 4
Fig. 4. PHR1A is required for full colonization of Lotus japonicus roots by R. irregularis.
Percent intraradical hyphae (A), arbuscules (B), and vesicles (C) of hairy roots for indicated genotypes inoculated with R. irregularis (AMF) for 4 weeks at 250 µM Pi or 2500 µM Pi. EV, empty vector. D Relative transcript accumulation in mock-inoculated (Mock) hairy roots of the indicated genotypes in parallel with the experiment in Fig. 5A–C. Statistics: Individual data points and mean ± SE are shown. AC N = 5–13 independent plants; Brown–Forsythe and Welch’s One-Way ANOVA test with Games–Howell’s multiple comparisons test. Different letters indicate statistical differences between the samples. D N = 3 independent root systems; Mann–Whitney test (two-tailed). Different letters indicate statistical differences between statistical groups.
Fig. 5
Fig. 5. PHR2 affects AM-mediated phosphate uptake and yield in field soil.
A Total shoot phosphorus (mg), B seed setting, and C 1000 grain weight of the indicated genotypes inoculated with R. irregularis (AM) or non-inoculated (Mock) and grown at LP (unfertilized) or HP (fertilized with superphosphate fertilizer, P2O5). Plants were grown in a greenhouse in soil from the Longhua field base in Shenzhen, China, and harvested at 110 days post transplanting (dpt) for trait quantification. Statistics: Individual data-points and mean ± SE are shown. N = 3–5 independent plants; Brown–forsythe and Welch’s One-Way ANOVA test with Games–Howell’s multiple comparison test was carried out. Different letters indicate statistical differences between genotypes and treatments.
Fig. 6
Fig. 6. Model depicting regulation of AM symbiosis by PHR2.
When plants obtain sufficient phosphate (left), SPX proteins prevent nuclear translocation of PHR2, as well as PHR2 binding to promoters of phosphate starvation -induced genes including AM relevant genes,. This causes low exudation of strigolactone and poor expression of genes required for perception of Myc-Factors and fungal entry, thereby preventing full symbiosis development. Upon phosphate starvation, SPX proteins, are degraded. Consequently, PHR2 is active, can bind to P1BS elements in promoters, and transcriptionally activate genes important for AM, such as CCD7 involved in strigolactone biosynthesis for activation of the fungus in the rhizosphere prior to contact, genes encoding receptors involved in the perception of fungal signals prior to root contact such as CERK1 and SYMRK,,,, the transcription factor NSP2, ZAS involved in apocarotenoid biosynthesis promoting root colonization, and the AM-specific phosphate transporter gene PT11 (localized to the peri-arbuscular membrane (PAM)) required for Pi uptake from the fungus. (For simplicity, we focus here on 6 genes with important and genetically determined roles in AM that have been recovered in both ChIP-Seq replicates Fig. 3C, and were confirmed by ChIP-qPCR, Supplementary Fig. 17). Consequently, at low phosphate, roots exude increased amounts of strigolactone and can perceive fungal signals (middle), the fungus is activated to colonize the roots and the symbiosis can function through nutrient transporters localizing to the peri-arbuscular membrane (right). Thus, symbiosis establishment appears to be enabled as a part of the PHR2-regulated phosphate starvation response.

References

    1. Chiu CH, Paszkowski U. Mechanisms and impact of symbiotic phosphate acquisition. Cold Spring Harbor Perspect. Biol. 2019;11:a034603. - PMC - PubMed
    1. Gianinazzi S, et al. Agroecology: The key role of arbuscular mycorrhizas in ecosystem services. Mycorrhiza. 2010;20:519–530. - PubMed
    1. Smith SE, Smith FA, Jakobsen I. Mycorrhizal fungi can dominate phosphate supply to plants irrespective of growth responses. Plant Physiol. 2003;133:16–20. - PMC - PubMed
    1. Balzergue C, Chabaud M, Barker DG, Bécard G, Rochange SF. High phosphate reduces host ability to develop arbuscular mycorrhizal symbiosis without affecting root calcium spiking responses to the fungus. Front. Plant Sci. 2013;4:426. - PMC - PubMed
    1. Breuillin F, et al. Phosphate systemically inhibits development of arbuscular mycorrhiza in Petunia hybrida and represses genes involved in mycorrhizal functioning. Plant J. 2010;64:1002–1017. - PubMed

Publication types