. 2022 Jan 25;13(1):493.
doi: 10.1038/s41467-022-28040-1.

Focused ultrasound excites cortical neurons via mechanosensitive calcium accumulation and ion channel amplification

Affiliations

Focused ultrasound excites cortical neurons via mechanosensitive calcium accumulation and ion channel amplification

Sangjin Yoo et al. Nat Commun. .

Abstract

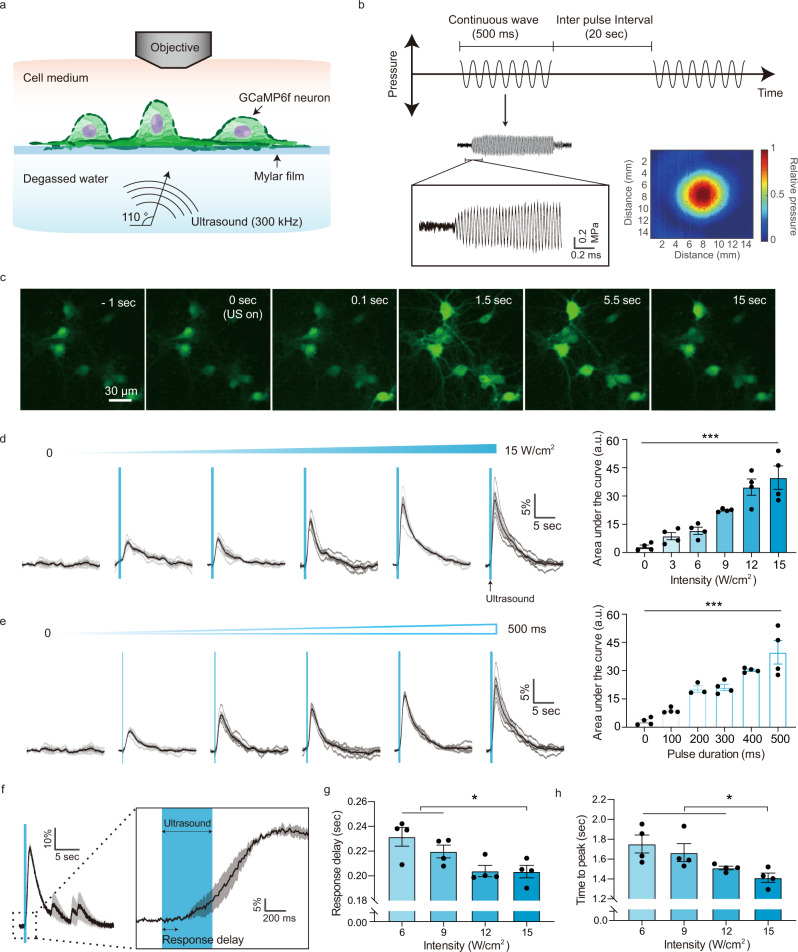
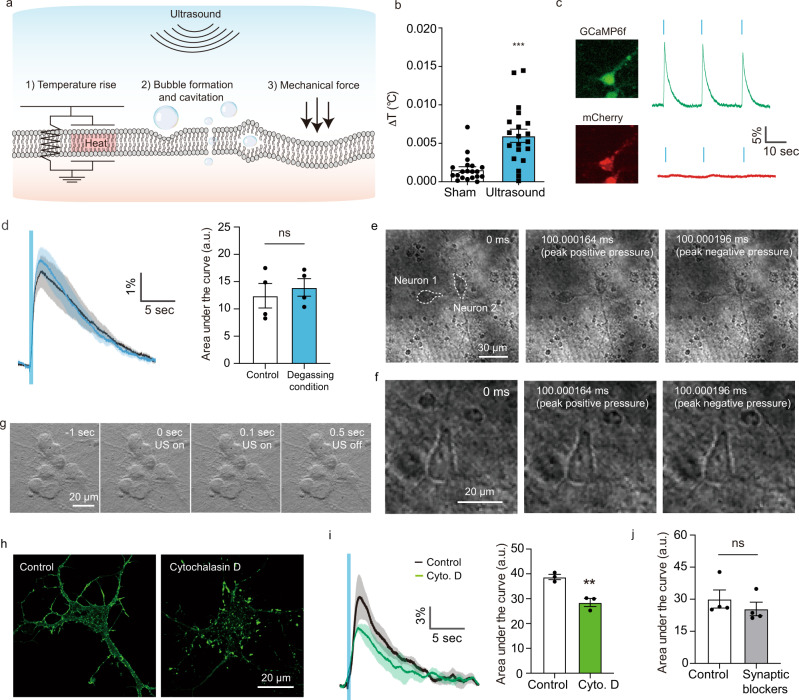
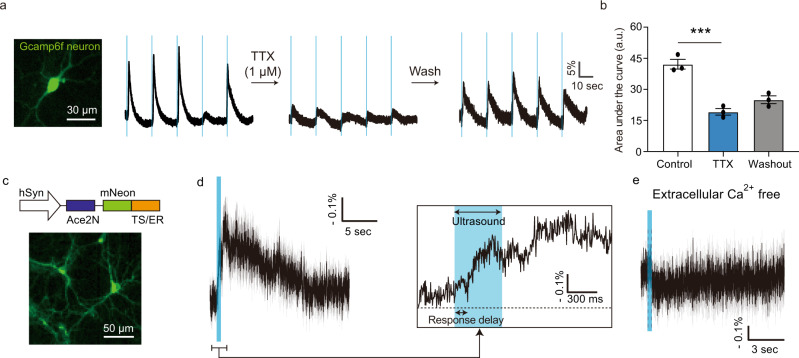
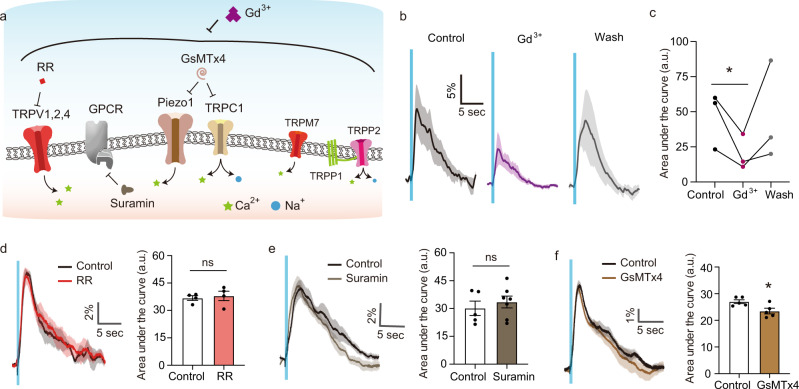
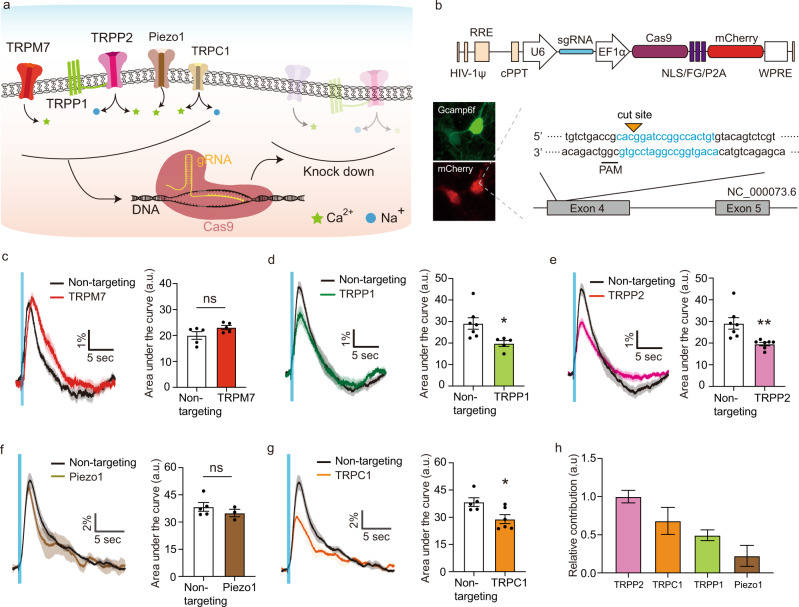
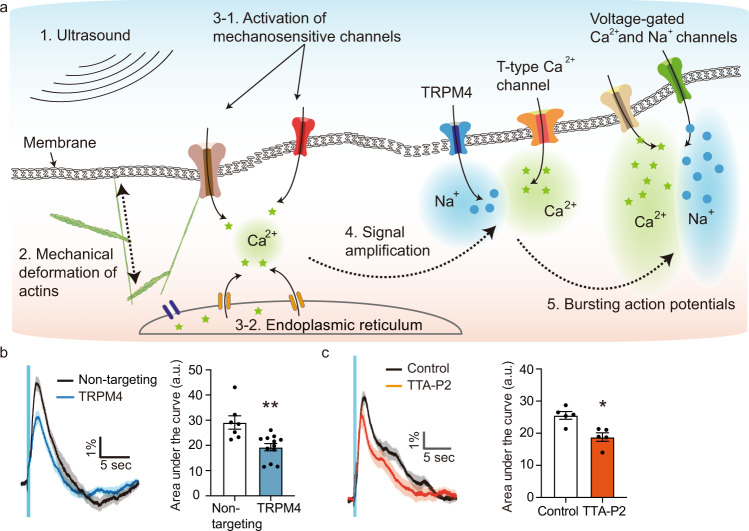
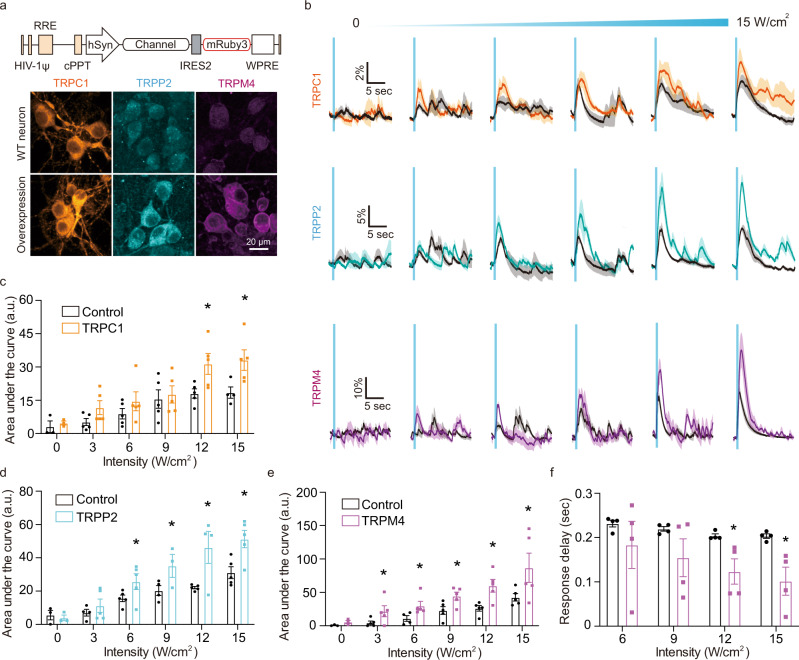
Ultrasonic neuromodulation has the unique potential to provide non-invasive control of neural activity in deep brain regions with high spatial precision and without chemical or genetic modification. However, the biomolecular and cellular mechanisms by which focused ultrasound excites mammalian neurons have remained unclear, posing significant challenges for the use of this technology in research and potential clinical applications. Here, we show that focused ultrasound excites primary murine cortical neurons in culture through a primarily mechanical mechanism mediated by specific calcium-selective mechanosensitive ion channels. The activation of these channels results in a gradual build-up of calcium, which is amplified by calcium- and voltage-gated channels, generating a burst firing response. Cavitation, temperature changes, large-scale deformation, and synaptic transmission are not required for this excitation to occur. Pharmacological and genetic inhibition of specific ion channels leads to reduced responses to ultrasound, while over-expressing these channels results in stronger ultrasonic stimulation. These findings provide a mechanistic explanation for the effect of ultrasound on neurons to facilitate the further development of ultrasonic neuromodulation and sonogenetics as tools for neuroscience research.


Conflict of interest statement

The authors declare no competing interests.

Figures

Fig. 1
Fig. 1. Cultured cortical neurons are excited by focused ultrasound stimulation.
a Illustration of the focused ultrasound stimulation setup. Angled ultrasound waves (300 kHz) are delivered to GCaMP6f-expressing neurons cultured on an acoustically transparent mylar film, while the neural calcium response is recorded by epifluorescence imaging. b Schematic of the acoustic waveform applied to neurons and representative focal pressure waveform measured by a hydrophone. Temporal offset from the rectangular waveform (signal from function generator) reflects the focal length of the transducer. The colormap shows the spatial profile of the acoustic pressure at the ultrasound focus, with a full-width at half-maximal diameter 5.2 mm. c Representative time lapse images of GCaMP6f fluorescence before, during and after an ultrasound stimulation (15 W/cm2, 500 ms pulse duration at 0 s). d Calcium responses and quantification of neural response as function of ultrasound intensity (n = 4 independent experiments each, one-way ANOVA p < 0.0001) and e pulse duration (n = 4 independent experiments each, one-way ANOVA p < 0.0001). f A representative single cell response to ultrasound. g Quantification of response onset time (n = 4 independent experiments each, one-way ANOVA p = 0.0117, Tukey’s post comparison) and h time to peak (n = 4 independent experiments each, one-way ANOVA p = 0.0190, Tukey’s post comparison). Individual traces are gray solid, their mean trace is black solid, and SEM is shaded. Bar graph values represent mean ± SEM.
Fig. 2
Fig. 2. Ultrasound excites neurons through direct mechanical effects.
a Illustration of the potential biophysical effects of ultrasound. b Temperature increase measured using an optic hydrophone thermometer positioned near the neurons during ultrasound stimulation (n = 20, 15 W/cm2, 500 ms pulse duration with 20 s inter-pulse interval, Unpaired T-test, two-tailed, p < 0.0001). c Fluorescence images of a neuron co-expressing GCaMP6f (green) and mCherry (red) and changes in their respective fluorescence in response to ultrasound stimulation. d Calcium responses to ultrasound in freshly degassed media (n = 4 independent experiments each, unpaired t-test, two-tailed, p = 0.6033). e Ultra-high-speed imaging (5 Mfps) of neurons and surrounding media during ultrasound stimulation. Image recording was started 100 ms after the onset of ultrasound. f Ultra-high-speed imaging of a single neuron during ultrasound stimulation at higher magnification. g Bright field imaging of neurons over the full time course of the ultrasound stimulation. h Images of individual neurons with the F-actin label Alexa-Fluor 488 phalloidin before and after treatment with cytochalasin D. i Calcium responses before and after cytochalasin D treatment, and quantification of area under the curve (n = 3 independent experiments, unpaired t-test, two-tailed, p = 0.0061). j Quantification of area under the curve after applying the synaptic blockers AP5 and CNQX (1 μM each, n = 4 independent experiments, paired T-test, two-tailed, p = 0.4128). Mean trace is solid and SEM is shaded. Bar graph values represent mean ± SEM.
Fig. 3
Fig. 3. Ultrasound response is mediated by the entry of extracellular calcium.
a Calcium responses from a single neuron during ultrasound stimulation before, during and after treatment with the sodium channels blocker tetrodotoxin (TTX). b Quantification of area under the curve before, during and after TTX treatment (n = 3 independent experiments, one-way ANOVA p = 0.0004, Tukey’s post comparison (control vs. TTX)). c Diagram of the Ace2N voltage indicator genetic construct and representative fluorescence image of neurons transfected with this construct. d Voltage responses to ultrasound. (n = 4 independent experiments). e Voltage responses of neurons in calcium-free media (n = 2 independent experiments). Mean trace is solid and SEM is shaded. Bar graph values represent mean ± SEM.
Fig. 4
Fig. 4. Pharmacological inhibition of mechanosensitive receptors.
a Schematic of neuronal mechanosensitive receptors and strategies to block them. Gadolinium (Gd3+, 20 μM) was used to block the mechanosensitive channels nonspecifically. Pores of TRPV1, 2 and 4 channels were blocked by ruthenium red (RR, 1 μM). Activation of GPCRs was inhibited by suramin (60 μM). Gating of Piezo1 and TRPC1 channels was inhibited by GsMTx4 (10 μM). b Calcium responses before, during and after treatment with Gd3+. c Average calcium response under each condition (n = 3 independent experiments, Paired T-test, two-tailed, p = 0.0884). d Calcium responses before and after treatment with RR (n = 3 independent experiments, unpaired t-test, p = 0.6930). e Calcium responses before and after treatment with suramin (n = 5 independent experiments for control, and seven independent experiments for suramin, unpaired t-test, two-tailed, p = 0.5159). f Calcium responses before and after treatment with GsMTx4 (n = 5 independent experiments each, unpaired t-test, two-tailed, p = 0.0245). Mean trace is solid and SEM is shaded. Bar graph values represent mean ± SEM.
Fig. 5
Fig. 5. CIRSPR/Cas9 knockdown of mechanosensitive ion channels.
a Schematic of the strategy to knockdown individual ion channels using CRISPR/Cas9. b Schematic of the gene construct for the CRISPR knockdown. A sgRNA was designed to target each channel and delivered to neurons via lentivirus. c Calcium responses from wild-type neurons and neurons treated with CRISPR/Cas9 for TRPM7 knock down (n = 5 independent experiments each, Unpaired t-test, two-tailed, p = 0.1073). d Calcium responses from wild type neurons and modified neurons with CRISPR/Cas9 for TRPP1 knock down (n = 7 independent experiments for control, and five independent experiments for TRPP1, Unpaired t-test, two-tailed, p = 0.0208). e Calcium responses from wild type neurons and modified neurons with CRISPR/Cas9 for TRPP2 knock down (n = 7 independent experiments each, Unpaired t-test, two-tailed, p = 0.0084). f Calcium responses from wild type neurons and modified neurons with CRISPR/Cas9 for Piezo1 knock down (n = 5 independent experiments for control, and three independent experiments for Piezo1, Unpaired t-test, two-tailed, p = 0.3727). g Calcium responses from wild type neurons and modified neurons with CRISPR/Cas9 for TRPC1 knock down (n = 5 independent experiments for control, and 6 independent experiments for TRPC1, Unpaired t-test, two-tailed, p = 0.0232). h Relative contribution of each channel to the ultrasound-evoked calcium response (normalized ΔΔF/CRISPR efficiency, n = 7 (TRPP2), 6 (TRPC1), 5 (TRPP1), 3 (Piezo1)). Control is non-targeting sgRNA. Mean trace is solid and SEM is shaded in time courses. Bar graph values represent mean ± SEM.
Fig. 6
Fig. 6. Neuronal response to ultrasound is amplified by calcium-gated and voltage-gated ion channels.
a Illustration of the molecular pathway activated by ultrasound. b Calcium responses from wild type neurons and modified neurons with CRISPR/Cas9 for TRPM4 knock down (n = 7 independent experiments for control, and 12 independent experiments for TRPM4, Unpaired T-test, two-tailed, p = 0.0024). c Calcium responses before and after treatment with the t-type calcium channel blocker TTA-P2 (3 μM, n = 5 independent experiments, paired T-test, two-tailed, p = 0.0331). Mean trace is solid and SEM is shaded. Bar graph values represent mean ± SEM.
Fig. 7
Fig. 7. Neuronal response to ultrasound is enhanced by overexpression of mechanosensitive and amplifier channels.
a Schematic of genetic constructs for overexpressing TRPC1, TRPP2, and TRPM4 and representative immunostaining images for the channels with and without overexpression. b Calcium responses from wild type neurons and overexpressing neurons as function of ultrasound intensity and quantification of area under the curve for c TRPC1 (n = 5 independent experiments each, Unpaired T-test, two-tailed, p = 0.0316 (12 W/cm2), p = 0.0369 (15 W/cm2)), d TRPP2 (n = 5 independent experiments each, Unpaired T-test, two-tailed, p = 0.0855 (6 W/cm2), p = 0.0795 (9 W/cm2), p = 0.0105 (12 W/cm2), p = 0.0127 (15 W/cm2)), and e TRPM4 (n = 5 independent experiments each, Unpaired t-test, two-tailed, p = 0.0815 (3 W/cm2), p = 0.0578 (6 W/cm2), p = 0.0317 (9 W/cm2), p = 0.0114 (12 W/cm2), p = 0.0841 (15 W/cm2)). f Comparison of response delay of calcium response between wild type and TRPM4-overexpressing neurons (n = 5 independent experiments each, Unpaired T-test, two-tailed, p = 0.0321 (12 W/cm2), p = 0.0442 (15 W/cm2)). Mean trace is solid and SEM is shaded. Bar graph values represent mean ± SEM.

References

    1. Wagner T, Valero-Cabre A, Pascual-Leone A. Noninvasive human brain stimulation. Annu. Rev. Biomed. Eng. 2007;9:527–565. - PubMed
    1. Tufail Y, et al. Transcranial pulsed ultrasound stimulates intact brain circuits. Neuron. 2010;66:681–694. - PubMed
    1. Kim H, et al. Noninvasive transcranial stimulation of rat abducens nerve by focused ultrasound. Ultrasound Med. Biol. 2012;38:1568–1575. - PMC - PubMed
    1. King RL, Brown JR, Newsome WT, Pauly KB. Effective parameters for ultrasound-induced in vivo neurostimulation. Ultrasound Med. Biol. 2013;39:312–331. - PubMed
    1. Ye PP, Brown JR, Pauly KB. Frequency Dependence of ultrasound neurostimulation in the mouse brain. Ultrasound Med. Biol. 2016;42:1512–1530. - PMC - PubMed

Publication types

MeSH terms