Multicenter Study
. 2022 Jan 25;13(1):446.
doi: 10.1038/s41467-021-27797-1.

Immunoglobulin signature predicts risk of post-acute COVID-19 syndrome

Affiliations
Multicenter Study

Immunoglobulin signature predicts risk of post-acute COVID-19 syndrome

Carlo Cervia et al. Nat Commun. .

Abstract

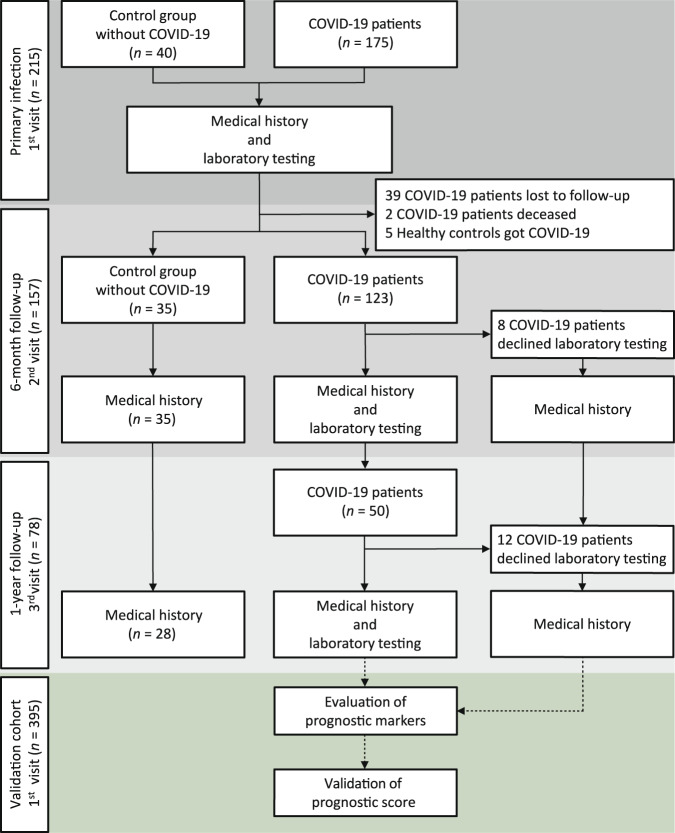
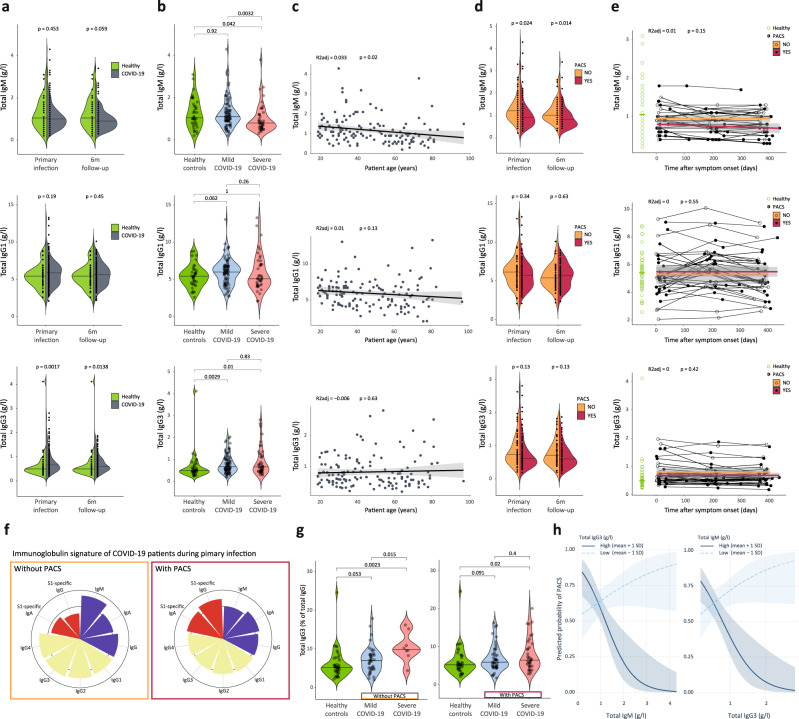
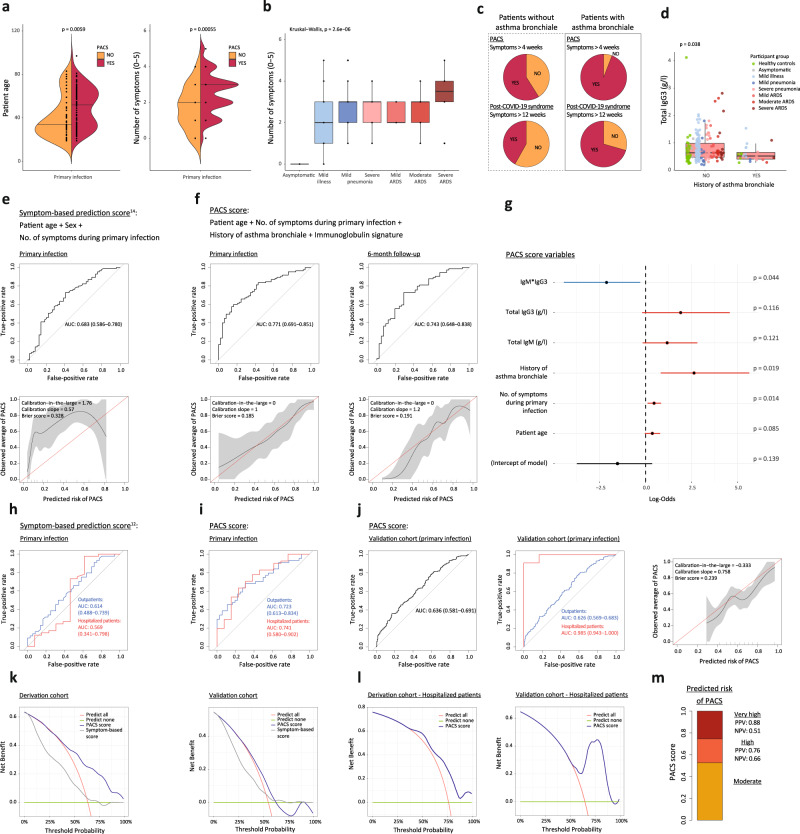
Following acute infection with severe acute respiratory syndrome coronavirus 2 (SARS-CoV-2) a significant proportion of individuals develop prolonged symptoms, a serious condition termed post-acute coronavirus disease 2019 (COVID-19) syndrome (PACS) or long COVID. Predictors of PACS are needed. In a prospective multicentric cohort study of 215 individuals, we study COVID-19 patients during primary infection and up to one year later, compared to healthy subjects. We discover an immunoglobulin (Ig) signature, based on total IgM and IgG3 levels, which - combined with age, history of asthma bronchiale, and five symptoms during primary infection - is able to predict the risk of PACS independently of timepoint of blood sampling. We validate the score in an independent cohort of 395 individuals with COVID-19. Our results highlight the benefit of measuring Igs for the early identification of patients at high risk for PACS, which facilitates the study of targeted treatment and pathomechanisms of PACS.


Conflict of interest statement

The authors declare no competing interests.

Figures

Fig. 1
Fig. 1. Flow chart of COVID-19 patients and healthy controls enrolled in the study.
Flow chart of individuals with confirmed SARS-CoV-2 infection (COVID-19 patients; n = 175) and healthy controls (Control group; n = 40) with no history of COVID-19-related symptoms, a negative SARS-CoV-2 S1-specific immunoassay, no history of autoimmune disease, and no active illness prior to blood sampling. Medical history and a blood sample were obtained at the first visit (n = 175), corresponding to primary SARS-CoV-2 infection in COVID-19 patients, second visit (n = 123) at about 6 months after primary infection (6-month follow-up), and third visit (n = 50) at about one year after primary infection. At 6-month follow-up, n = 39 patients declined follow-up or were unreachable, n = 2 patients deceased, and n = 5 healthy controls got COVID-19. At 6-month follow-up n = 8 and at 1-year follow-up n = 12 patients only declined laboratory testing. n = 134 patients were followed-up at least once, including 11 patients that only attended a 1-year follow-up. Healthy controls were clinically followed-up after 6 months (n = 35) and 1 year (n = 28). Data were validated in a separate validation cohort of n = 395 individuals with confirmed COVID-19 that were followed up for 6 months.
Fig. 2
Fig. 2. Specific and total immunoglobulins at primary infection and follow-up.
a and b Total serum concentrations of IgM, IgG1, and IgG3 in healthy controls (n = 40) versus (a) all (n = 134 at primary infection; n = 115 at 6-month follow-up) or (b) mild and severe COVID-19 cases at indicated timepoints (n = 89 and 45 respectively). c Ig titers at primary infection as a function of age in COVID-19 patients (n = 134), with adjusted R2 (R2adj) and p values of linear models (shown with 95% confidence interval [CI]). d Ig signatures in patients without and with PACS, during primary infection (n = 49 and 85 respectively) and 6-month follow-up (n = 41 and 74 respectively). e Ig titers in patients attending all follow-up visits (n = 34) as a function of days after symptom onset, with R2adj and p values of generalized additive model (shown with 95% CI). Corresponding patients without (circles) and with PACS (dots) are connected, with a spline visualized for both groups. Green horizontal line indicates median in healthy controls. f Radar plots with wedge sizes representing median Ig concentrations of patients without and with PACS (n = 49 and 85 respectively), normalized to median concentrations of all patients. g IgG3 percentages of total IgG in healthy controls (n = 40) and mild and severe COVID-19 cases without (left; n = 41 and 8, respectively) and with PACS (right; n = 48 and 37, respectively) during primary infection. h Interaction plot showing the conditional effects of IgM and IgG3 titers on the predicted probability of PACS in patients with high or low Ig titers (mean ± 1 standard deviation [SD]; n = 134, with 85 having PACS), using a logistic regression model (PACS score) adjusted for age, number of symptoms during primary infection, and history of asthma bronchiale (shown with 80% CI for visualization). Variables were compared using a two-sided Wilcoxon’s test.
Fig. 3
Fig. 3. Prediction of post-acute COVID-19 syndrome (PACS) based on clinical features and immunoglobulin signature.
a Age and number of symptoms during primary infection (0–5; fever, fatigue, cough, dyspnea, gastrointestinal symptoms) in patients without or with PACS. b Number of symptoms during primary infection in COVID-19 patients with different disease severities (n = 134, with 85 having PACS). c PACS and post-COVID-19 syndrome in patients without and with history of asthma bronchiale. d IgG3 titers in healthy controls (green symbols) and all COVID-19 patients (n = 215; disease severity indicated by colors) at primary infection, without or with history of asthma bronchiale. e and f Receiver operating characteristic (ROC) curves (top) and calibration plots (bottom) reporting the area under the curve (AUC) with 95% confidence intervals (CI) or calibration-in-the-large, calibration slopes, and Brier scores of logistic regression models for predicting PACS. Use of (e) a symptom-based model and (f) the PACS score on data of our patient cohort at primary infection (e and f, left; n = 134, with 85 having PACS) and after shrinkage of coefficients on 6-month follow-up-data (f, right; n = 115, with 74 having PACS). g Regression coefficients of PACS score with 95% CI and p values. h and i ROC curves reporting AUC with CI of PACS score in outpatients (blue) and hospitalized patients (red) of derivation cohort (n = 80 and 54, with 44 and 41 having PACS, respectively). j Validation of PACS score in independent cohort at primary infection (n = 389, with 212 having PACS) and subgroup analysis in outpatients (blue; n = 372, with 201 having PACS) and hospitalized patients (red; n = 17, with 11 having PACS). k Decision curve analysis of PACS score in derivation (left) and validation cohort (right) comparing the PACS score to a symptom-based score and clinical strategies of predicting none or all subjects with COVID-19 develop PACS. l Decision curve analysis of PACS score in hospitalized patients. m Estimated risk groups based on two probability thresholds (0.523 and 0.746) with corresponding positive (PPV) and negative (NPV) predictive values in the derivation cohort. Boxplots represent median (middle line) with upper and lower quartiles (box limits), and 1.5*interquartile ranges (whiskers). Variables were compared using a two-sided Wilcoxon’s test if not specified otherwise.

References

    1. Wiersinga WJ, Rhodes A, Cheng AC, Peacock SJ, Prescott HC. Pathophysiology, transmission, diagnosis, and treatment of coronavirus disease 2019 (COVID-19): a review. JAMA. 2020;324:782. doi: 10.1001/jama.2020.12839. - DOI - PubMed
    1. Silvin A, et al. Elevated calprotectin and abnormal myeloid cell subsets discriminate severe from mild COVID-19. Cell. 2020;182:1401. doi: 10.1016/j.cell.2020.08.002. - DOI - PMC - PubMed
    1. Schulte-Schrepping J, et al. Severe COVID-19 is marked by a dysregulated myeloid cell compartment. Cell. 2020;182:1419. doi: 10.1016/j.cell.2020.08.001. - DOI - PMC - PubMed
    1. Chevrier S, et al. A distinct innate immune signature marks progression from mild to severe COVID-19. Cell Rep. Med. 2021;2:100166. doi: 10.1016/j.xcrm.2020.100166. - DOI - PMC - PubMed
    1. To KK, et al. Temporal profiles of viral load in posterior oropharyngeal saliva samples and serum antibody responses during infection by SARS-CoV-2: an observational cohort study. Lancet Infect. Dis. 2020;20:565. doi: 10.1016/S1473-3099(20)30196-1. - DOI - PMC - PubMed

Publication types

MeSH terms