. 2022 Jan 25;13(1):480.
doi: 10.1038/s41467-021-27850-z.

A genome-wide association study of serum proteins reveals shared loci with common diseases

Affiliations

A genome-wide association study of serum proteins reveals shared loci with common diseases

Alexander Gudjonsson et al. Nat Commun. .

Abstract

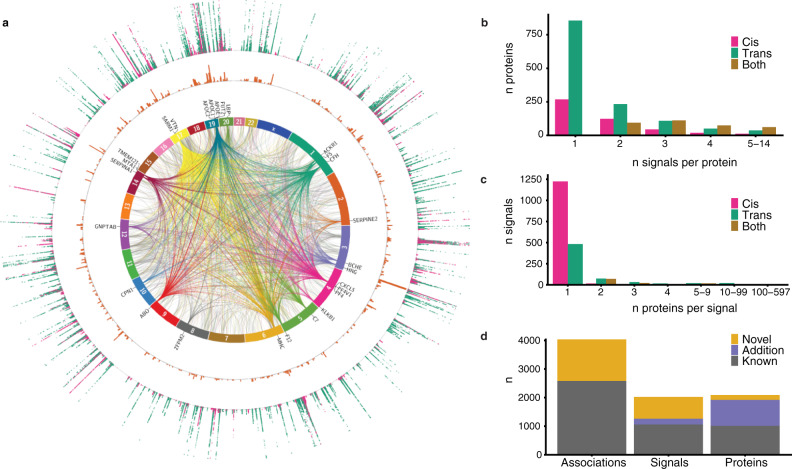
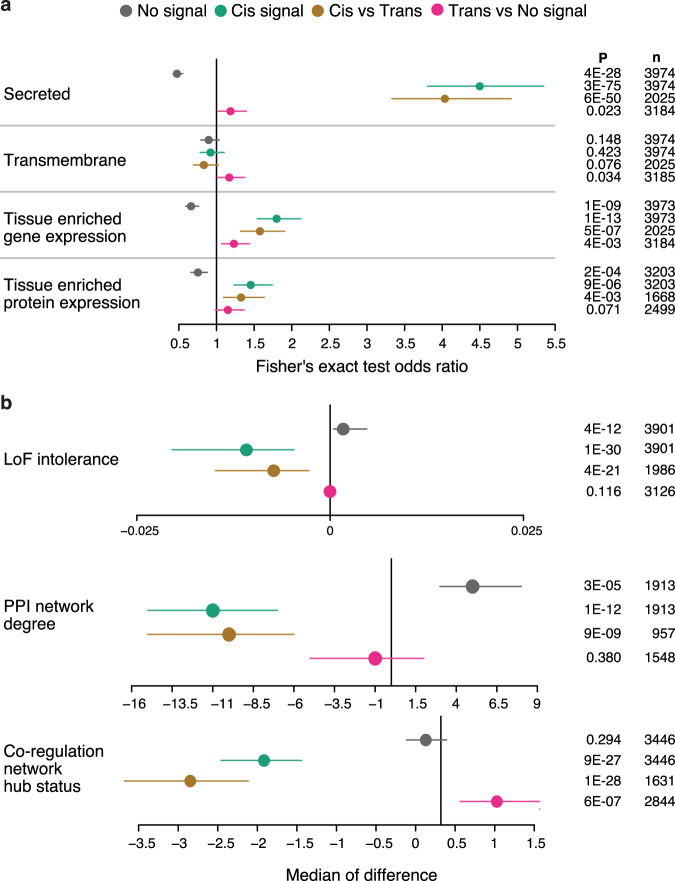
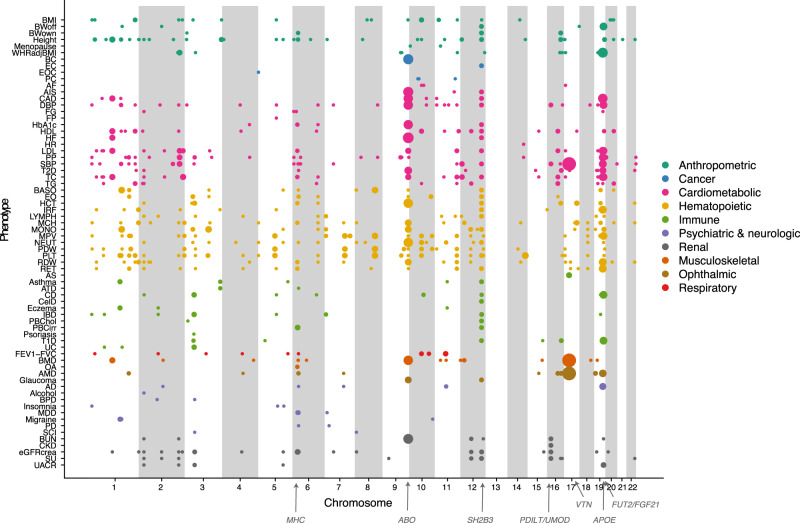
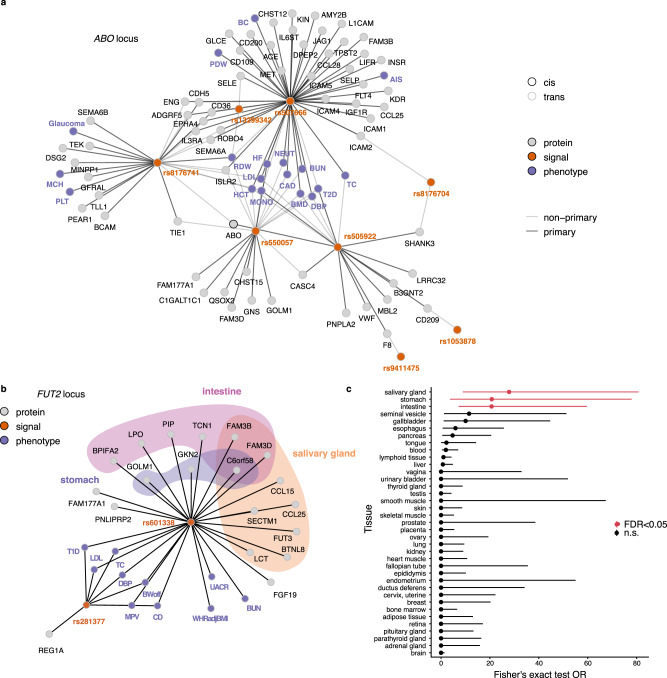
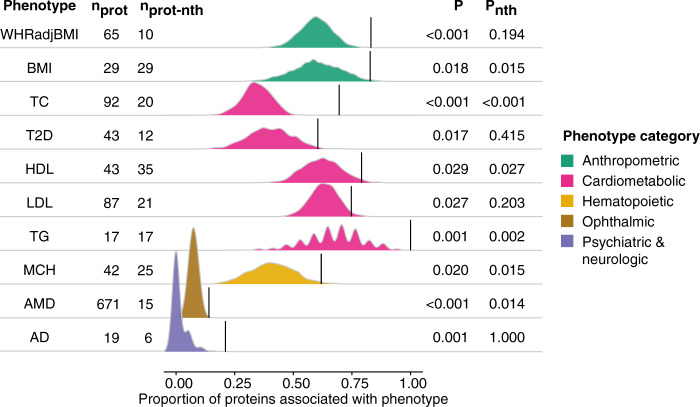
With the growing number of genetic association studies, the genotype-phenotype atlas has become increasingly more complex, yet the functional consequences of most disease associated alleles is not understood. The measurement of protein level variation in solid tissues and biofluids integrated with genetic variants offers a path to deeper functional insights. Here we present a large-scale proteogenomic study in 5,368 individuals, revealing 4,035 independent associations between genetic variants and 2,091 serum proteins, of which 36% are previously unreported. The majority of both cis- and trans-acting genetic signals are unique for a single protein, although our results also highlight numerous highly pleiotropic genetic effects on protein levels and demonstrate that a protein's genetic association profile reflects certain characteristics of the protein, including its location in protein networks, tissue specificity and intolerance to loss of function mutations. Integrating protein measurements with deep phenotyping of the cohort, we observe substantial enrichment of phenotype associations for serum proteins regulated by established GWAS loci, and offer new insights into the interplay between genetics, serum protein levels and complex disease.


Conflict of interest statement

The study was supported by the Novartis Institute for Biomedical Research, and protein measurements for the AGES-Reykjavik cohort were performed at SomaLogic. J.R.L. and L.L.J. are employees and stockholders of Novartis. All other authors have no conflict of interests to declare.

Figures

Fig. 1
Fig. 1. A summary of the findings for genetic associations to 4782 proteins in serum.
a Circos plot showing every study-wide significant variant-protein association from the protein GWAS (linear regression, n = 5368). The innermost layer shows links between independent signals (conditional and joint analysis, GCTA-COJO), and trans gene locations of associated proteins. Trans hotspots are colored by the chromosome they originate from. The second layer states the nearest genes to these trans hotspots. The third layer is a histogram of the distribution of the independent signals, where each bar represents the number of independent signals within 300 kb from each other, values ranging from 1 to 38. The outermost layer is a Manhattan plot for all proteins, P-values ranging from 1 × 10−11 to 1 × 10−300 (capped), colored by cis (pink), or trans (green). b Barplot showing number of proteins, binned by the number of associated independent signals, colored by cis (pink), trans (green) or both (mustard). c Barplot showing number of independent signals, binned by the number of associated proteins, colored by cis (pink), trans (green), or both (mustard). d Barplot showing the number of novel associations compared to similar large-scale genotype-protein association studies.
Fig. 2
Fig. 2. Enrichment analysis comparing characteristics between proteins classified by types of genetic association signals.
See Methods for definitions. a Fisher’s exact test (two-sided) for comparing two classifications. Odds ratio estimates are presented with 95% confidence intervals. b Wilcoxon’s rank-sum test (two-sided) for comparing classifications with continuous traits. Estimates of the median of the difference between values from the two classes are presented with 95% confidence intervals. P-values (two-sided) for significant enrichment of protein-phenotype associations are provided to the right.
Fig. 3
Fig. 3. Overview of colocalization between protein and phenotype associations across the genome.
Each dot represents a genetic locus (genomic location on x-axis) that is associated with a phenotype (y-axis), where the size of the dots indicates the number of colocalized proteins (color PP4 > 0.5). Phenotype abbreviations are available from Supplementary Data 8.
Fig. 4
Fig. 4. An overview of independent genome-wide significant genetic signals.
a Genetic signals (orange nodes), using conditional and joint analysis (GCTA-COJO),, annotated by the SNP with the strongest protein association, at the ABO locus (chr 9, 136,127,268–136,155,127) and their links to proteins (gray nodes) and phenotypes (purple nodes). Edges between genetic signals and proteins indicate primary (dark edges) and secondary (light edges) independent signals from the conditional analysis. Edges between genetic signals and traits indicate that any of the lead pQTL SNPs within that signal reaches P < 5 × 10−8 (two-sided) in GWAS summary statistics for the given trait, and the primary signal is assigned for the trait based on the lowest P-value. b An overview of the independent genome-wide significant genetic signals (orange nodes), annotated by the SNP with the strongest protein association, at the FUT2 locus (chr 19, 49,206,108–49,252,151) and their links to proteins (gray nodes) and the phenotypes they colocalize with (purple nodes). The background color indicates tissue-elevated expression in the salivary gland, intestine or stomach. c Enrichment (Fisher’s exact test, two-sided) of tissue-elevated expression among the 19 proteins regulated by the FUT2 locus where Benjamini–Hochberg FDR < 0.05 is considered significant (red). Here 4016 proteins with available data in the Human Protein Atlas were included. Odds ratio estimates are presented with 95% confidence intervals. Phenotype abbreviations are available from Supplementary Data 8.
Fig. 5
Fig. 5. Enrichment of phenotype associations among sets of colocalized proteins.
The ridgeline plot illustrates for each GWAS phenotype the proportion of colocalized proteins that were significantly associated with the same trait in AGES (linear regression, FDR < 0.05, n = 5457) (black lines) compared to 1000 randomly sampled sets of proteins of the same size (density curves), here showing only those with empirical P < 0.05. See full results in Supplementary Fig. 22. The number of colocalized proteins for each trait are provided on the left-hand side, along with the number of proteins remaining after the removal of proteins originating from loci with 5 or more colocalized proteins from the analysis, annotated as no trans hotspots (nth). Empirical P-values for significant enrichment of trait-associations are shown to the right. WHRadjBMI waist-to-hip ratio adjusted for BMI, TC total cholesterol, T2D type 2 diabetes, HDL high-density lipoprotein cholesterol, LDL low-density lipoprotein cholesterol, TG triglycerides, MCH mean corpuscular hemoglobin, AMD age-related macular degeneration, AD Alzheimer’s disease.
Fig. 6
Fig. 6. Colocalization between GWAS signals for eGFR and INHBB and INHBC.
a Colocalization between GWAS signals (linear regression) at the INHBB locus on chromosome 2 and b the INHBC locus on chromosome 12 and eGFR. The PP4 value indicates the posterior probability for colocalization obtained from colocalization analysis. c A schematic diagram showing the convergence of genetic effects on serum levels of INHBB at the INHBB locus in cis and INHBC locus in trans. Variants in the INHBC locus furthermore affect INHBC serum levels in cis, albeit not reaching study-wide significance (P = 8.5 × 10−8, two-sided). Serum levels of INHBB and INHBC are positively correlated (Pearson’s r = 0.32, P = 3.4 × 10−130, two-sided), while both are negatively associated (linear regression) with eGFR (beta = −4.52, SE = 0.23, P = 1.3 × 10−82, two-sided, and beta = −2.62, SE = 0.22, P = 5.4 × 10−32, two-sided, respectively). d Boxplot showing INHBB serum levels in the AGES cohort (n = 5457) by eGFR quartiles. e Colocalization between a GWAS signals for T2D and a trans signal for ARFIP2 at the PNPLA3 locus on chromosome 22. f Boxplot showing ARFIP2 serum levels in the AGES cohort by T2D status (nT2D = 658, nCTRL = 4799). Boxplots in d and f indicate median value, 25th and 75th percentiles. Whiskers extend to smallest/largest value no further than 1.5× interquartile range. Outliers are shown.

References

    1. Visscher PM, et al. 10 Years of GWAS discovery: biology, function, and translation. Am. J. Hum. Genet. 2017;101:5–22. - PMC - PubMed
    1. Boyle EA, Li YI, Pritchard JK. An expanded view of complex traits: from polygenic to omnigenic. Cell. 2017;169:1177–1186. - PMC - PubMed
    1. Schadt EE. Molecular networks as sensors and drivers of common human diseases. Nature. 2009;461:218–223. - PubMed
    1. Maurano MT, et al. Systematic localization of common disease-associated variation in regulatory DNA. Science. 2012;337:1190–1195. - PMC - PubMed
    1. Farh KKH, et al. Genetic and epigenetic fine mapping of causal autoimmune disease variants. Nature. 2015;518:337–343. - PMC - PubMed

Publication types