. 2022 Jan 25;13(1):481.
doi: 10.1038/s41467-022-28081-6.

Coding and regulatory variants are associated with serum protein levels and disease

Affiliations

Coding and regulatory variants are associated with serum protein levels and disease

Valur Emilsson et al. Nat Commun. .

Abstract

Circulating proteins can be used to diagnose and predict disease-related outcomes. A deep serum proteome survey recently revealed close associations between serum protein networks and common disease. In the current study, 54,469 low-frequency and common exome-array variants were compared to 4782 protein measurements in the serum of 5343 individuals from the AGES Reykjavik cohort. This analysis identifies a large number of serum proteins with genetic signatures overlapping those of many diseases. More specifically, using a study-wide significance threshold, we find that 2021 independent exome array variants are associated with serum levels of 1942 proteins. These variants reside in genetic loci shared by hundreds of complex disease traits, highlighting serum proteins' emerging role as biomarkers and potential causative agents of a wide range of diseases.


Conflict of interest statement

The study was supported by the Novartis Institute for Biomedical Research, and protein measurements for the AGES-RS cohort were performed at SomaLogic. J.R.L. and L.L.J. are employees and stockholders of Novartis. The remaining authors declare no competing interests.

Figures

Fig. 1
Fig. 1. Classification of the target protein population.
The pie chart shows the relative distribution (percentage) of the different protein classes targeted by the present proteomics platform (4137 unique proteins), with secreted proteins (38.4%) and single-pass transmembrane (SPTM) receptors (32.2%) dominating the target protein population. Protein classes were manually curated based on information from the SecTrans, Gene Ontology (GO), and Swiss-Prot databases, and were composed of secreted proteins (e.g., cytokines, adipokines, hormones, chemokines, and growth factors), SPTM receptors (e.g., tyrosine and serine/threonine kinase receptors), multi-pass transmembrane (MPTM) receptors (e.g., GPCR, ion channels, transporters), enzymes (intracellular), kinases, nuclear hormone receptors (NH receptors), structural molecules, transcriptional regulators and signal transducers.
Fig. 2
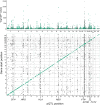
Fig. 2. A graphical representation of all pQTL discoveries in the current study.
The Manhattan plot in the top panel uses precise two-sided P-values as −log(P-value) for the association (linear regression) of low-frequency and common exome array variants to 4782 proteins in serum. The bottom panel shows the genomic locations of all study-wide significant pQTLs (linear regression, P < 1.92 × 10−10, two-sided), also shown in Supplementary Data 1, where the start position of the protein-encoding gene is shown on the y-axis and the location of the pSNP at the x-axis. Cis acting effects, using a 300 kb window, appear at the diagonal while trans acting pQTL effects including trans hot spots show up off-diagonally. The genetic loci highlighted across the x-axis are trans-acting hotspots.
Fig. 3
Fig. 3. Pleiotropy of rs2251219 affects many proteins and disease traits.
The Circos plot highlights the effect of the variant rs2251219 (Supplementary Data 1 and 2) on 13 proteins acting in cis or trans and sharing genetics with various diseases of different etiologies. Only study-wide significant (P < 1.92 × 10−10, two-sided) genotype-to-protein associations (linear regression) are shown. Lines going from rs2251219 show links to genomic locations of the protein-encoding genes associated with the variant while numbers refer to chromosomes. The arrow points to disease-related traits that have previously been linked to rs2251219.
Fig. 4
Fig. 4. Effects of distinct risk loci for LOAD converge on the protein TREM2.
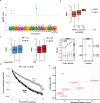
a The Manhattan plot highlights variants at two distinct chromosomes associated with serum TREM2 levels. Study-wide significant associations (linear regressions) at P < 1.92 × 10−10 (two-sided) are indicated by the horizontal line. The y-axis shows the −(log10) of the P-values for the association of each genetic variant on the exome array present along the x-axis. Variants at both chromosomes 6 and 11 associated with TREM2 have been independently linked to risk of LOAD including the rs75932628 (NP_061838.1: p.R47H) in TREM2 at chromosome 6 and the variant rs610932 at chromosome 11. b The boxplot to the left shows that carriers with the p.R47H mutation, which is linked to LOAD, are associated with low TREM2 levels. The boxplot on the right shows the trans effect of the well-established GWAS risk variant rs610932 for LOAD on TREM2 serum levels, where the LOAD risk allele C (highlighted in bold) is associated with lower levels of TREM2. The x-axis of each box plot shows the genotypes for the corresponding protein-associated SNP, while the y-axis denotes the Box–Cox transformed, age, and sex-adjusted serum protein levels. Box plots indicate median (middle line), 25th, 75th percentile (box), and 5th and 95th percentile (whiskers). The P-values (two-sided) shown at the top of each plot come from linear regression analysis. c TREM2p.R47H carriers demonstrated lower survival probability post-incident LOAD compared to TREM2p.R47R carriers (P = 0.04, two-sided). The vertical ticks correspond to individuals lost to follow-up. d Scatterplot for the TREM2 protein supported as having a causal effect on LOAD in a two-sample MR analysis. The figure demonstrates the estimated effects of the respective cis- and trans-acting genetic instruments on the serum TREM2 levels in AGES-RS (x-axis) and risk of LOAD through a GWAS by Kunkle et al. (y-axis), using 21,982 LOAD cases and 41,944 controls. Each data point displays the estimated effect as beta coefficient = log(odds ratio), along with 95% confidence intervals for the SNP effect on disease (vertical lines) or SNP effect on the protein (horizontal lines). The broken line indicates the inverse variance weighted causal estimate (β = −0.240, SE = 0.059, P = 5.3 × 10−5, two-sided), while the dotted line shows the MR-Egger regression (see Supplementary Data 5 for more details).
Fig. 5
Fig. 5. Variants affecting SVEP1 levels are associated with CHD, blood pressure, and T2D.
a The Manhattan plot reveals variants at chromosomes 1 and 9 associated with serum SVEP1 levels. Study-wide significant associations (linear regression, P < 1.92 × 10−10, two-sided) are indicated by the horizontal line. The y-axis shows the −(log10) of the P-values for the association of each genetic variant on the exome array present along the x-axis. b One of the variants associated with SVEP1 levels and underlying the peak at chromosome 9 is the low-frequency CHD risk variant rs111245230 (NP_699197.3: pD2702G). The CHD risk allele C (highlighted in bold) is associated with increased serum SVEP1 levels. The x-axis of the box plot shows the genotypes for the protein-associated SNP, while the y-axis denotes the Box–Cox transformed, age, and sex-adjusted serum protein levels. The P-value (two-sided) shown at the top of the plot is derived from linear regression analysis. Box plots indicate median (middle line), 25th, 75th percentile (box), and 5th and 95th percentile (whiskers). c Serum levels of SVEP1 were associated with incident CHD (P = 8 × 10⁻⁹) and T2D (P = 8 × 10⁻⁵). The P-values (two-sided) at the top of each boxplot for CHD and T2D come from logistic regression. The comparison of protein quintiles of the SVEP1 levels in serum with systolic (SBP) or diastolic (DBP) show a significant positive correlation with SBP (β = 0.210, P = 4 × 10−12, two-sided) but not with DBP (P > 0.05, two-sided). The relationship between the top and bottom quintiles of serum SVEP1 levels and blood pressure is depicted in the right-most panel. The x-axis of the box plots shows the health status of individuals, while the y-axis denotes the Box–Cox transformed, age, and sex-adjusted serum protein levels. Box plots indicate median (middle line), 25th, 75th percentile (box), and 5th and 95th percentile (whiskers). d Consistent with the directionality of the effects described above, we find that elevated levels of SVEP1 were associated with higher rates of mortality post-incident CHD. The Kaplan–Meier plot calculates the hazard ratio (HR) by comparing the 75th and 25th percentiles of SVEP1 serum levels. The vertical ticks correspond to individuals lost to follow-up while the shaded areas indicated the 95% confidence intervals. The P-value (two-sided) and HR are shown at the top of the plot. e Scatterplot for the SVEP1 protein supported as having a causal effect on T2D in a two-sample MR analysis. The figure demonstrates the SNP effect on serum SVEP1 levels (x-axis) and T2D from a GWAS in Europeans (y-axis), with 74,124 T2D patients and 824,006 controls. Each center data point displays the estimated effect as beta coefficient = log(odds ratio), along with 95% confidence intervals for the SNP effect on disease (vertical lines) or SNP effect on the protein (horizontal lines). The broken line indicates the inverse variance weighted causal estimate (β = 0.104, SE = 0.023, P = 5.7 × 10−6, two-sided), while the dotted line demonstrates the MR–Egger regression (see Supplementary Data 5).
Fig. 6
Fig. 6. Proteins associated with malignant melanoma and colorectal cancer.
a The melanoma risk allele A (highlighted in bold) for the variant rs910873 is associated with high serum levels of ASIP. The x-axis of the box plot shows the genotypes for the protein-associated SNP, while the y-axis denotes the Box–Cox transformed, age, and sex-adjusted serum protein levels. Box plots indicate median (middle line), 25th, 75th percentile (box), and 5th and 95th percentile (whiskers). The P-value (two-sided) shown at the top of the plot is from linear regression analysis. b Scatterplot for the ASIP protein supported as having a causal effect on malignant melanoma in a two-sample MR analysis. The figure demonstrates the estimated effects of the respective genetic instruments on the serum ASIP levels in AGES-RS (x-axis) and risk of melanoma in GWAS by UK biobank data (UKB-b-12915) (y-axis), that included 3598 melanoma cases and 459,335 controls. Each center data point displays the estimated effect as beta coefficient = log(odds ratio), along with 95% confidence intervals for the SNP effect on disease (vertical lines) or SNP effect on the protein (horizontal lines). The broken line indicates the inverse variance weighted causal estimate (β = 0.0024, SE = 0.0003, P = 1.1 × 10−17, two-sided), while the dotted line shows the MR-Egger regression (see Supplementary Data 5). c The pQTL rs2241714 is a proxy for colorectal cancer-associated variant rs1800469 (r2 = 0.978) (Supplementary Data 2), located within the gene B9D2 and proximal to TMEM91 which is the reported candidate gene at this locus (see Table 1). The gene encoding TGFB1, a protein linked to rs2241714 in cis, is also nearby. d The variant rs2241714 (and rs1800469) is associated with the serum proteins TGFB1 (in cis), B3GNT8 (in cis), and B3GNT2 (in trans). The P-values (two-sided) shown at the top of each plot are from linear regression analysis. The x-axis of each box plot shows the genotypes for the corresponding protein-associated SNP, while the y-axis denotes the Box–Cox transformed, age, and sex-adjusted serum protein levels. Box plots indicate median (middle line), 25th, 75th percentile (box), and 5th and 95th percentile (whiskers). The chromosomes indicated at the top of each graph correspond to the location of the gene that encodes the protein of interest.

References

    1. Buniello A, et al. The NHGRI-EBI GWAS catalog of published genome-wide association studies, targeted arrays and summary statistics 2019. Nucleic Acids Res. 2019;47:D1005–D1012. - PMC - PubMed
    1. Liu DJ, et al. Exome-wide association study of plasma lipids in >300,000 individuals. Nat. Genet. 2017;49:1758–1766. - PMC - PubMed
    1. Schadt EE. Molecular networks as sensors and drivers of common human diseases. Nature. 2009;461:218–223. - PubMed
    1. Zhang B, et al. Integrated systems approach identifies genetic nodes and networks in late-onset Alzheimer’s disease. Cell. 2013;153:707–720. - PMC - PubMed
    1. Emilsson V, et al. Genetics of gene expression and its effect on disease. Nature. 2008;452:423–U422. - PubMed

Publication types