. 2022 Jan 25;13(1):482.
doi: 10.1038/s41467-022-28157-3.

Regional excess mortality during the 2020 COVID-19 pandemic in five European countries

Affiliations

Regional excess mortality during the 2020 COVID-19 pandemic in five European countries

Garyfallos Konstantinoudis et al. Nat Commun. .

Abstract

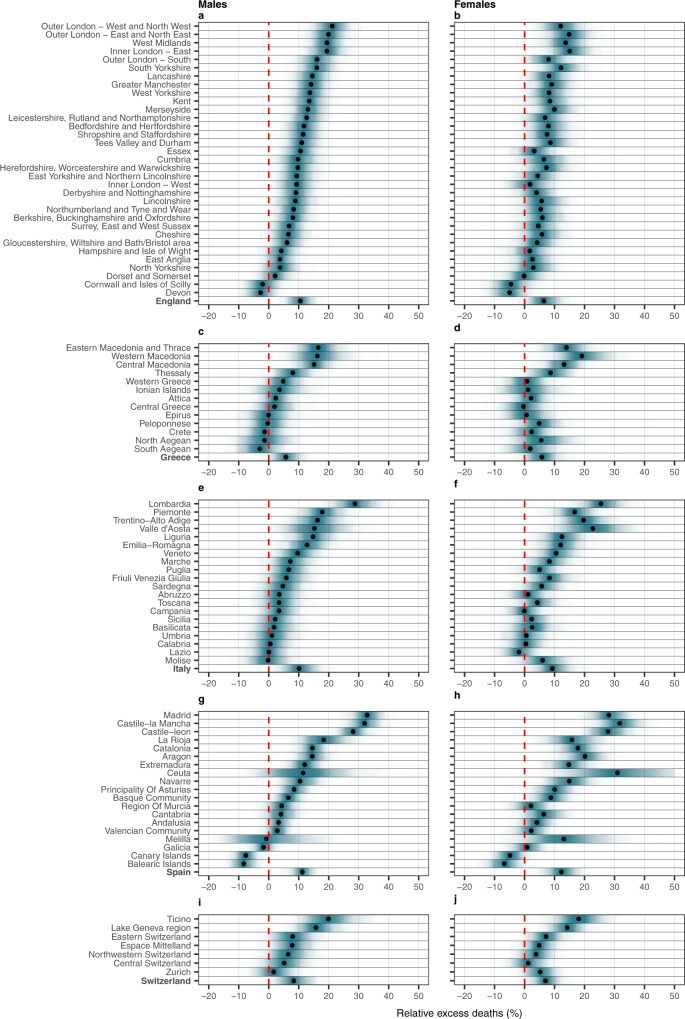
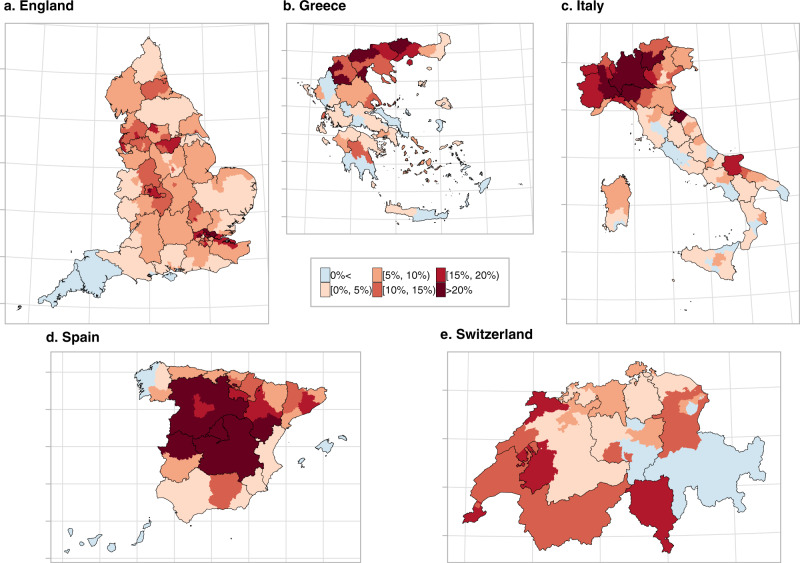
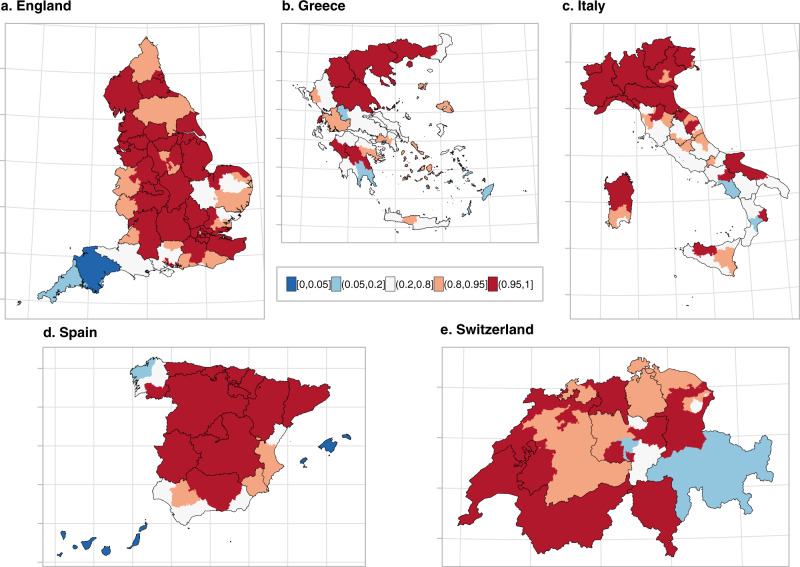
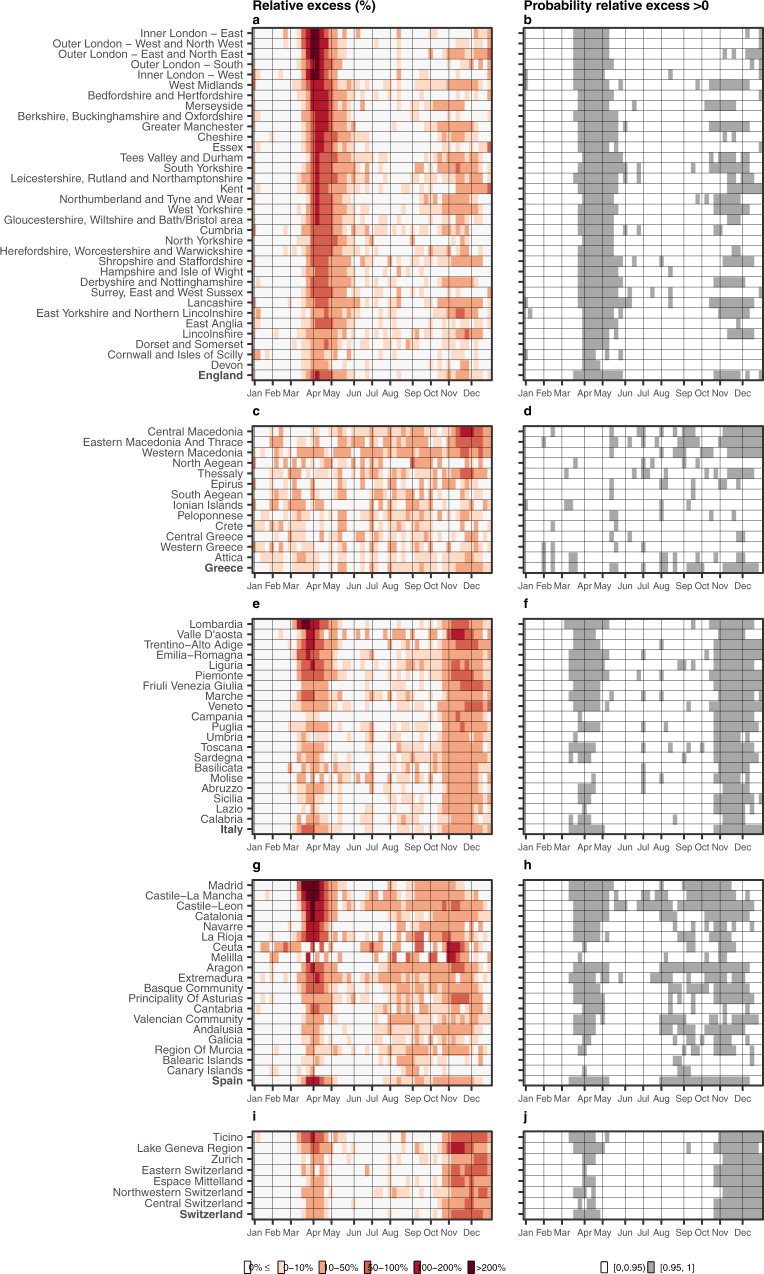
The impact of the COVID-19 pandemic on excess mortality from all causes in 2020 varied across and within European countries. Using data for 2015-2019, we applied Bayesian spatio-temporal models to quantify the expected weekly deaths at the regional level had the pandemic not occurred in England, Greece, Italy, Spain, and Switzerland. With around 30%, Madrid, Castile-La Mancha, Castile-Leon (Spain) and Lombardia (Italy) were the regions with the highest excess mortality. In England, Greece and Switzerland, the regions most affected were Outer London and the West Midlands (England), Eastern, Western and Central Macedonia (Greece), and Ticino (Switzerland), with 15-20% excess mortality in 2020. Our study highlights the importance of the large transportation hubs for establishing community transmission in the first stages of the pandemic. Here, we show that acting promptly to limit transmission around these hubs is essential to prevent spread to other regions and countries.


Conflict of interest statement

The authors declare no competing interests.

Figures

Fig. 1
Fig. 1. Posterior distribution of relative excess deaths (%) across the different countries by NUTS2 region and sex in 2020.
a Posterior distribution of relative excess deaths (%) in males in England. b Posterior distribution of relative excess deaths (%) in females in England. c Posterior distribution of relative excess deaths (%) in males in Greece. d Posterior distribution of relative excess deaths (%) in females in Greece. e Posterior distribution of relative excess deaths (%) in males in Italy. f Posterior distribution of relative excess deaths (%) in females in Italy. g Posterior distribution of relative excess deaths (%) in males in Spain. h Posterior distribution of relative excess deaths (%) in females in Spain. i Posterior distribution of relative excess deaths (%) in males in Switzerland and j posterior distribution of relative excess deaths (%) in females in Switzerland. The black dots represent the medians of the posterior distribution of relative excess deaths. The red line highlights the 0% relative excess deaths, which means no observed difference in the 2020 mortality compared to the counterfactual scenario that the pandemic did not occur.
Fig. 2
Fig. 2. Median relative excess deaths (%) by NUTS3 region in 2020.
a Median relative excess deaths (%) in England. b Median relative excess deaths (%) in Greece. c Median relative excess deaths (%) in Italy. d Median relative excess deaths (%) in Spain and e median relative excess deaths (%) in Switzerland in categories. Areas in blue indicate areas that observed less deaths than expected had the pandemic not occurred, whereas the different shades of red indicate the higher relative excess mortality. The black solid lines correspond to the NUTS2 region borders.
Fig. 3
Fig. 3. Probability that the relative excess deaths is higher than 0% by NUTS3 region in 2020.
a Probability that the relative excess deaths is higher than 0% in England. b Probability that the relative excess deaths is higher than 0% in Greece. c Probability that the relative excess deaths is higher than 0% in Italy. d Probability that the relative excess deaths is higher than 0% in Spain and e probability that the relative excess deaths is higher than 0% in Switzerland. Areas in blue indicate areas that observed less deaths than expected had the pandemic not occurred, whereas the different shades of red indicate the higher relative excess mortality. The black solid lines correspond to the NUTS2 region borders.
Fig. 4
Fig. 4. Weekly median relative excess deaths (%) across the different countries by NUTS2 region in 2020 (left) and corresponding probability that the weekly relative excess is larger than 0% (right).
a Weekly median relative excess deaths in England. b Posterior probability that the relative excess is higher than 0% in England. c Weekly median relative excess deaths in Greece. d Posterior probability that the relative excess is higher than 0% in Greece. e Weekly median relative excess deaths in Italy. f Posterior probability that the relative excess is higher than 0% in Italy. g Weekly median relative excess deaths in Spain. h Posterior probability that the relative excess is higher than 0% in Spain. i Weekly median relative excess deaths in Switzerland and j posterior probability that the relative excess is higher than 0% in Switzerland. Different shades of red on the panels a, c, e, g and i indicate higher relative excess mortality, whereas the white ones relative excess mortality lower than 0%. The white colour on the panels b, d, f, h and j indicate insufficient evidence of a relative excess larger than 0%, whereas the grey strong evidence.

References

    1. Health Organization, W. The true death toll of COVID-19: estimating global excess mortality https://www.who.int/data/stories/the-true-death-toll-of-covid-19-estimat... (2021).
    1. Li R, et al. Substantial undocumented infection facilitates the rapid dissemination of novel coronavirus (SARS-CoV-2) Science. 2020;368:489–493. doi: 10.1126/science.abb3221. - DOI - PMC - PubMed
    1. Karanikolos, M. & McKee, M. How comparable is COVID-19 mortality across countries? https://analysis.covid19healthsystem.org/index.php/2020/06/04/how-compar... (2020).
    1. Spiegelhalter, D. Coronavirus deaths: how does Britain compare with other countries? https://www.theguardian.com/commentisfree/2020/apr/30/coronavirus-deaths... (2020).
    1. Kaczorowski J, Del Grande C. Beyond the tip of the iceberg: direct and indirect effects of COVID-19. Lancet Digital Health. 2021;3:e205–e206. doi: 10.1016/S2589-7500(21)00024-8. - DOI - PMC - PubMed

Publication types

MeSH terms