

Uncovering emergent phenotypes in endothelial cells by clustering of surrogates of cardiovascular risk factors
- PMID: 35079076
- PMCID: PMC8789842
- DOI: 10.1038/s41598-022-05404-7
Uncovering emergent phenotypes in endothelial cells by clustering of surrogates of cardiovascular risk factors
Abstract
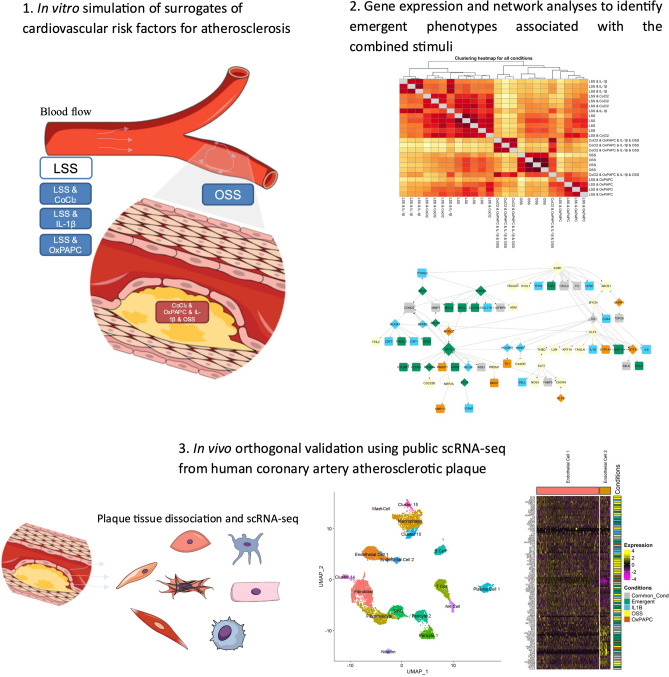
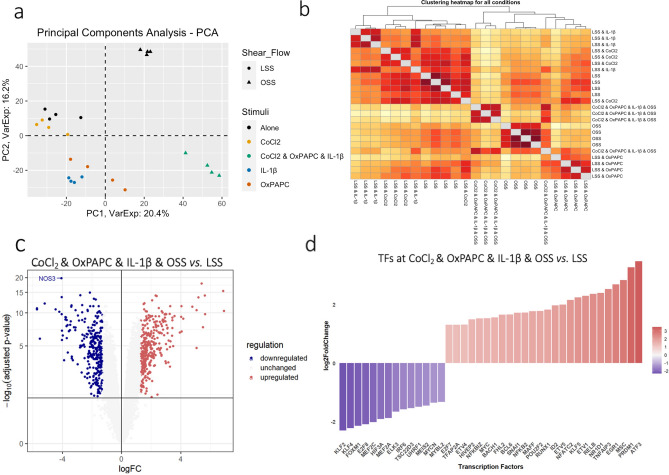
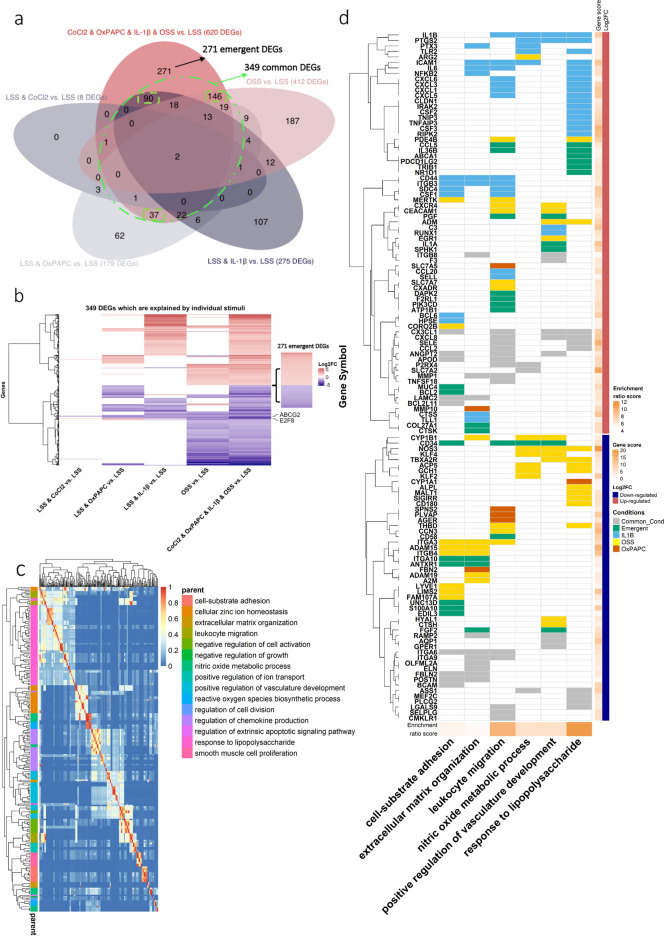
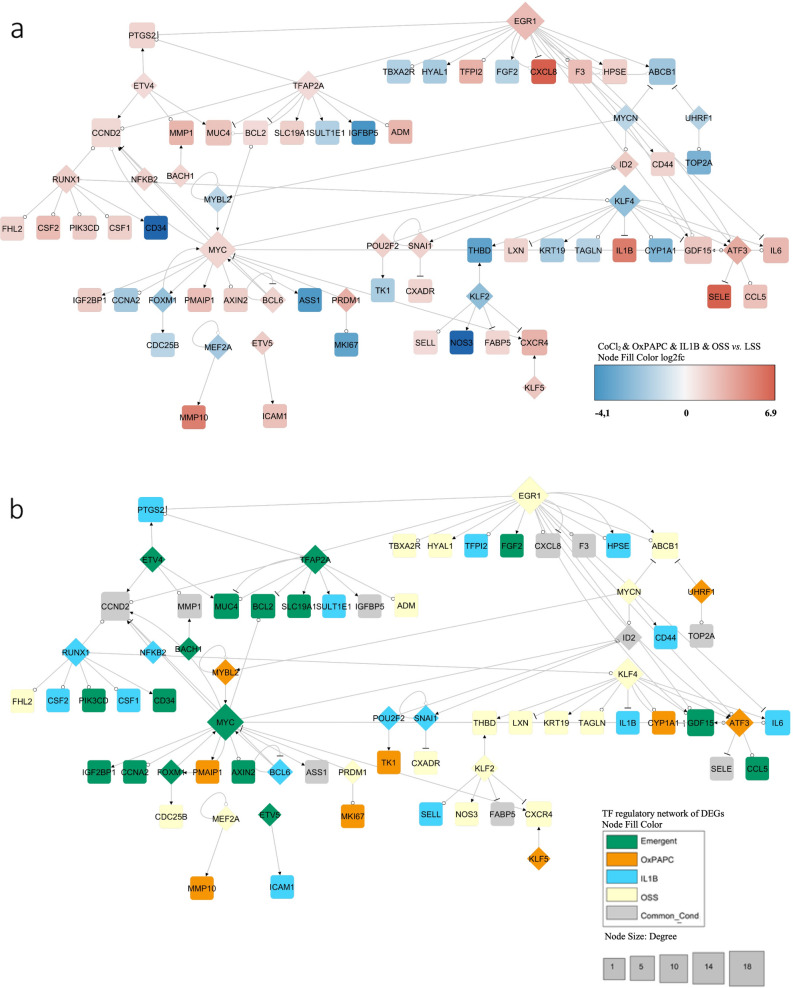
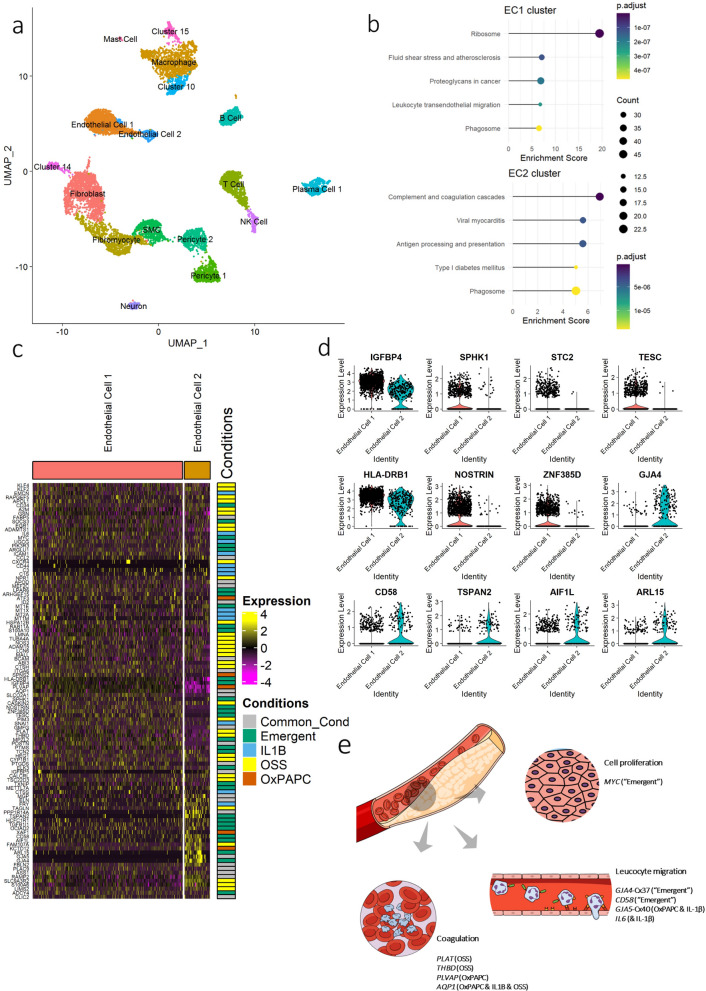
Endothelial dysfunction (ED) is a hallmark of atherosclerosis and is influenced by well-defined risk factors, including hypoxia, dyslipidemia, inflammation, and oscillatory flow. However, the individual and combined contributions to the molecular underpinnings of ED remain elusive. We used global gene expression in human coronary artery endothelial cells to identify gene pathways and cellular processes in response to chemical hypoxia, oxidized lipids, IL-1β induced inflammation, oscillatory flow, and these combined stimuli. We found that clustering of the surrogate risk factors differed from the sum of the individual insults that gave rise to emergent phenotypes such as cell proliferation. We validated these observations in samples of human coronary artery atherosclerotic plaques analyzed using single-cell RNA sequencing. Our findings suggest a hierarchical interaction between surrogates of CV risk factors and the advent of emergent phenotypes in response to combined stimulation in endothelial cells that may influence ED.
© 2022. The Author(s).
Conflict of interest statement
The authors declare no competing interests.
Figures
Similar articles
-
Cardiovascular risk factors and molecular routes underlying endothelial dysfunction: Novel opportunities for primary prevention.Biochem Pharmacol. 2022 Aug;202:115108. doi: 10.1016/j.bcp.2022.115108. Epub 2022 May 26. Biochem Pharmacol. 2022. PMID: 35643340 Review.
-
Profiling the unique protective properties of intracranial arterial endothelial cells.Acta Neuropathol Commun. 2019 Oct 14;7(1):151. doi: 10.1186/s40478-019-0805-4. Acta Neuropathol Commun. 2019. PMID: 31610812 Free PMC article.
-
Deletion of BACH1 Attenuates Atherosclerosis by Reducing Endothelial Inflammation.Circ Res. 2022 Apr;130(7):1038-1055. doi: 10.1161/CIRCRESAHA.121.319540. Epub 2022 Feb 24. Circ Res. 2022. PMID: 35196865
-
Reducing residual cardiovascular risk in Europe: Therapeutic implications of European medicines agency approval of icosapent ethyl/eicosapentaenoic acid.Pharmacol Ther. 2022 Sep;237:108172. doi: 10.1016/j.pharmthera.2022.108172. Epub 2022 Mar 15. Pharmacol Ther. 2022. PMID: 35304222 Review.
-
Effects of sunitinib on endothelial dysfunction, metabolic changes, and cardiovascular risk indices in renal cell carcinoma.Cancer Med. 2020 Jun;9(11):3752-3757. doi: 10.1002/cam4.2910. Epub 2020 Apr 9. Cancer Med. 2020. PMID: 32270594 Free PMC article.
Cited by
-
MicroRNA-1 protects the endothelium in acute lung injury.JCI Insight. 2023 Sep 22;8(18):e164816. doi: 10.1172/jci.insight.164816. JCI Insight. 2023. PMID: 37737266 Free PMC article.
-
Integrated systems biology approach identifies gene targets for endothelial dysfunction.Mol Syst Biol. 2023 Dec 6;19(12):e11462. doi: 10.15252/msb.202211462. Epub 2023 Nov 30. Mol Syst Biol. 2023. PMID: 38031960 Free PMC article.
-
Diversity of arterial cell and phenotypic heterogeneity induced by high-fat and high-cholesterol diet.Front Cell Dev Biol. 2023 Feb 23;11:971091. doi: 10.3389/fcell.2023.971091. eCollection 2023. Front Cell Dev Biol. 2023. PMID: 36910156 Free PMC article.
-
Additional improvement in regional myocardial ischemia after intracardiac injection of bone marrow cells during CABG surgery.Front Cardiovasc Med. 2023 Feb 7;10:1040188. doi: 10.3389/fcvm.2023.1040188. eCollection 2023. Front Cardiovasc Med. 2023. PMID: 36824456 Free PMC article.
-
The chemical composition of secondary organic aerosols regulates transcriptomic and metabolomic signaling in an epithelial-endothelial in vitro coculture.Part Fibre Toxicol. 2024 Sep 19;21(1):38. doi: 10.1186/s12989-024-00600-x. Part Fibre Toxicol. 2024. PMID: 39300536 Free PMC article.
References
Publication types
MeSH terms
Substances
Grants and funding
LinkOut - more resources
Full Text Sources
Molecular Biology Databases
