. 2022 Apr 1;37(4):777-792.
doi: 10.1093/humrep/deac008.

Trophectoderm differentiation to invasive syncytiotrophoblast is promoted by endometrial epithelial cells during human embryo implantation

Affiliations

Trophectoderm differentiation to invasive syncytiotrophoblast is promoted by endometrial epithelial cells during human embryo implantation

Peter T Ruane et al. Hum Reprod. .

Abstract

Study question: How does the human embryo breach the endometrial epithelium at implantation?

Summary answer: Embryo attachment to the endometrial epithelium promotes the formation of multinuclear syncytiotrophoblast from trophectoderm, which goes on to breach the epithelial layer.

What is known already: A significant proportion of natural conceptions and assisted reproduction treatments fail due to unsuccessful implantation. The trophectoderm lineage of the embryo attaches to the endometrial epithelium before breaching this barrier to implant into the endometrium. Trophectoderm-derived syncytiotrophoblast has been observed in recent in vitro cultures of peri-implantation embryos, and historical histology has shown invasive syncytiotrophoblast in embryos that have invaded beyond the epithelium, but the cell type mediating invasion of the epithelial layer at implantation is unknown.

Study design, size, duration: Fresh and frozen human blastocyst-stage embryos (n = 46) or human trophoblast stem cell (TSC) spheroids were co-cultured with confluent monolayers of the Ishikawa endometrial epithelial cell line to model the epithelial phase of implantation in vitro. Systems biology approaches with published transcriptomic datasets were used to model the epithelial phase of implantation in silico.

Participants/materials, setting, methods: Human embryos surplus to treatment requirements were consented for research. Day 6 blastocysts were co-cultured with Ishikawa cell layers until Day 8, and human TSC spheroids modelling blastocyst trophectoderm were co-cultured with Ishikawa cell layers for 48 h. Embryo and TSC morphology was assessed by immunofluorescence microscopy, and TSC differentiation by real-time quantitative PCR (RT-qPCR) and ELISA. Single-cell human blastocyst transcriptomes, and bulk transcriptomes of TSC and primary human endometrial epithelium were used to model the trophectoderm-epithelium interaction in silico. Hypernetworks, pathway analysis, random forest machine learning and RNA velocity were employed to identify gene networks associated with implantation.

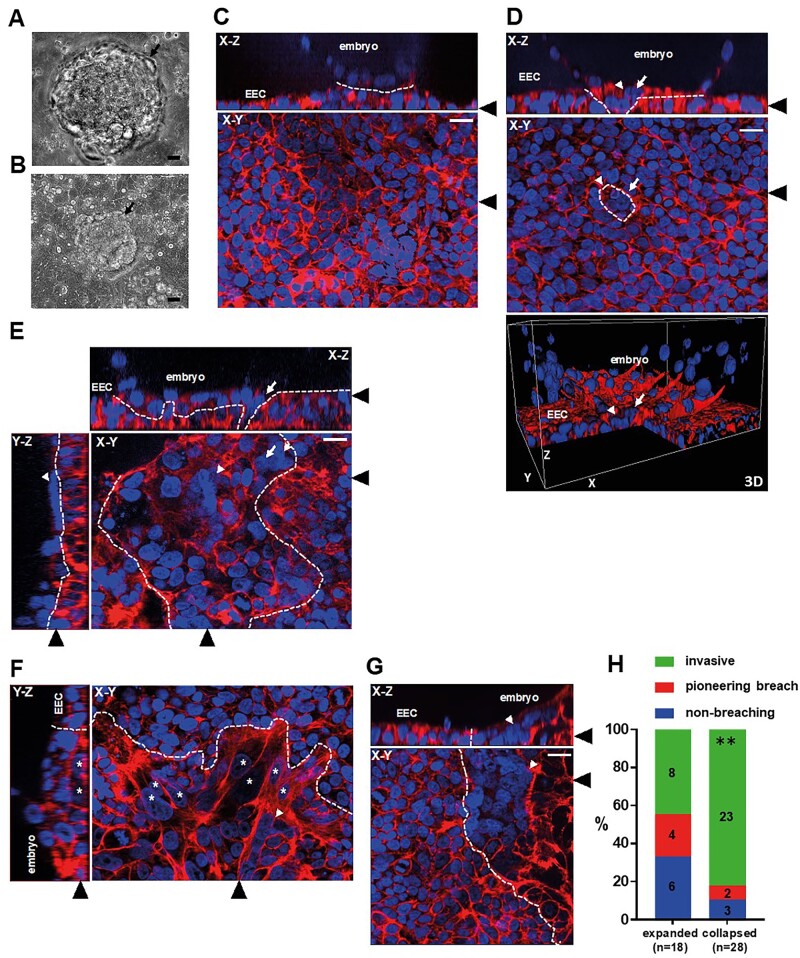
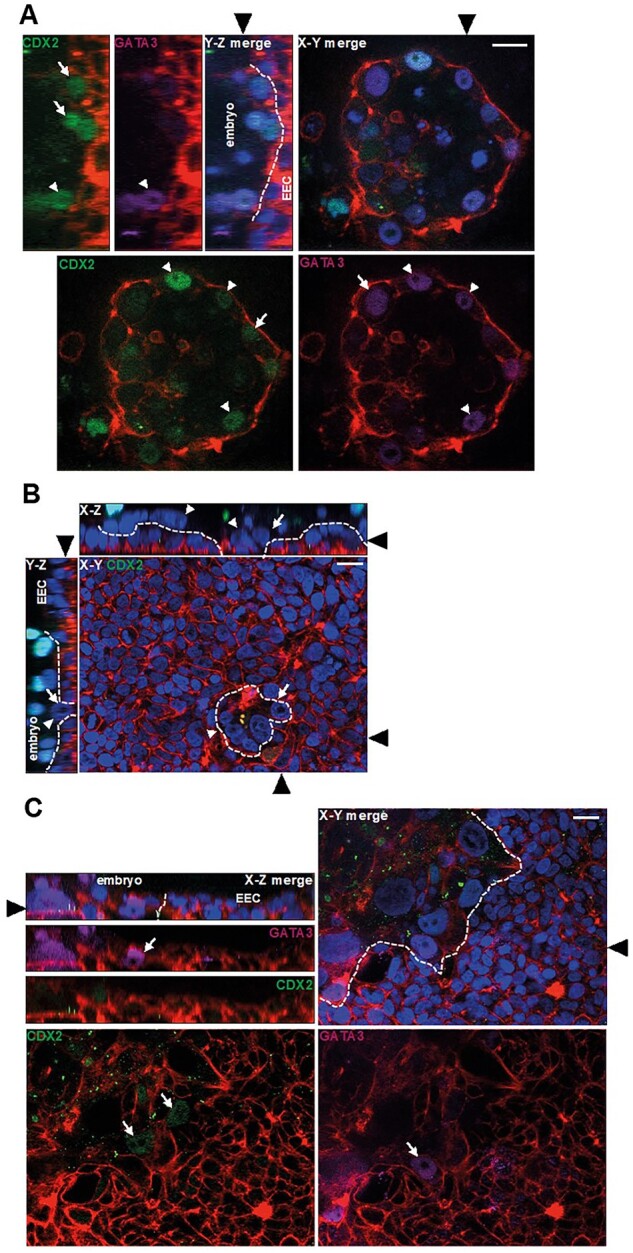
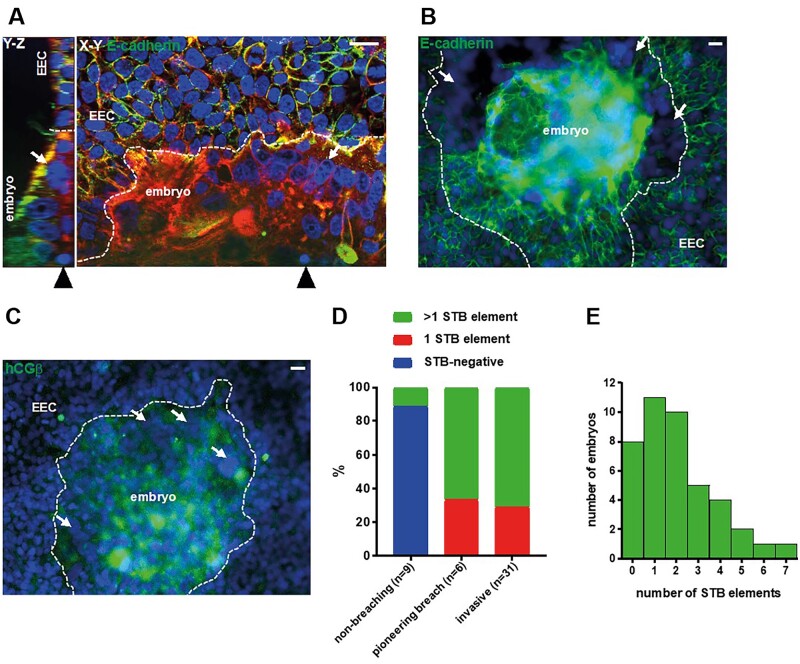
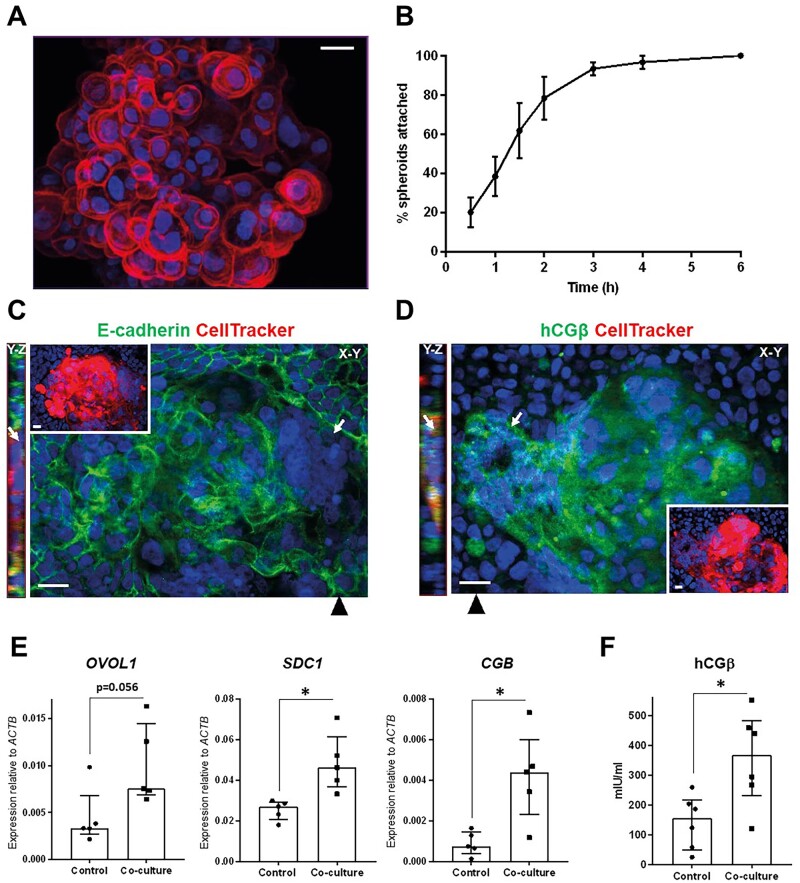
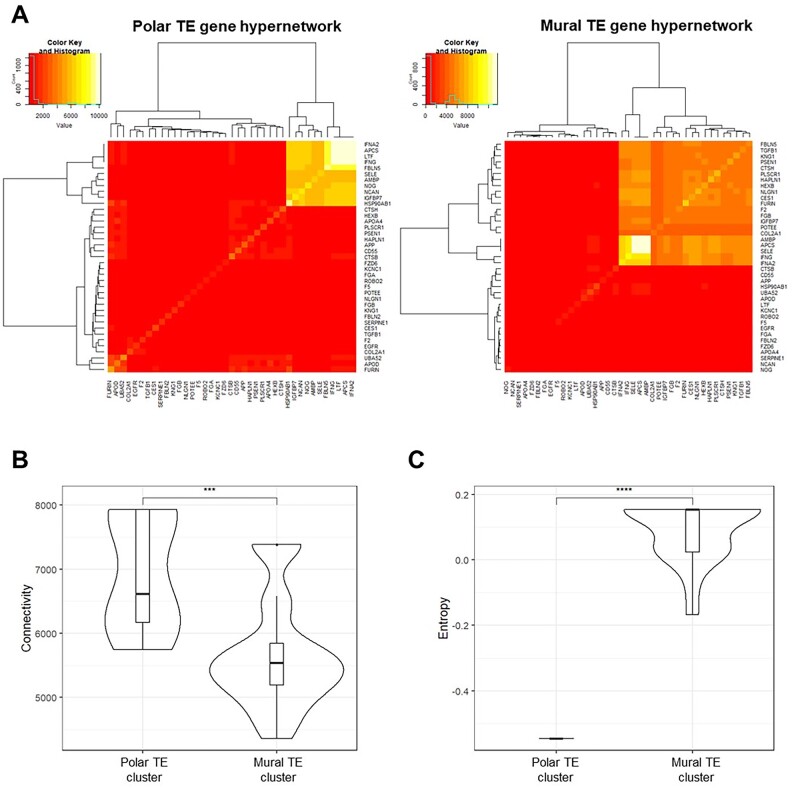
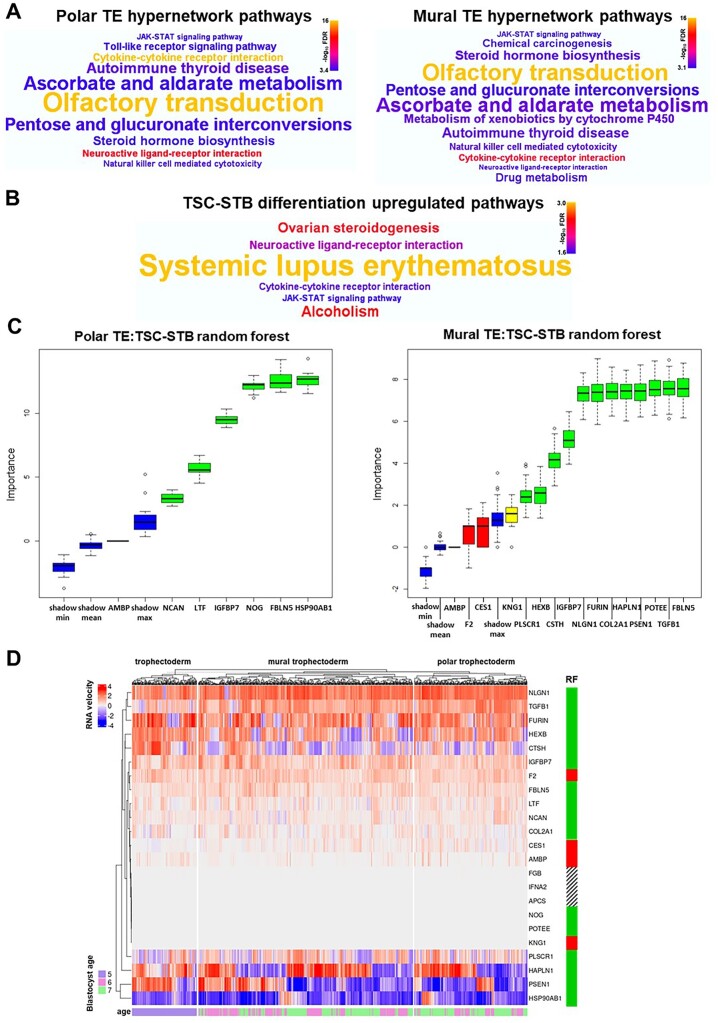
Main results and the role of chance: The majority of embryos co-cultured with Ishikawa cell layers from Day 6 to 8 breached the epithelial layer (37/46), and syncytiotrophoblast was seen in all of these. Syncytiotrophoblast was observed at the embryo-epithelium interface before breaching, and syncytiotrophoblast mediated all pioneering breaching events observed (7/7 events). Multiple independent syncytiotrophoblast regions were seen in 26/46 embryos, suggesting derivation from different regions of trophectoderm. Human TSC spheroids co-cultured with Ishikawa layers also exhibited syncytiotrophoblast formation upon invasion into the epithelium. RT-qPCR comparison of TSC spheroids in isolated culture and co-culture demonstrated epithelium-induced upregulation of syncytiotrophoblast genes CGB (P = 0.03) and SDC1 (P = 0.008), and ELISA revealed the induction of hCGβ secretion (P = 0.03). Secretory-phase primary endometrial epithelium surface transcriptomes were used to identify trophectoderm surface binding partners to model the embryo-epithelium interface. Hypernetwork analysis established a group of 25 epithelium-interacting trophectoderm genes that were highly connected to the rest of the trophectoderm transcriptome, and epithelium-coupled gene networks in cells of the polar region of the trophectoderm exhibited greater connectivity (P < 0.001) and more organized connections (P < 0.0001) than those in the mural region. Pathway analysis revealed a striking similarity with syncytiotrophoblast differentiation, as 4/6 most highly activated pathways upon TSC-syncytiotrophoblast differentiation (false discovery rate (FDR < 0.026)) were represented in the most enriched pathways of epithelium-coupled gene networks in both polar and mural trophectoderm (FDR < 0.001). Random forest machine learning also showed that 80% of the endometrial epithelium-interacting trophectoderm genes identified in the hypernetwork could be quantified as classifiers of TSC-syncytiotrophoblast differentiation. This multi-model approach suggests that invasive syncytiotrophoblast formation from both polar and mural trophectoderm is promoted by attachment to the endometrial epithelium to enable embryonic invasion.

Large scale data: No omics datasets were generated in this study, and those used from previously published studies are cited.

Limitations, reasons for caution: In vitro and in silico models may not recapitulate the dynamic embryo-endometrial interactions that occur in vivo. The influence of other cellular compartments in the endometrium, including decidual stromal cells and leukocytes, was not represented in these models.

Wider implications of the findings: Understanding the mechanism of human embryo breaching of the epithelium and the gene networks involved is crucial to improve implantation success rates after assisted reproduction. Moreover, early trophoblast lineages arising at the epithelial phase of implantation form the blueprint for the placenta and thus underpin foetal growth trajectories, pregnancy health and offspring health.

Study funding/competing interest(s): This work was funded by grants from Wellbeing of Women, Diabetes UK, the NIHR Local Comprehensive Research Network and Manchester Clinical Research Facility, and the Department of Health Scientist Practitioner Training Scheme. None of the authors has any conflict of interest to declare.

Keywords: cell culture; embryo development; gene expression; implantation; trophoblasts.


Figures

Figure 1.
Figure 1.
Syncytiotrophoblast (STB) pioneers embryo invasion of the Ishikawa endometrial epithelial cell (EEC) layer. (A, B) Phase contrast images of embryos attached to Ishikawa EEC layers, showing expanded blastocyst and collapsed blastocyst morphology. Black arrows indicate embryos. Scale bars 20 µm. (C–G) Attached embryos were stained with phalloidin (red) and DAPI (blue) to label actin and nuclei, respectively, and imaged by optical sectioning fluorescence microscopy. Panels show X–Y, X–Z and Y–Z planes and a 3D image, as labelled. Ishikawa EEC and embryos are indicated in X–Z and Y–Z planes and the 3D image. Black arrowheads indicate the region of the section for the adjoining panels. White arrows indicate trophoblast breaching of the Ishikawa EEC layer, white arrowheads indicate STB, and white asterisks indicate invasive mononuclear trophoblast. Dotted lines indicate embryo-EEC interface. Scale bars 20 µm. (H) Bar graph showing proportions of embryo morphologies (n = 46). **P < 0.01 Chi-squared. DAPI, 4′,6-diamidino-2-phenylindole.
Figure 2.
Figure 2.
Trophectoderm (TE) transcription factors at the embryo- endometrial epithelial cell (EEC) interface. (A) Fluorescence optical sections of an attached embryo labelled with phalloidin (red), DAPI (blue), anti-CDX2 (green) and anti-GATA3 antibody (magenta). Y–Z and X–Y planes are shown, and Ishikawa EEC and embryos are indicated Y–Z panel. Black arrowheads indicate the location of the section for the adjoining panels. White arrows show CDX2 or GATA3-positive TE and white arrowheads indicate double-positive CDX2–GATA3-positive TE. Dotted lines indicate embryo-EEC interface. Scale bar 20 µm. (B) An attached embryo labelled with phalloidin (red), DAPI (blue) and anti-CDX2 antibody (green) and imaged by optical sectioning fluorescence microscopy. The planes shown in each panel are indicated (X–Z, X–Y) and black arrowheads indicate the location of the section for the adjoining panels. White arrows point to trophoblast breaching of the Ishikawa EEC layer and white arrowheads indicate STB. Dotted lines indicate embryo-EEC interface. Scale bar 20 µm. (C) An invasive embryo labelled with phalloidin (red), DAPI (blue), anti-CDX2 (green) and anti-GATA3 antibody (magenta), optical planes indicated on the panels. White arrows indicate CDX2- or GATA3-positive mononuclear trophoblast. Black arrowheads indicate the location of the section for the adjoining panels. Dotted lines indicate embryo-EEC interface. Scale bar 20 µm. DAPI, 4′,6-diamidino-2-phenylindole.
Figure 3.
Figure 3.
Multiple regions of syncytiotrophoblast (STB) form at the embryo- endometrial epithelial cell (EEC) interface. (A) Fluorescence optical sections of an invasive embryo labelled with phalloidin (red), DAPI (blue) and anti-E-cadherin (green), panels show Y–Z and X–Y planes. Black arrowheads point to the location of the section for the adjoining panel. White arrows indicate STB. Scale bars 20 µm. (B) Fluorescence micrograph of an invasive embryo labelled with DAPI (blue) and E-cadherin (green). White arrows point to distinct regions of STB. Dotted lines indicate embryo-EEC interface. Scale bar 20 µm. (C) Fluorescence microscopy image of an invasive embryo labelled with DAPI (blue) and anti-hCGβ (green). White arrows point to distinct regions of STB. Dotted lines indicate embryo-EEC interface. Scale bar 20 µm. (D) Bar graph relating STB quantities to embryo invasiveness (n = 46). (E) Bar graph of STB quantities in embryos (n = 42; the number of STB elements could not be discerned in four samples). DAPI, 4′,6-diamidino-2-phenylindole.
Figure 4.
Figure 4.
Syncytiotrophoblast (STB) formation from trophoblast stem cell (TSC) spheroids is promoted by Ishikawa endometrial epithelial cell (EEC) layers. (A) TSC spheroid labelled with phalloidin (red) and DAPI (blue), imaged by optical sectioning fluorescence microscopy and displayed as maximum intensity projection. Scale bar 20 µm. (B) TSC spheroid attachment to Ishikawa EEC layers was monitored over 6 h. Three independent repeats were performed (∼20 spheroids per repeat), mean ± SEM plotted on line graph. CellTracker-loaded TSC spheroids attached to Ishikawa EEC layers after 48 h co-culture were labelled with DAPI (blue) and (C) anti-E-cadherin (green) or (D) anti-hCGβ (green), and optically sectioned by fluorescence microscopy. X–Y and Y–Z planes are shown as indicated, with black arrowheads indicating the location of the Y–Z plane. CellTracker (red) and DAPI labelling is shown in insets. STB is indicated by white arrows. Scale bars 20 µm. (E) TSC spheroid-Ishikawa EEC co-cultures and isolated TSC and Ishikawa EEC cultures were lysed after 48 h for real-time quantitative PCR (RT-qPCR) analysis. Expression of STB markers OVOL1, SDC1 and CGB was assessed relative to ACTB expression. Five experimental repeats, median ± IQR plotted, *P < 0.05 Mann–Whitney. (F) Medium was collected from TSC spheroid-Ishikawa EEC co-cultures and isolated TSC and Ishikawa EEC cultures after 48 h for hCGβ ELISA. Six experimental repeats, median ± IQR plotted, * P < 0.05 Mann–Whitney. DAPI, 4′,6-diamidino-2-phenylindole.
Figure 5.
Figure 5.
Polar and mural trophectoderm (TE) gene networks are differentially connected to endometrial epithelial cell (EEC) surface genes in an in silico model of the TE-EEC interface. (A) Hypernetwork analysis was performed on EEC-interacting TE genes (n = 39) in polar TE cells (n = 86) and mural TE cells (n = 245), and presented as a heatmap. Eleven genes form the highly connected central cluster in the polar TE hypernetwork and 21 genes form that in the mural TE hypernetwork. (B) Connectivity of hypernetwork clusters (the number of pairwise shared correlations) in polar and mural TE is presented as a violin plot. Median line and interquartile range are illustrated in each box, and whiskers illustrate the range with outliers as points. ***P < 0.001 Wilcoxon rank sum test. (C) Entropy from the hypernetwork clusters of polar and mural TE (a measure of the organization of gene connections), relative to entropy generated by permuting 1000 hypernetworks of random genes within the respective transcriptomes. Comparison of absolute entropy values between gene networks and subsets therein is not informative connectivity organization. Data are presented in violin plot form as above. ****P < 0.0001 Wilcoxon rank sum test.
Figure 6.
Figure 6.
Endometrial epithelial cell (EEC)-interacting trophectoderm (TE) gene networks are coupled to syncytiotrophoblast (STB) differentiation pathways. (A) Word clouds representing highly enriched (FDR < 0.001) KEGG pathways from over-representation analysis of genes connected within the polar and mural TE hypernetwork clusters, respectively. Word size reflects enrichment ratio, colour relates to significance level. Full list of significantly enriched pathways (FDR < 0.05) in Supplementary Tables SI and SII, respectively. (B) Word cloud representing the six most upregulated (FDR < 0.026) KEGG pathways from gene set enrichment analysis of genes differentially expressed upon trophoblast stem cell (TSC) differentiation to STB (P < 0.01, TSC n = 4, STB n = 4; Okae et al., 2018). Word size relates to enrichment ratio, colour to significance level. Full list of significantly enriched pathways (FDR < 0.05) in Supplementary Table SIII. (C) Boruta plots of random forest machine learning (1000 iterations) showing STB classification importance (TSC n = 4, STB n = 4; Okae et al., 2018) of hypernetwork-clustered EEC-interacting polar and mural TE genes expressed in TSC/STB (n = 7 and n = 16, respectively). Box-whisker plots represent importance Z-scores, a metric of informativity of a variable for classification. Green confirms statistical significance in the classification of STB, red indicates a non-informative gene in the classification of STB, yellow indicates a failure to either confirm or reject a gene as informative within the allotted number of random forest runs, and blue demonstrates the background variation of predictive value within the data. (D) RNA velocity was measured for each distinct hypernetwork-clustered EEC-interacting TE gene (n = 23, IFNG and SELE velocity data not available) in each cell of Day 5 TE (polar and mural distinction not available) and Day 6 and 7 polar and mural TE (Petropoulos et al., 2016). These velocity values were clustered within TE cell types in a heatmap, with blastocyst age in days indicated for each TE cell and random forest (RF) classification also indicated for each gene (green, variable of importance in the classification of STB; red, non-informative variable in the classification of STB; barred, importance not determined due to lack of expression in TSC/STB). FDR, false discovery rate.

References

    1. Aberkane A, Essahib W, Spits C, De Paepe C, Sermon K, Adriaenssens T, Mackens S, Tournaye H, Brosens JJ, Van de Velde H.. Expression of adhesion and extracellular matrix genes in human blastocysts upon attachment in a 2D co-culture system. Mol Hum Reprod 2018;24:375–387. - PubMed
    1. Alikani M. Epithelial cadherin distribution in abnormal human pre-implantation embryos. Hum Reprod 2005;20:3369–3375. - PubMed
    1. Altmae S, Reimand J, Hovatta O, Zhang P, Kere J, Laisk T, Saare M, Peters M, Vilo J, Stavreus-Evers A. et al. Research resource: interactome of human embryo implantation: identification of gene expression pathways, regulation, and integrated regulatory networks. Mol Endocrinol 2012;26:203–217. - PMC - PubMed
    1. Aplin JD. Developmental cell biology of human villous trophoblast: current research problems. Int J Dev Biol 2010;54:323–329. - PubMed
    1. Aplin JD, Jones CJ, Harris LK.. Adhesion molecules in human trophoblast—a review. I. Villous trophoblast. Placenta 2009;30:293–298. - PubMed

Publication types