. 2022 Apr 1;37(4):629-638.
doi: 10.1093/humrep/deac011.

The changing tide of human fertility

Affiliations

The changing tide of human fertility

R John Aitken. Hum Reprod. .

Abstract

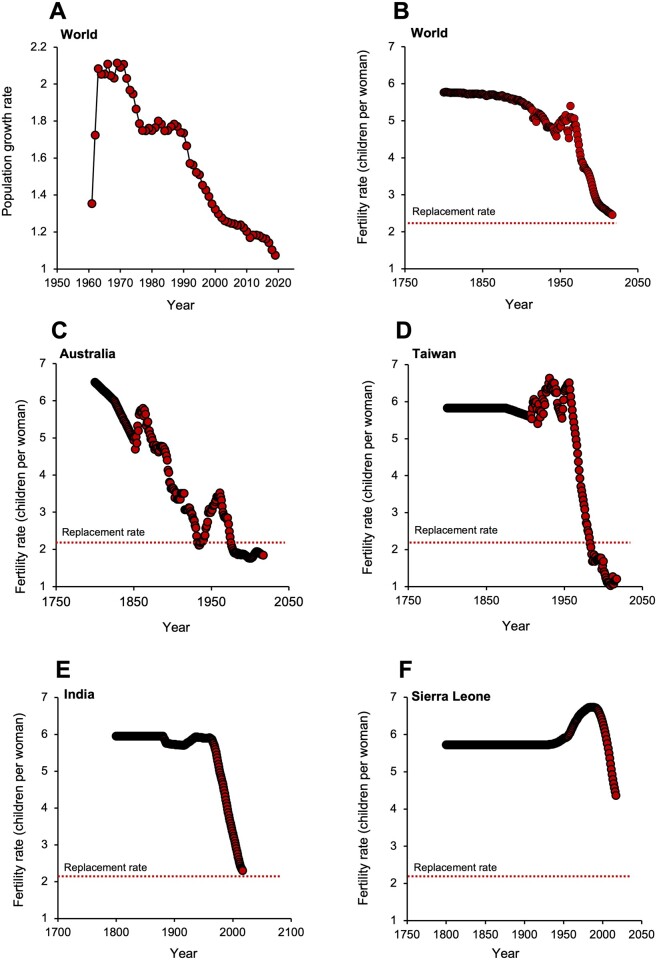
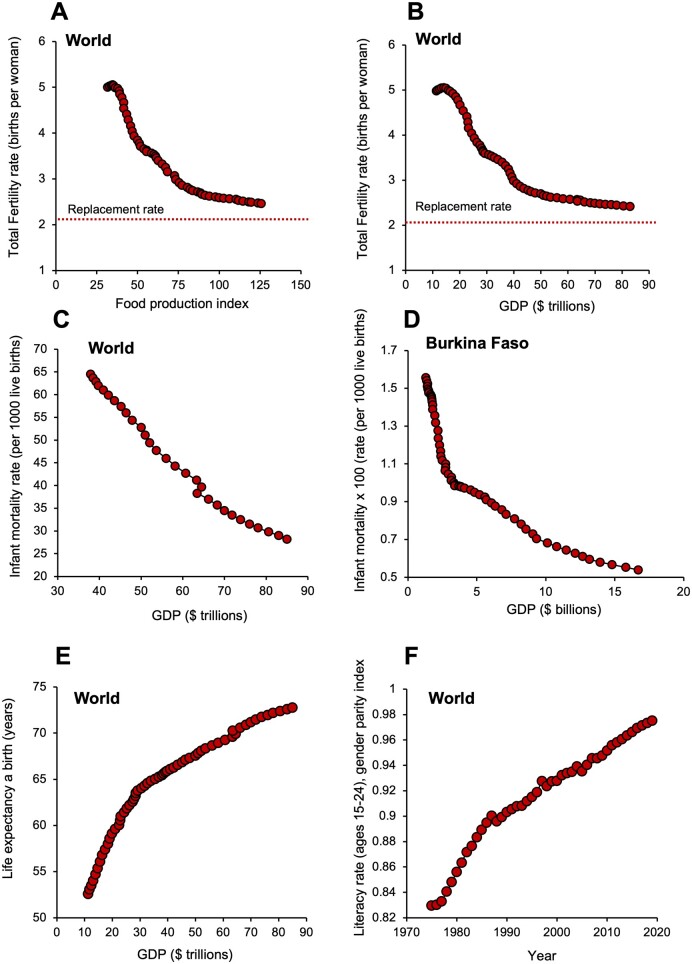
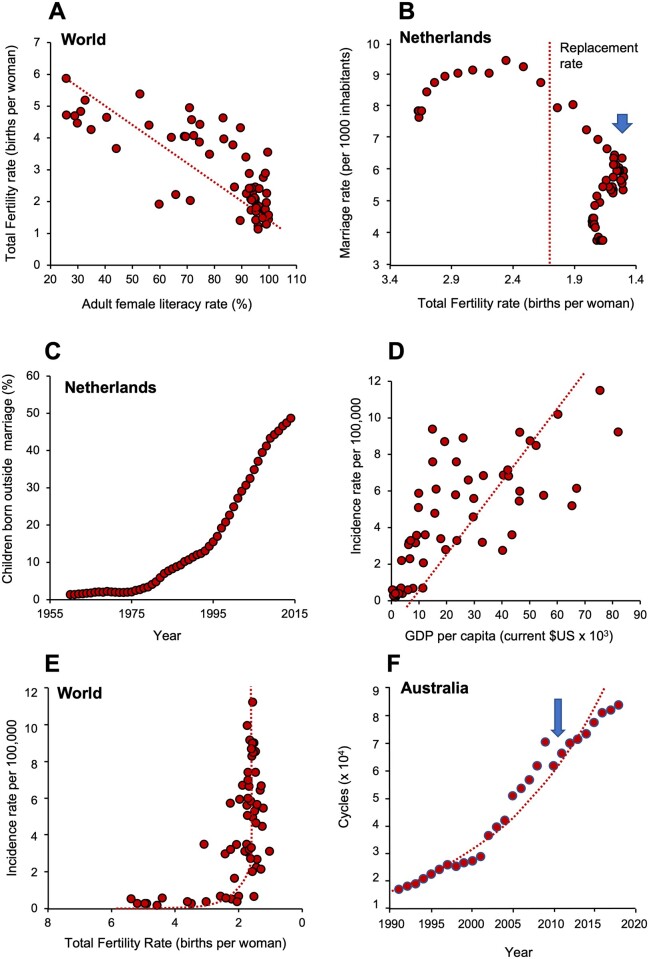
Over the past half-century, the world has witnessed a steep decline in fertility rates in virtually every country on Earth. This universal decline in fertility is being driven by increasing prosperity largely through the mediation of social factors, the most powerful of which are the education of women and an accompanying shift in life's purpose away from procreation. In addition, it is clear that environmental and lifestyle factors are also having a profound impact on our reproductive competence particularly in the male where increasing prosperity is associated with a significant rise in the incidence of testicular cancer and a secular decline in semen quality and testosterone levels. On a different timescale, we should also recognize that the increased prosperity associated with the demographic transition greatly reduces the selection pressure on high fertility genes by lowering the rates of infant and childhood mortality. The retention of poor fertility genes within the human population is also being exacerbated by the increased uptake of ART. It is arguable that all of these elements are colluding to drive our species into an infertility trap. If we are to avoid the latter, it will be important to recognize the factors contributing to this phenomenon and adopt the social, political, environmental and lifestyle changes needed to bring this situation under control.

Keywords: ART; fertility rates; genetics; population growth; social factors; sperm counts; testicular cancer.


Figures

Figure 1.
Figure 1.
Human population dynamics. (A) Changes in the rate of population growth. In the early 1960s, population growth rates approximated to 2.1% per annum. However, beginning in 1970 global population growth rates slowed dramatically and are now just over 1% per annum. Source: http://datacatalog.worldbank.org/ (4 October 2021, date last accessed). (B) Changes in global total fertility rate (TFR) over time; TFR is defined as the number of children born per woman over her lifetime, while replacement rate is defined as 2.1 children per woman. (C) Changes in TFR against time in Australia. (D) Changes in TFR against time in Taiwan as an exemplar of the Tiger economies of SE Asia. (E) Changes in TFR against time in India. (F) Changes in TFR against time in Sierra Leone as an exemplar of sub-Saharan Africa. Source: United Nations—Population Division (2019 revision) accessed via http://ourworldindata.org/fertility-rate. CC-BY (28 September 2021, date last accessed).
Figure 2.
Figure 2.
Drivers of fertility decline. (A) The global fall in total fertility rate (TFR) is not related to food availability; as TFR declines, the food production index (covers all food crops that are considered edible and that contain nutrients) actually increases. Source: https://data.worldbank.org/indicator/AG.PRD.FOOD.XD (16 December 2020, date last accessed). (B) The fall in TFR across the globe is associated with an increase in global prosperity, measured in terms of gross domestic product (GDP). (C) As GDP increases, so we see a steady decline in global infant mortality rates. (D) A plot of GDP against infant mortality for Burkina Faso reveals a rapid reduction in mortality rates for just a small increase in GDP. (E) In parallel with the reduction in infant/childhood mortality, the demographic transition is also associated with an increase in life expectancy. (F) In concert with increased prosperity, women gain greater access to education such that global literacy rates in men and women have now almost reached parity. For all panels, GDP is measured in constant 2010 $US; data from the World Bank Open Data (https://data.worldbank.org). CC BY-4.0 (15 September 2021, date last accessed).
Figure 3.
Figure 3.
Determinants of total fertility rate (TFR) decline. (A) A powerful negative correlation between adult female literacy rate and TFR across the world (P < 0.001). (B) Plot of TFR against marriage rate in the Netherlands, as an exemplar of a consistent trend seen in many developed countries. Note that as TFR declines to below replacement levels, marriage rates collapse (arrowed). Data on x-axis plotted in descending order. (C) The number of children born out of wedlock is increasing rapidly with time, again using the Netherlands as the exemplar. (D) A plot of testicular cancer rates against gross domestic product (GDP) per capita (measured in current $US) demonstrates a highly significant correlation (P < 0.001), indicating that the more prosperous a country becomes, the higher the incidence of testicular cancer. (E) When TFR falls to around replacement levels there is a sudden exponential increase in the incidence of testicular cancer, even though it remains a relatively rare condition. Data of x-axis plotted in descending order. (F) Increase in the uptake of ART in Australia (1991–2018). Arrow indicates a sudden, 13% reduction in ART uptake in 2010 when the Australian Government changed its Medicare rebate scheme. Source of data for panel (A): UNICEF (https://data.unicef.org/topic/gender/gender-disparities-in-education). CC BY-4.0 (03 October 2021, date last accessed). Sources of data for panels (B) and (C) from Our World in Data (http://ourworldindata.org/fertility-rate). CC-BY (28 September 2021, date last accessed). Sources of data for panels (D) and (E): Testicular cancers rates by country from GLOBOCAN database accessible at http://gco.iarc.fr/, as part of IARC’s Global Cancer Observatory. Fertility rates from World Bank Open data retrieved from https://data.worldbank.org/ (16 February 2021, date last accessed). Source of data for panel (F): The National Perinatal Epidemiology and Statistics Unit, the University of New South Wales Sydney. https://npesu.unsw.edu.au/ (5 September 2021, date last accessed).

References

    1. Agarwal A, Mulgund A, Hamada A, Chyatte MR.. A unique view on male infertility around the globe. Reprod Biol Endocrinol 2015;13:37. - PMC - PubMed
    1. Aitken RJ. The Infertility Trap; Why Life Choices Impact Your Fertility and Why We Must Act Now. Cambridge, UK: Cambridge University Press, 2022.
    1. Aitken RJ. The male is significantly implicated as the cause of unexplained infertility. Semin Reprod Med 2020a;38:3–20. - PubMed
    1. Aitken RJ. Impact of oxidative stress on male and female germ cells: implications for fertility. Reproduction 2020b;159:R189–R201. - PubMed
    1. Aitken RJ, Baker MA.. Oxidative stress, spermatozoa and leukocytic infiltration: relationships forged by the opposing forces of microbial invasion and the search for perfection. J Reprod Immunol 2013;100:11–19. - PubMed