. 2022 Feb;167(2):441-458.
doi: 10.1007/s00705-021-05343-0. Epub 2022 Jan 26.

Trypsin enhances SARS-CoV-2 infection by facilitating viral entry

Affiliations

Trypsin enhances SARS-CoV-2 infection by facilitating viral entry

Yeeun Kim et al. Arch Virol. 2022 Feb.

Abstract

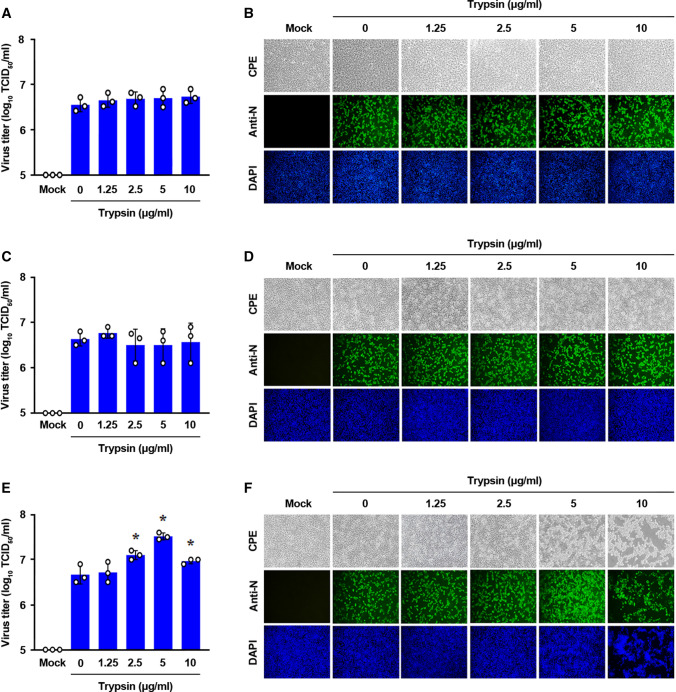
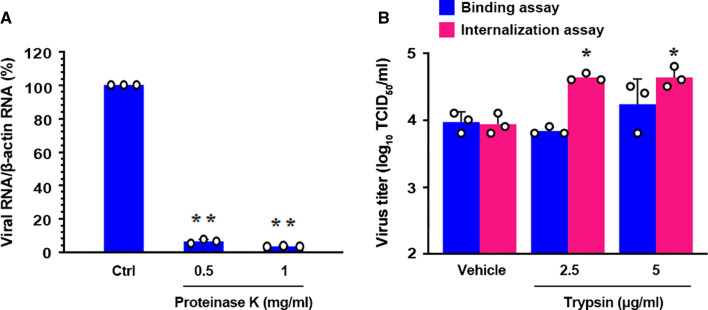
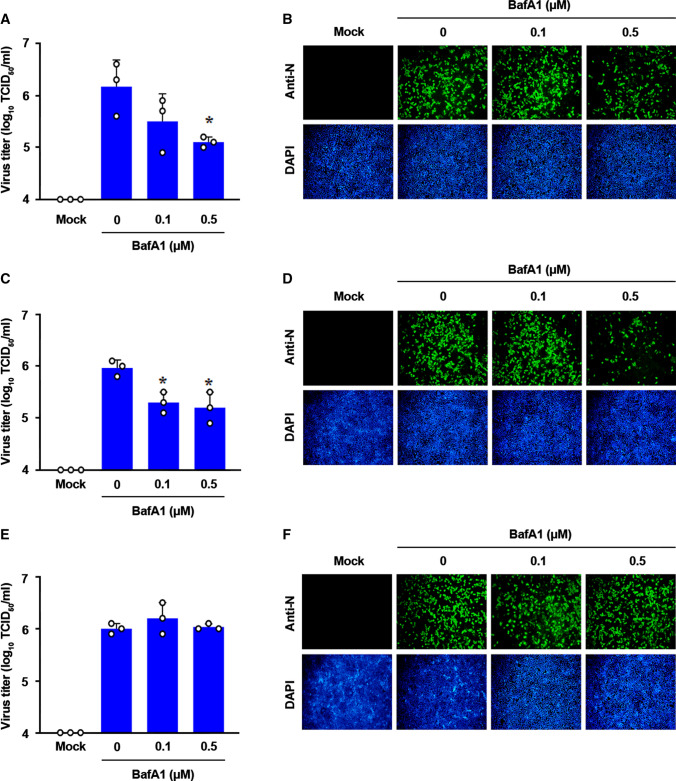
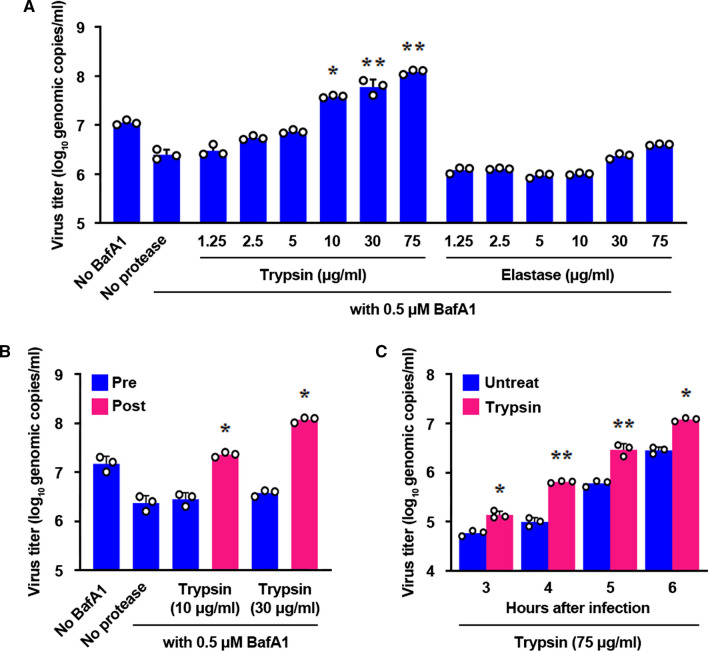
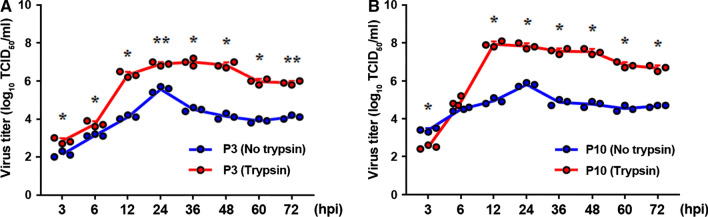
Coronaviruses infect cells by cytoplasmic or endosomal membrane fusion, driven by the spike (S) protein, which must be primed by proteolytic cleavage at the S1/S2 furin cleavage site (FCS) and the S2' site by cellular proteases. Exogenous trypsin as a medium additive facilitates isolation and propagation of several coronaviruses in vitro. Here, we show that trypsin enhances severe acute respiratory syndrome coronavirus 2 (SARS-CoV-2) infection in cultured cells and that SARS-CoV-2 enters cells via either a non-endosomal or an endosomal fusion pathway, depending on the presence of trypsin. Interestingly, trypsin enabled viral entry at the cell surface and led to more efficient infection than trypsin-independent endosomal entry, suggesting that trypsin production in the target organs may trigger a high level of replication of SARS-CoV-2 and cause severe tissue injury. Extensive syncytium formation and enhanced growth kinetics were observed only in the presence of exogenous trypsin when cell-adapted SARS-CoV-2 strains were tested. During 50 serial passages without the addition of trypsin, a specific R685S mutation occurred in the S1/S2 FCS (681PRRAR685) that was completely conserved but accompanied by several mutations in the S2 fusion subunit in the presence of trypsin. These findings demonstrate that the S1/S2 FCS is essential for proteolytic priming of the S protein and fusion activity for SARS-CoV-2 entry but not for viral replication. Our data can potentially contribute to the improvement of SARS-CoV-2 production for the development of vaccines or antivirals and motivate further investigations into the explicit functions of cell-adaptation-related genetic drift in SARS-CoV-2 pathogenesis.


Conflict of interest statement

The authors declare that they have no conflict of interest.

Figures

Fig. 1
Fig. 1
Trypsin-mediated enhancement of SARS-CoV-2 infection in cultured cells. (A and B) Vero E6 cells were preincubated with trypsin for 1 h before infection and then mock infected or infected with SARS-CoV-2 (P3) at an MOI of 1 for 1 h without trypsin addition. The virus-infected cells were then maintained in the absence of trypsin. (C and D) Vero E6 cells were mock infected or infected with SARS-CoV-2 (P3) at an MOI of 1 for 1 h in the presence of trypsin. The virus-infected cells were then maintained in the absence of trypsin. (E and F) Vero E6 cells were mock infected or infected with SARS-CoV-2 (P3) at an MOI of 1 for 1 h without trypsin addition. The virus-infected cells were then maintained in the presence of trypsin. The virus supernatants were collected at 24 hpi, and viral titers were determined (A, C, and E). SARS-CoV-2-specific CPE was monitored daily, and cells were photographed at 24 hpi using an inverted microscope at a magnification of 200× (top panels). For immunostaining, infected cells were fixed at 24 hpi and incubated with an MAb against the SARS-CoV-2 N protein, followed by incubation with Alexa green–conjugated goat anti-mouse secondary antibody (middle panels). The cells were then counterstained with DAPI (bottom panels) and examined under a fluorescence microscope at 200× magnification (B, D, and F). The values shown are the mean of three independent experiments, and error bars show the SDM. *, P = 0.001 to 0.05
Fig. 2
Fig. 2
Comparison of SARS-CoV-2 production in the presence and absence of trypsin. Vero E6 cells were mock infected or infected with tenfold serially diluted SARS-CoV-2 and further cultivated in the presence (A) or absence (B) of trypsin. The virus-infected cells were fixed at 24 hpi and incubated with an MAb against the SARS-CoV-2 N protein, followed by incubation with Alexa green–conjugated goat anti-mouse secondary antibody (top panels). The cells were then counterstained with DAPI (bottom panels) and examined under a fluorescence microscope at 200× magnification.
Fig. 3
Fig. 3
Effect of elastase on SARS-CoV-2 infection. (A and B) Vero E6 cells were preincubated with elastase for 1 h before infection and then mock infected or infected with SARS-CoV-2 (P3) at an MOI of 1 for 1 h without elastase addition. The virus-infected cells were then maintained in the absence of elastase. (C and D) Vero E6 cells were mock infected or infected with SARS-CoV-2 (P3) at an MOI of 1 for 1 h in the presence of elastase. The virus-infected cells were then maintained in the absence of elastase. (E and F) Vero E6 cells were mock infected or infected with SARS-CoV-2 (P3) at an MOI of 1 for 1 h without elastase addition. The virus-infected cells were then maintained in the presence of elastase. The virus supernatants were collected at 24 hpi, and viral titers were determined (A, C, and E). For immunostaining, infected cells were fixed at 24 hpi and incubated with an MAb against the SARS-CoV-2 N protein, followed by incubation with Alexa green–conjugated goat anti-mouse secondary antibody (top panels). The cells were then counterstained with DAPI (bottom panels) and examined under a fluorescence microscope at 200× magnification (B, D, and F). The values shown are the mean of three independent experiments, and error bars show the SDM.
Fig. 4
Fig. 4
Effect of proteases on SARS-CoV-2 propagation at early time points postinfection. Vero E6 cells were mock infected or infected with SARS-CoV-2 (P3) at an MOI of 1. At the indicated time points postinfection, trypsin (A) or elastase (B) was added to achieve a final concentration of 5 or 10 µg/ml, respectively. At 12 hpi, the culture supernatant was collected, and virus production was quantified by virus titration. Results are presented as the mean of three independent experiments, and error bars show the SDM. *, P < 0.05; **, P < 0.001
Fig. 5
Fig. 5
Effect of trypsin on SARS-CoV-2 entry. (A) Vero E6 cells were incubated with SARS-CoV-2 at an MOI of 1 at 4°C for 1 h, after which the unbound virus was removed and the cells were treated with proteinase K (0.5–1 mg/ml) at 4°C for 45 min. The cells were collected in TRIzol for RNA isolation and determination of the SARS-CoV-2 RNA copy number. Results are shown as a percentage of SARS-CoV-2 RNA copy number compared with controls (ctrl) in which PBS was substituted for proteinase K. (B) Vero E6 cells were infected with SARS-CoV-2 at an MOI of 1 at 4°C for 1 h and washed with cold PBS. The infected cells were then incubated in the presence or absence of trypsin (5 µg/ml), either at 4°C (binding; blue bars) or 37°C (internalization; red bars), for an additional 1 h. The virus-infected cells that were incubated at 37°C were then treated with proteinase K (0.5 mg/ml) at 37°C for 45 min. The infected cells were then serially diluted and plated onto fresh Vero E6 cells. At 24 h post-incubation, bound or internalized viruses were titrated. Data are expressed as the mean of three independent experiments performed in triplicate, and error bars represent the SDM. *, P < 0.05; **, P < 0.001
Fig. 6
Fig. 6
Effect of BafA1 on SARS-CoV-2 infection. (A and B) Vero E6 cells were preincubated with BafA1 for 1 h before infection and then mock infected or infected with SARS-CoV-2 (P3) at an MOI of 1 for 1h without BafA1 addition. The virus-infected cells were then maintained in the absence of BafA1. (C and D) Vero E6 cells were mock infected or infected with SARS-CoV-2 (P3) at an MOI of 1 for 1 h in the presence of BafA1. The virus-infected cells were then maintained in the absence of BafA1. (E and F) Vero E6 cells were mock infected or infected with SARS-CoV-2 (P3) at an MOI of 1 for 1 h without BafA1 addition. The virus-infected cells were then maintained in the presence of BafA1. The virus supernatants were collected at 24 hpi, and viral titers were determined (A, C, and E). For immunostaining, infected cells were fixed at 24 hpi and incubated with an MAb against the SARS-CoV-2 N protein, followed by incubation with Alexa green–conjugated goat anti-mouse secondary antibody (top panels). The cells were then counterstained with DAPI (bottom panels) and examined under a fluorescence microscope at 200× magnification (B, D, and F). The values shown are the mean of three independent experiments, and error bars show the SDM. *, P = 0.001 to 0.05
Fig. 7
Fig. 7
Entry of SARS-CoV-2 at the cell surface facilitated by trypsin. (A) Effect of proteases on the entry of SARS-CoV-2 into Vero E6 cells treated with BafA1. Vero E6 cells cultured in 6-well plates were treated with BafA1 at a concentration of 0.5 µM at 37℃ for 30 min, placed at 4℃ for 30 min, and infected with SARS-CoV-2 at an MOI of 1 for 30 min. Then, the cells were treated with various concentrations of trypsin or elastase at room temperature for 5 min and maintained in the presence of BafA1 for an additional 6 h. The amount of SARS-CoV-2 was measured quantitatively by real-time PCR. Cells not treated with BafA1 or those treated with BafA1 but not treated with trypsin or elastase were used as controls. (B) Effect of trypsin treatment before or after inoculation on SARS-CoV-2 infection in the presence of BafA1. Vero E6 cells were treated with BafA1 (0.5 µM) at 37℃ for 30 min and then treated with trypsin (10 and 30 µg/ml) at room temperature for 5 min before (pre) or after (post) virus inoculation. Viral infectivity was estimated quantitatively by real-time PCR. (C) SARS-CoV-2 kinetics after treatment with trypsin. Vero E6 cells were treated with BafA1, infected with SARS-CoV-2, and treated with 75 µg of trypsin per ml, as described in the legend to Fig. 7A. The production of SARS-CoV-2 was measured by real-time PCR at 3–6 h after virus inoculation. Vero E6 cells without any treatment were also infected as a control (untreated). The viral titers were expressed as genomic copies/ml. Data are expressed as the mean of three independent experiments, and error bars show the SDM. *, P < 0.05; **, P < 0.001
Fig. 8
Fig. 8
Cytopathic changes in virus-infected cells cultured in the presence or absence of trypsin. Fifty sequential passages were performed in Vero E6 cells in the presence or absence of trypsin. Vero E6 cells were mock infected or infected with each representative cell-adapted SARS-CoV-2 strain (P3, P10, P20, P30, P40, and P50) and maintained in the presence or absence of 5 µg of trypsin per ml. SARS-CoV-2-specific CPE was monitored daily, and cells were photographed at 24 hpi using an inverted microscope at a magnification of 200×.
Fig. 9
Fig. 9
One-step growth kinetics of SARS-CoV-2 strains passaged in the presence or absence of trypsin. Vero E6 cells were infected with each representative cell-adapted SARS-CoV-2 strain P3 (A) and P10 (B) and maintained in the presence or absence of 5 µg of trypsin per ml. At the indicated time points postinfection, culture supernatants were harvested, and virus titers were determined. Results are expressed as the mean of three independent experiments performed in triplicate, and error bars show the SDM. *, P < 0.05; **, P < 0.001
Fig 10
Fig 10
Schematic diagram of the amino acid differences between SARS-CoV-2 (P3) and its cell-adapted decedents (P10–P50). The organization of the SARS-CoV-2 genome, which is approximately 29.8 kb in length, is shown at the top. In the first diagram, blue arrows indicate the genes encoding nonstructural proteins (nsp1–16). In the second illustration, orange bars represent the identified ORFs. Light gray arrows represent the 5′ and 3′ untranslated regions. Lightly shaded areas are identical to those of SARS-CoV-2 (P3), and the vertical black bars represent individual amino acid positions where viruses from later passages differ from the P3 virus. Thin horizontal dashed lines indicate deletions. "S1/S2 FCS" represents the S1/S2 furin cleavage site (FCS), which contains multiple basic amino acids (681PRRAR685), and the vertical red bars indicate the R685S mutation in the S1/S2 FCS.

References

    1. Wang C, Horby PW, Hayden FG, Gao GF. A novel coronavirus outbreak of global health concern. Lancet. 2020;395:470–473. doi: 10.1016/S0140-6736(20)30185-9. - DOI - PMC - PubMed
    1. Zhu N, Zhang D, Wang W, Li X, Yang B, Song J, Zhao X, Huang B, Shi W, Lu R, Niu P, Zhan F, Ma X, Wang D, Xu W, Wu G, Gao GF, Tan W. A novel coronavirus from patients with pneumonia in China, 2019. N Engl J Med. 2020;382:727–733. doi: 10.1056/NEJMoa2001017. - DOI - PMC - PubMed
    1. Gorbalenya AE, Baker SC, Baric RS, Drosten C, Gulyaeva AA, Haagmans BL, Lauber C, Leontovich AM, Neuman BW, Penzar D, Perlman S, Poon LLM, Samborskiy DV, Sidorov IA, Sola I, Ziebuhr J. The species severe acute respiratory syndrome-related coronavirus: classifying 2019-nCoV and naming it SARS-CoV-2. Nat Microbiol. 2020;5:536–544. doi: 10.1038/s41564-020-0695-z. - DOI - PMC - PubMed
    1. Kolahchi Z, De Domenico M, Uddin LQ, Cauda V, Grossmann I, Lacasa L, Grancini G, Mahmoudi M, Rezaei N. COVID-19 and its global economic impact. Adv Exp Med Biol. 2021;1318:825–837. doi: 10.1007/978-3-030-63761-3_46. - DOI - PubMed
    1. Zhou P, Yang XL, Wang XG, Hu B, Zhang L, Zhang W, Si HR, Zhu Y, Li B, Huang CL, Chen HD, Chen J, Luo Y, Guo H, Jiang RD, Liu MQ, Chen Y, Shen XR, Wang X, Zheng XS, Zhao K, Chen QJ, Deng F, Liu LL, Yan B, Zhan FX, Wang YY, Xiao GF, Shi ZL. A pneumonia outbreak associated with a new coronavirus of probable bat origin. Nature. 2020;579:270–273. doi: 10.1038/s41586-020-2012-7. - DOI - PMC - PubMed